 Matrix map. (source: Pixabay)
 Map Transformations and Projections in CARTO and PostGIS
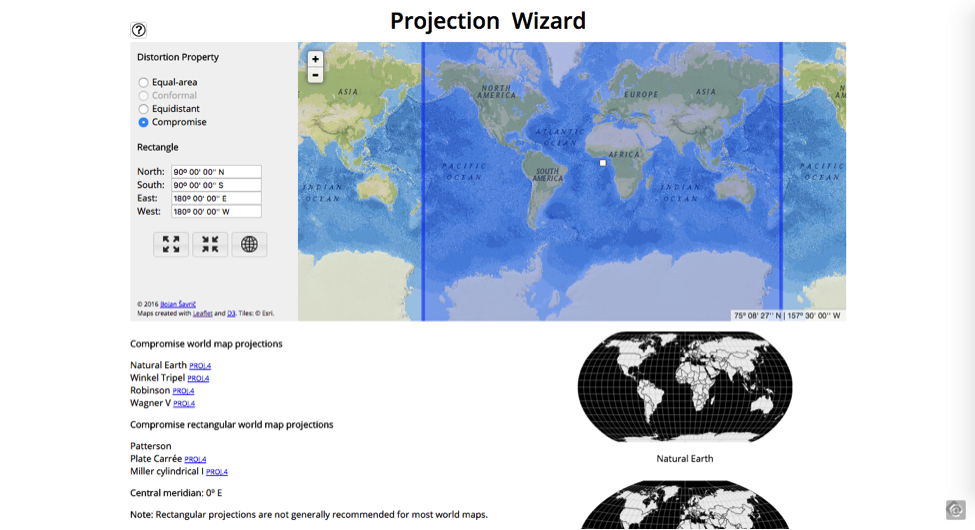
As no two-dimensional projection will perfectly capture a three-dimensional world, it is also necessary to understand how you might play with projections. Projection types vary, and projects like Projection Wizard (see Figure 1), an online GUI for filtering and toggling projections, can help you view a particular projection as it transforms a basemap. Some popular ones include the Albers Equal Area Conic (favored for maps focusing on North America), the Winkel Tripel (favored by National Geographic), and the Waterman Butterfly (a bizarre but interesting cut-up of a globe map).
Mamata Akella, cartographer at CARTO and formerly Esri and the National Parks Service, wrote a great blog post about “freeing your maps from Web Mercator” where she walks through the process of changing projections using SQL, which can be done both in and out of CARTO. That said, CARTO offers a free academy account that provides a monthly allocation of geocoding credits and 150 MB of space, so we’ll run the following example in the CARTO interface and point to some other ways you can play with projections in your own projects.
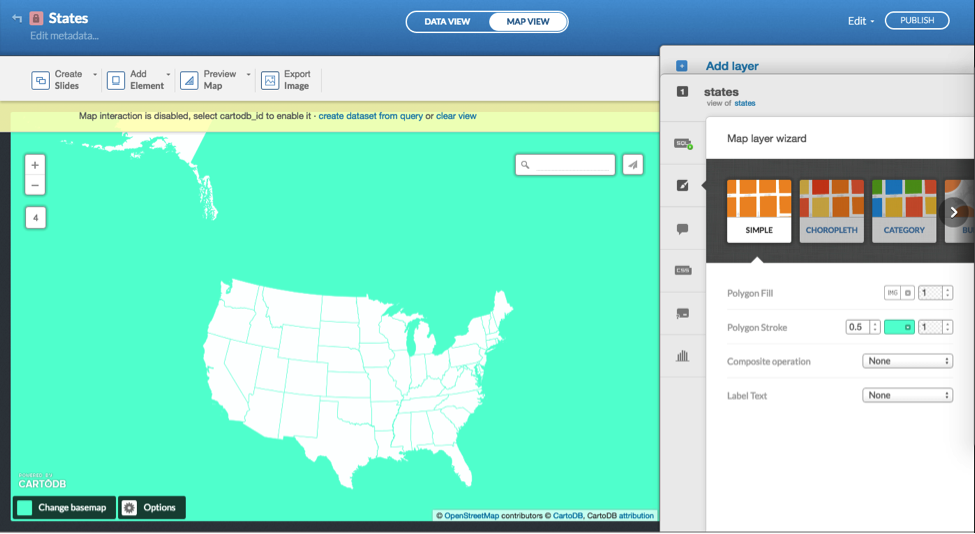
Log in to CARTO and search through the free data library for a data set called “ne_50m_admin_1_states.” Add it to your account, or otherwise upload your own data set of the 50 states (see Figure 2). We’ll show this example because you might want to change the projection of all 50 states or just a few, and there are ways of doing this in SQL.
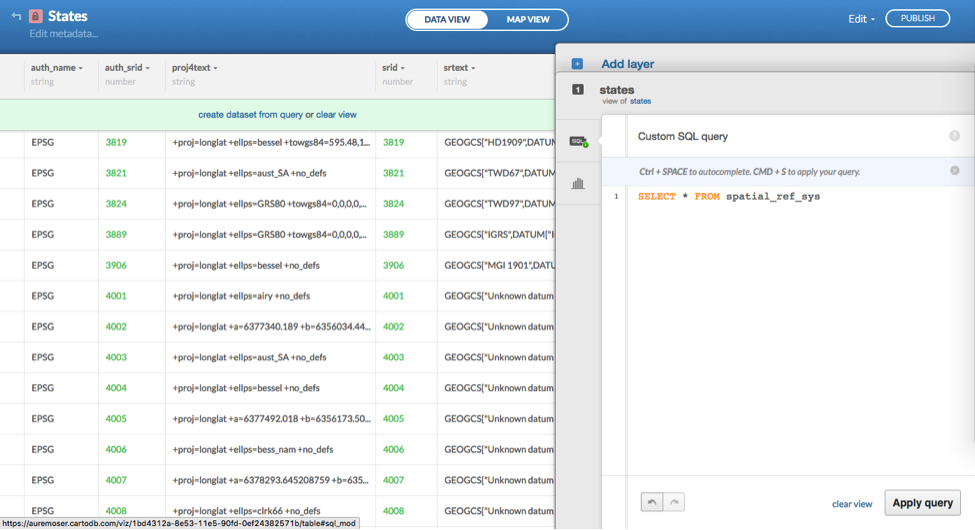
You can look up the spatial reference codes available to you by searching the CARTO Spatial Reference System Identifier (SRID) table, which allows you to view all the unique identifiers for coordinate systems with a little SQL:
SELECT * FROM spatial_ref_sys
This will print you a reference table with all the SRID codes you can use to reset the projection on one of your feature layers using PostGIS functions (see Figure 3).
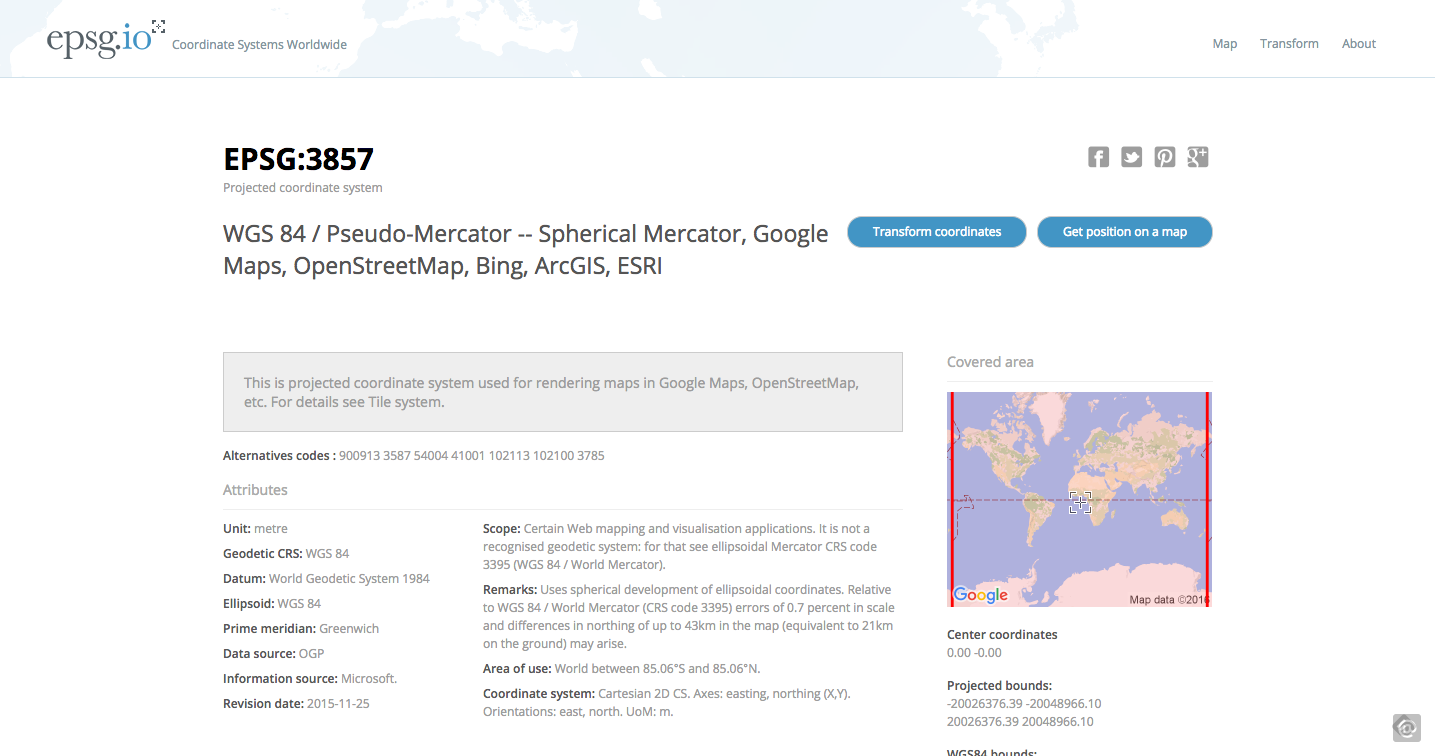
If you don’t see a particular projection listed here but would like to allow for it in your map, you can search EPSG.io for the correct projection (see Figure 4). In this case we’ve searched for the Albers Equal Area Conic projection that is appropriate for North American maps.
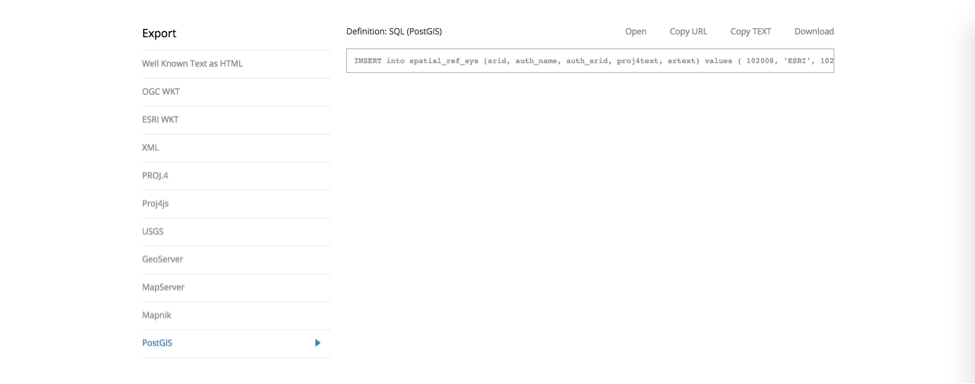
This will generate some copy/paste codes you can use to enable certain projections in a variety of tile server or rendering engine formats you might be using for map development (see Figure 5).
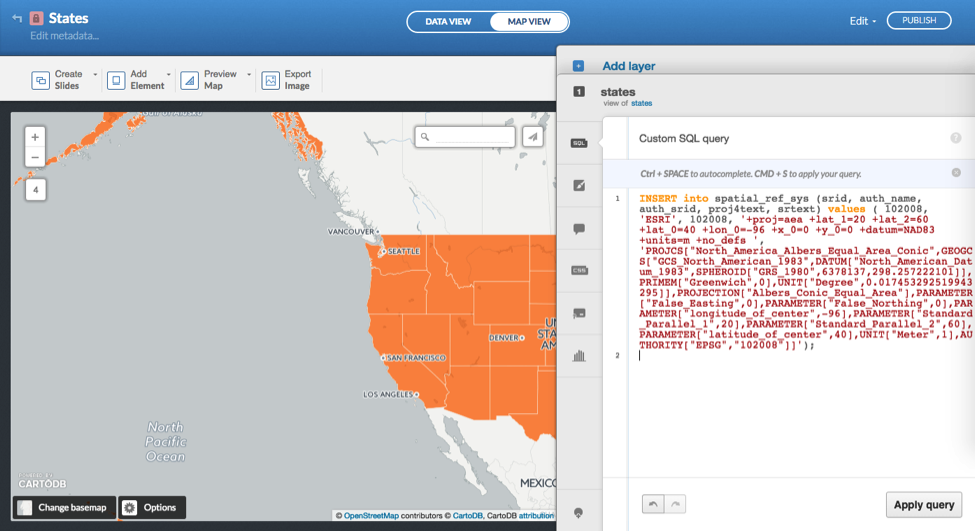
You can paste the PostGIS code into the CARTO SQL tray and apply the query to import this SRID and enable this projection for your feature layers (see Figure 6).
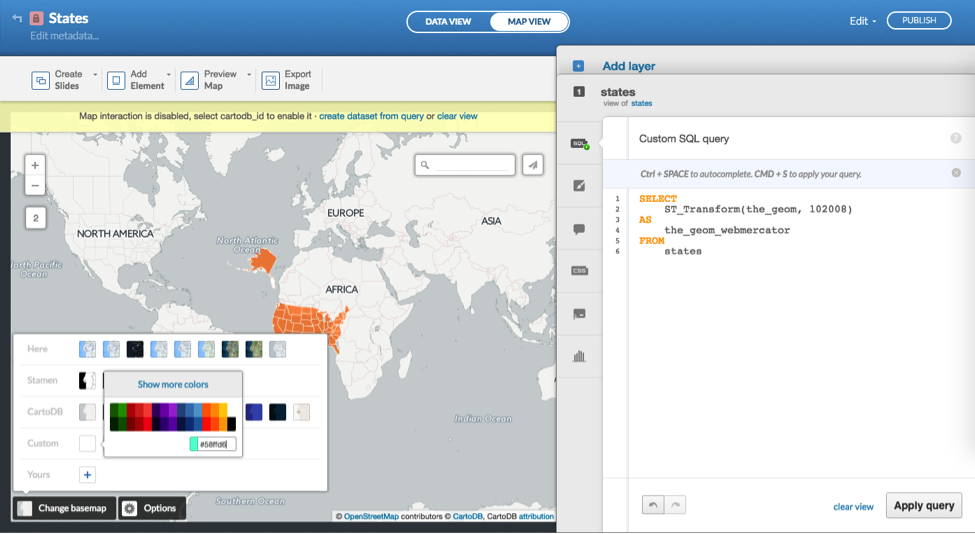
You can then apply a subsequent, and “simpler,” query using PostGIS syntax to reset the projection of your states layer:
SELECT ST_Transform(the_geom, 102008) AS the_geom_webmercator FROM states
In this case, entering 102008 (the Albers Equal Area Conic) as the_geom_webmercator will ensure that the mapped data, by default in a Web Mercator projection, will be recast as an Albers projection. You would swap out states (the name of my data table in this example) for whatever your table name is.
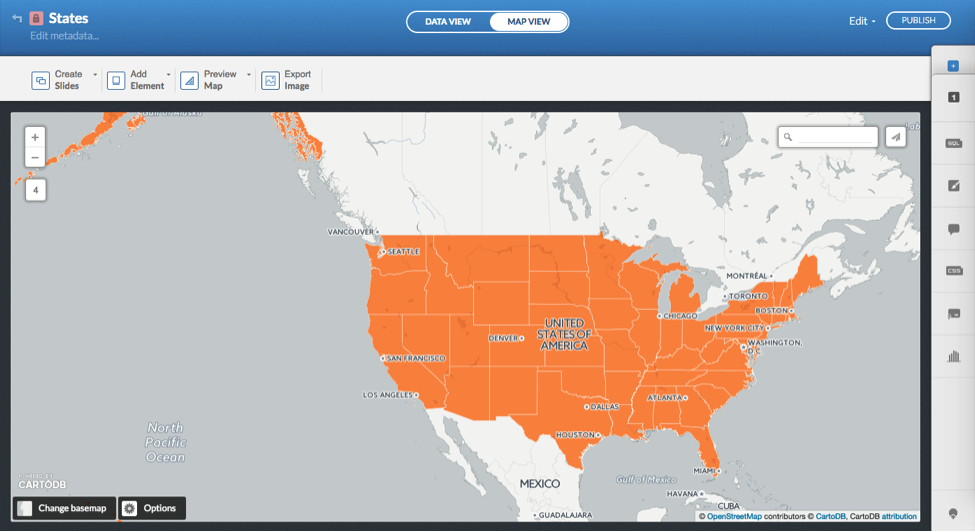
The resulting transformation moves the United States to the center of the map canvas, at odds with the basemap in Figure 7, which has retained the default projection. You can solve for this incongruence by changing your basemap, or using a color instead of a basemap with labels. As there is no alternative basemap option for a projection other than Web Mercator, the approach in Figure 7 forces a different projection into a Web Mercator coordinate plane.
Thereafter you can style the states as white in CARTO’s wizard or in the accompanying CartoCSS for your map (Figure 8).
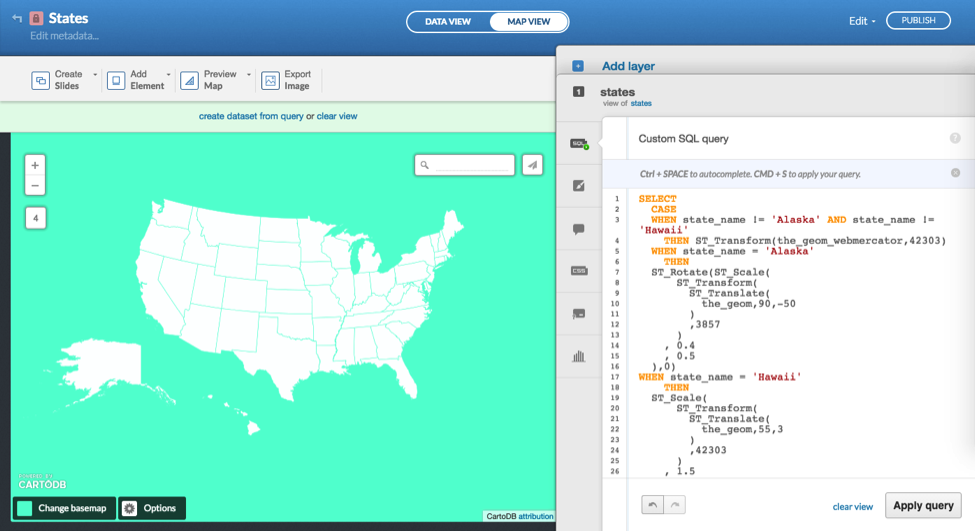
You can even take this further and use PostGIS to set the projection for individual states, by selecting unique IDs for the states and transforming the geometries of only those polygons. The SQL can get pretty squirrelly and is often contested and rewritten by map practitioners, but the SQL query by Andy Eschbacher echoed in the implementation in Figure 9 produces a fairly agreeable transform of Alaska and Hawaii into a compact Cartesian plane.