
 (source: Metropolitan Museum of Art)
 Executive Summary
THE 2016 DESIGN SALARY SURVEY investigates the tools, tasks, and compensation of designers, UX specialists, and others in the design space based on data collected in an online, anonymous survey. The 324 respondents largely worked in the design of web/mobile products or connected devices, and came from a wide variety of industries and backgrounds. We paid special attention to the software designers use—respondents were asked which of more than 100 tools they use—and usage correlations between them.
Key findings include:
- UX designers earn a median salary of $91K ($99K for US-based respondents)
- California respondents report the highest wages
- Age doesn’t predict salary, years of experience do
- Women are paid less than men—even when all other variables match
- Most UX designers tend to use one of two software stacks: one anchored by Adobe Illustrator, the other anchored by Sketch
- Those who code (even just a little) earn more
- When respondents provide tool and task information, job title becomes less useful for predicting salaries
In a rather manual, low-tech way, this report is interactive: just plug your own data into the linear regression model to get a salary prediction (no buttons, just do the math). You can press actual buttons, and earn our sincere gratitude, by taking the survey—it only takes about 5 to 10 minutes and is crucial for us to continue providing this kind of research: oreilly.com/design/2017-design-salary-survey.
Introduction
IN THE FALL OF 2015, O’Reilly Media made a comprehensive online survey available, focused on designers, their work, and compensation. The 324 designers, UX specialists, engineers, managers, and directors who took the survey came from 25 countries and 34 US states. We calculated the median salary of the survey respondents as $91,000 USD, a figure we decompose using information from other survey questions covering demographics, tool usage, and participation in several design-related tasks. While we can compare the salaries of groups of respondents based on how they answered particular questions—for example, those who use a particular tool and those who do not—a more rigorous way of assessing salary differences is through a linear model, which allows us to see how salary corresponds to a variable holding all others constant. In this report, we present both methods. The reader should keep in mind that any associations or correlations presented may not be causative, and that the self-selecting nature of the survey respondents means there is no guarantee the sample is representative of professionals in the design space. That said, we have taken care to be cautious in our conclusions to only present results that are statistically significant under usual assumptions that the sample is sufficiently close to random. Even those designers who know the space well will likely find something here that is new.
Note
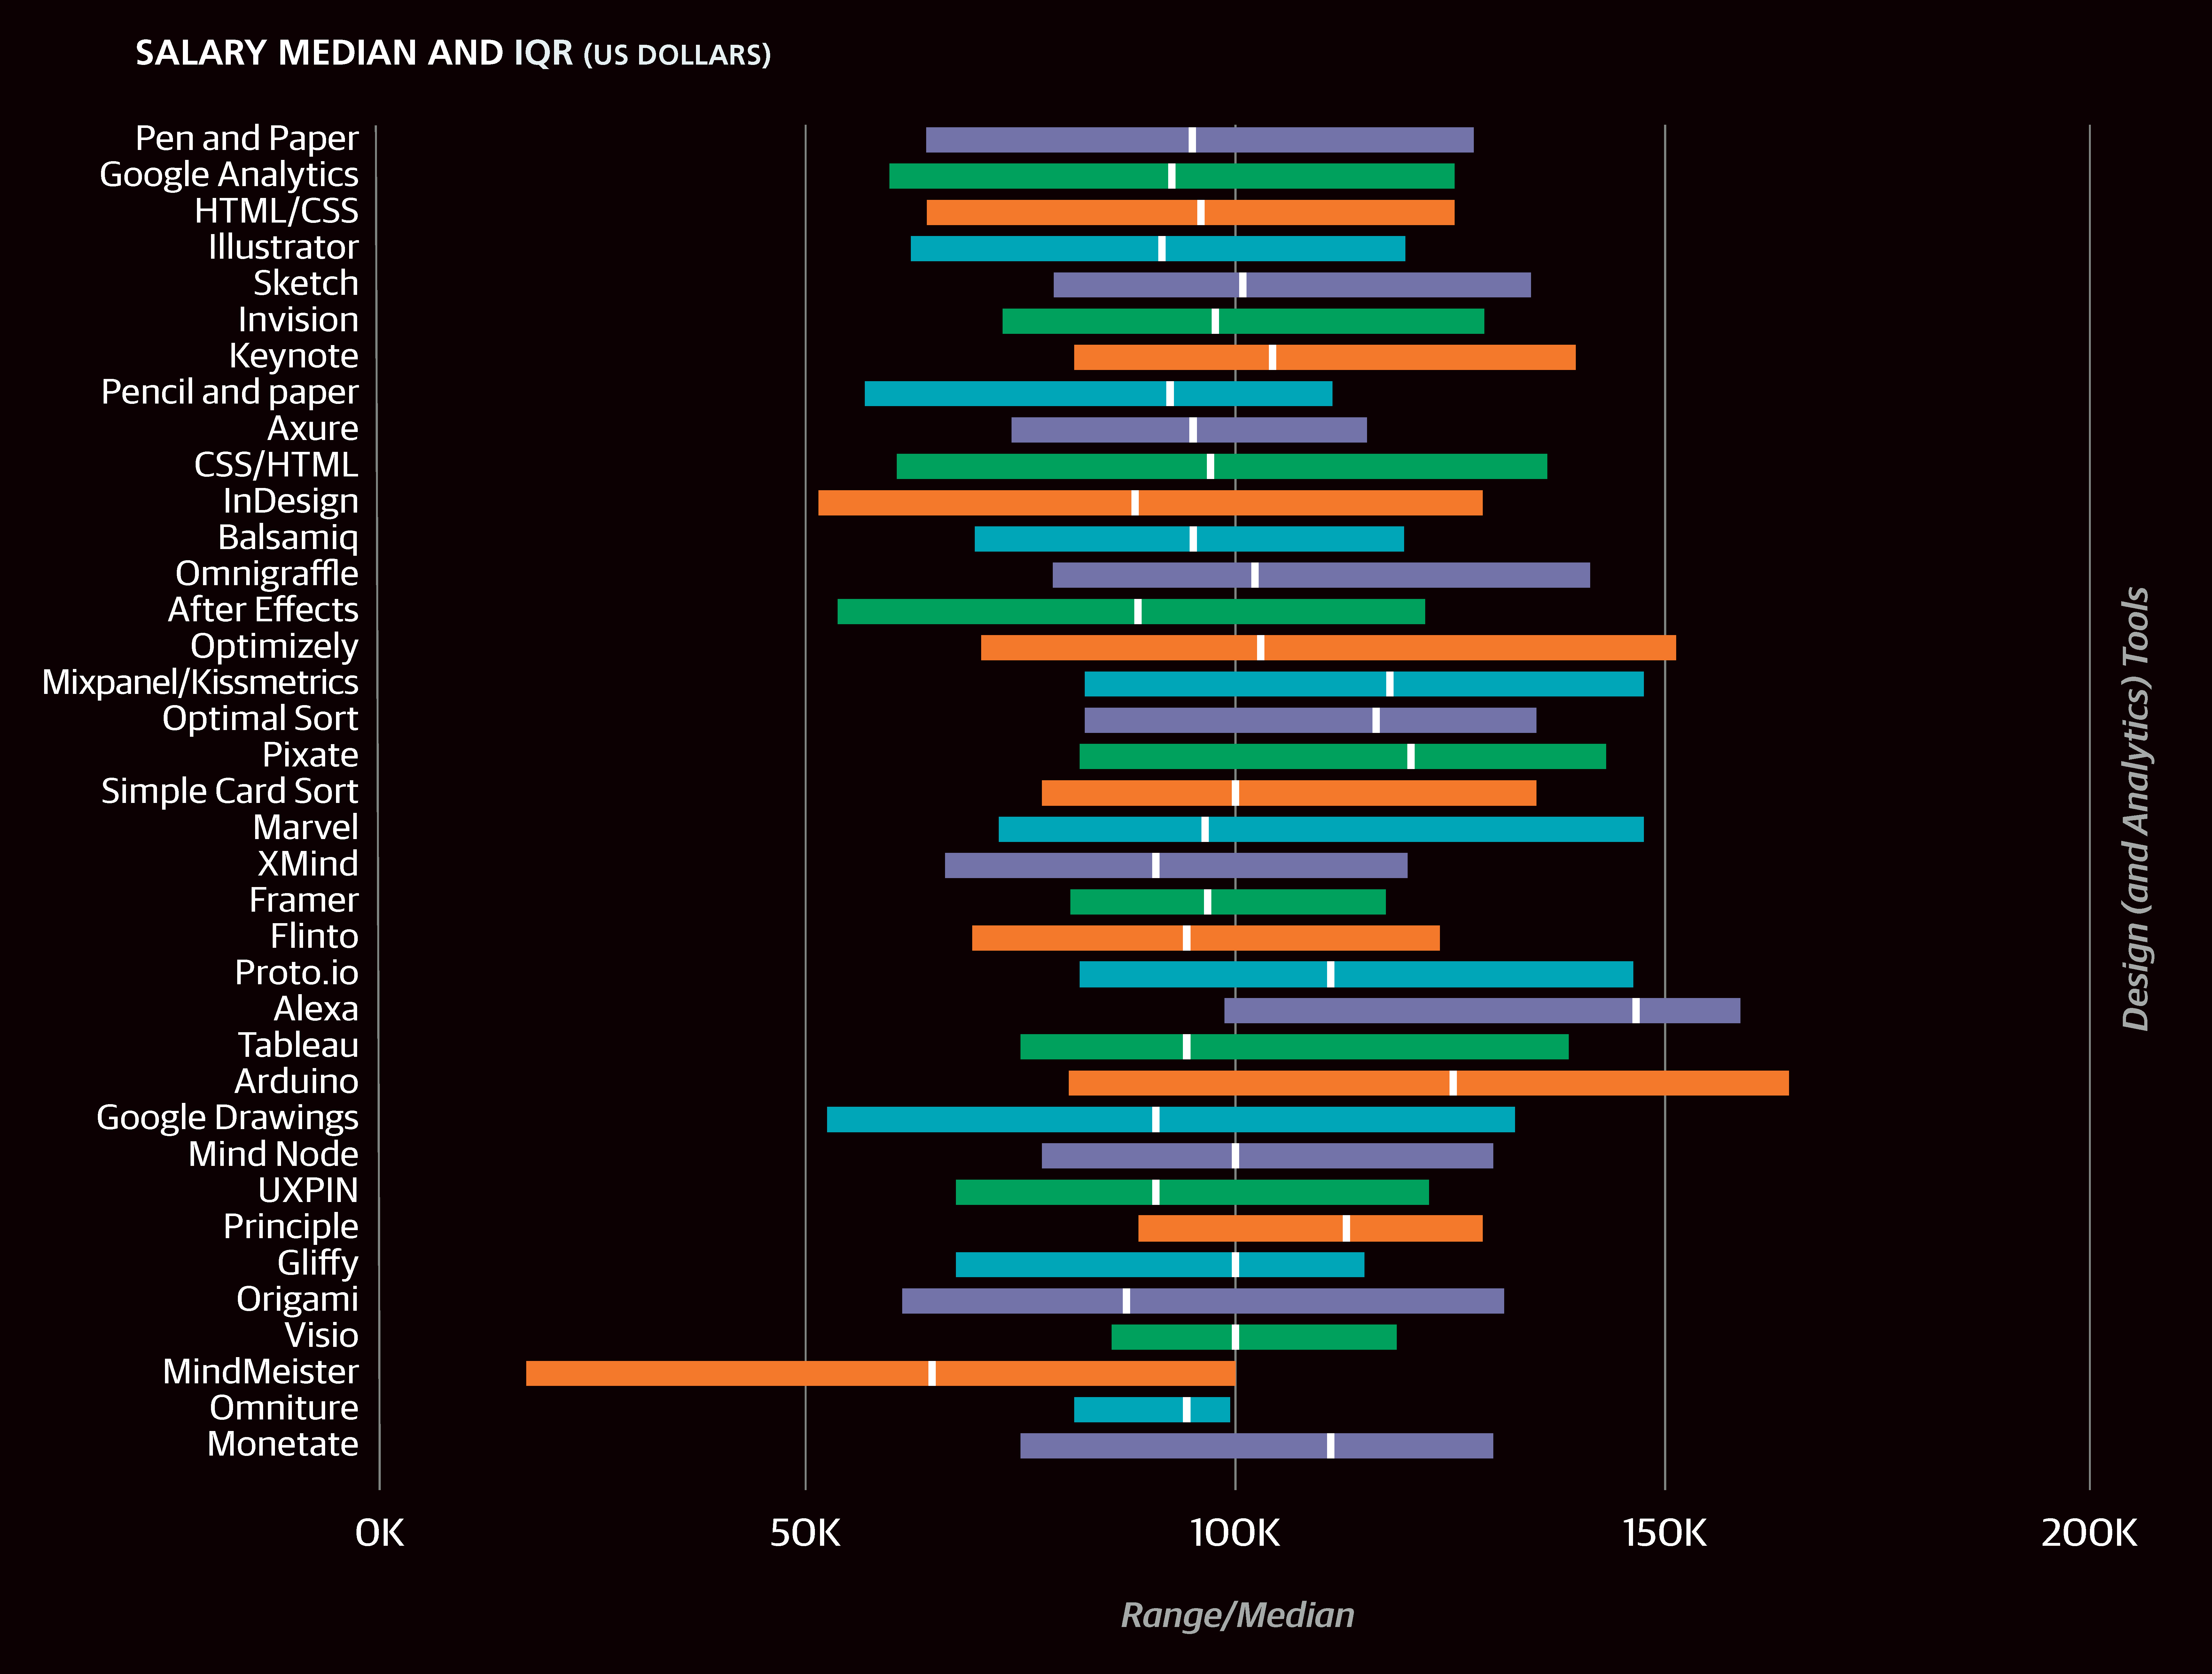
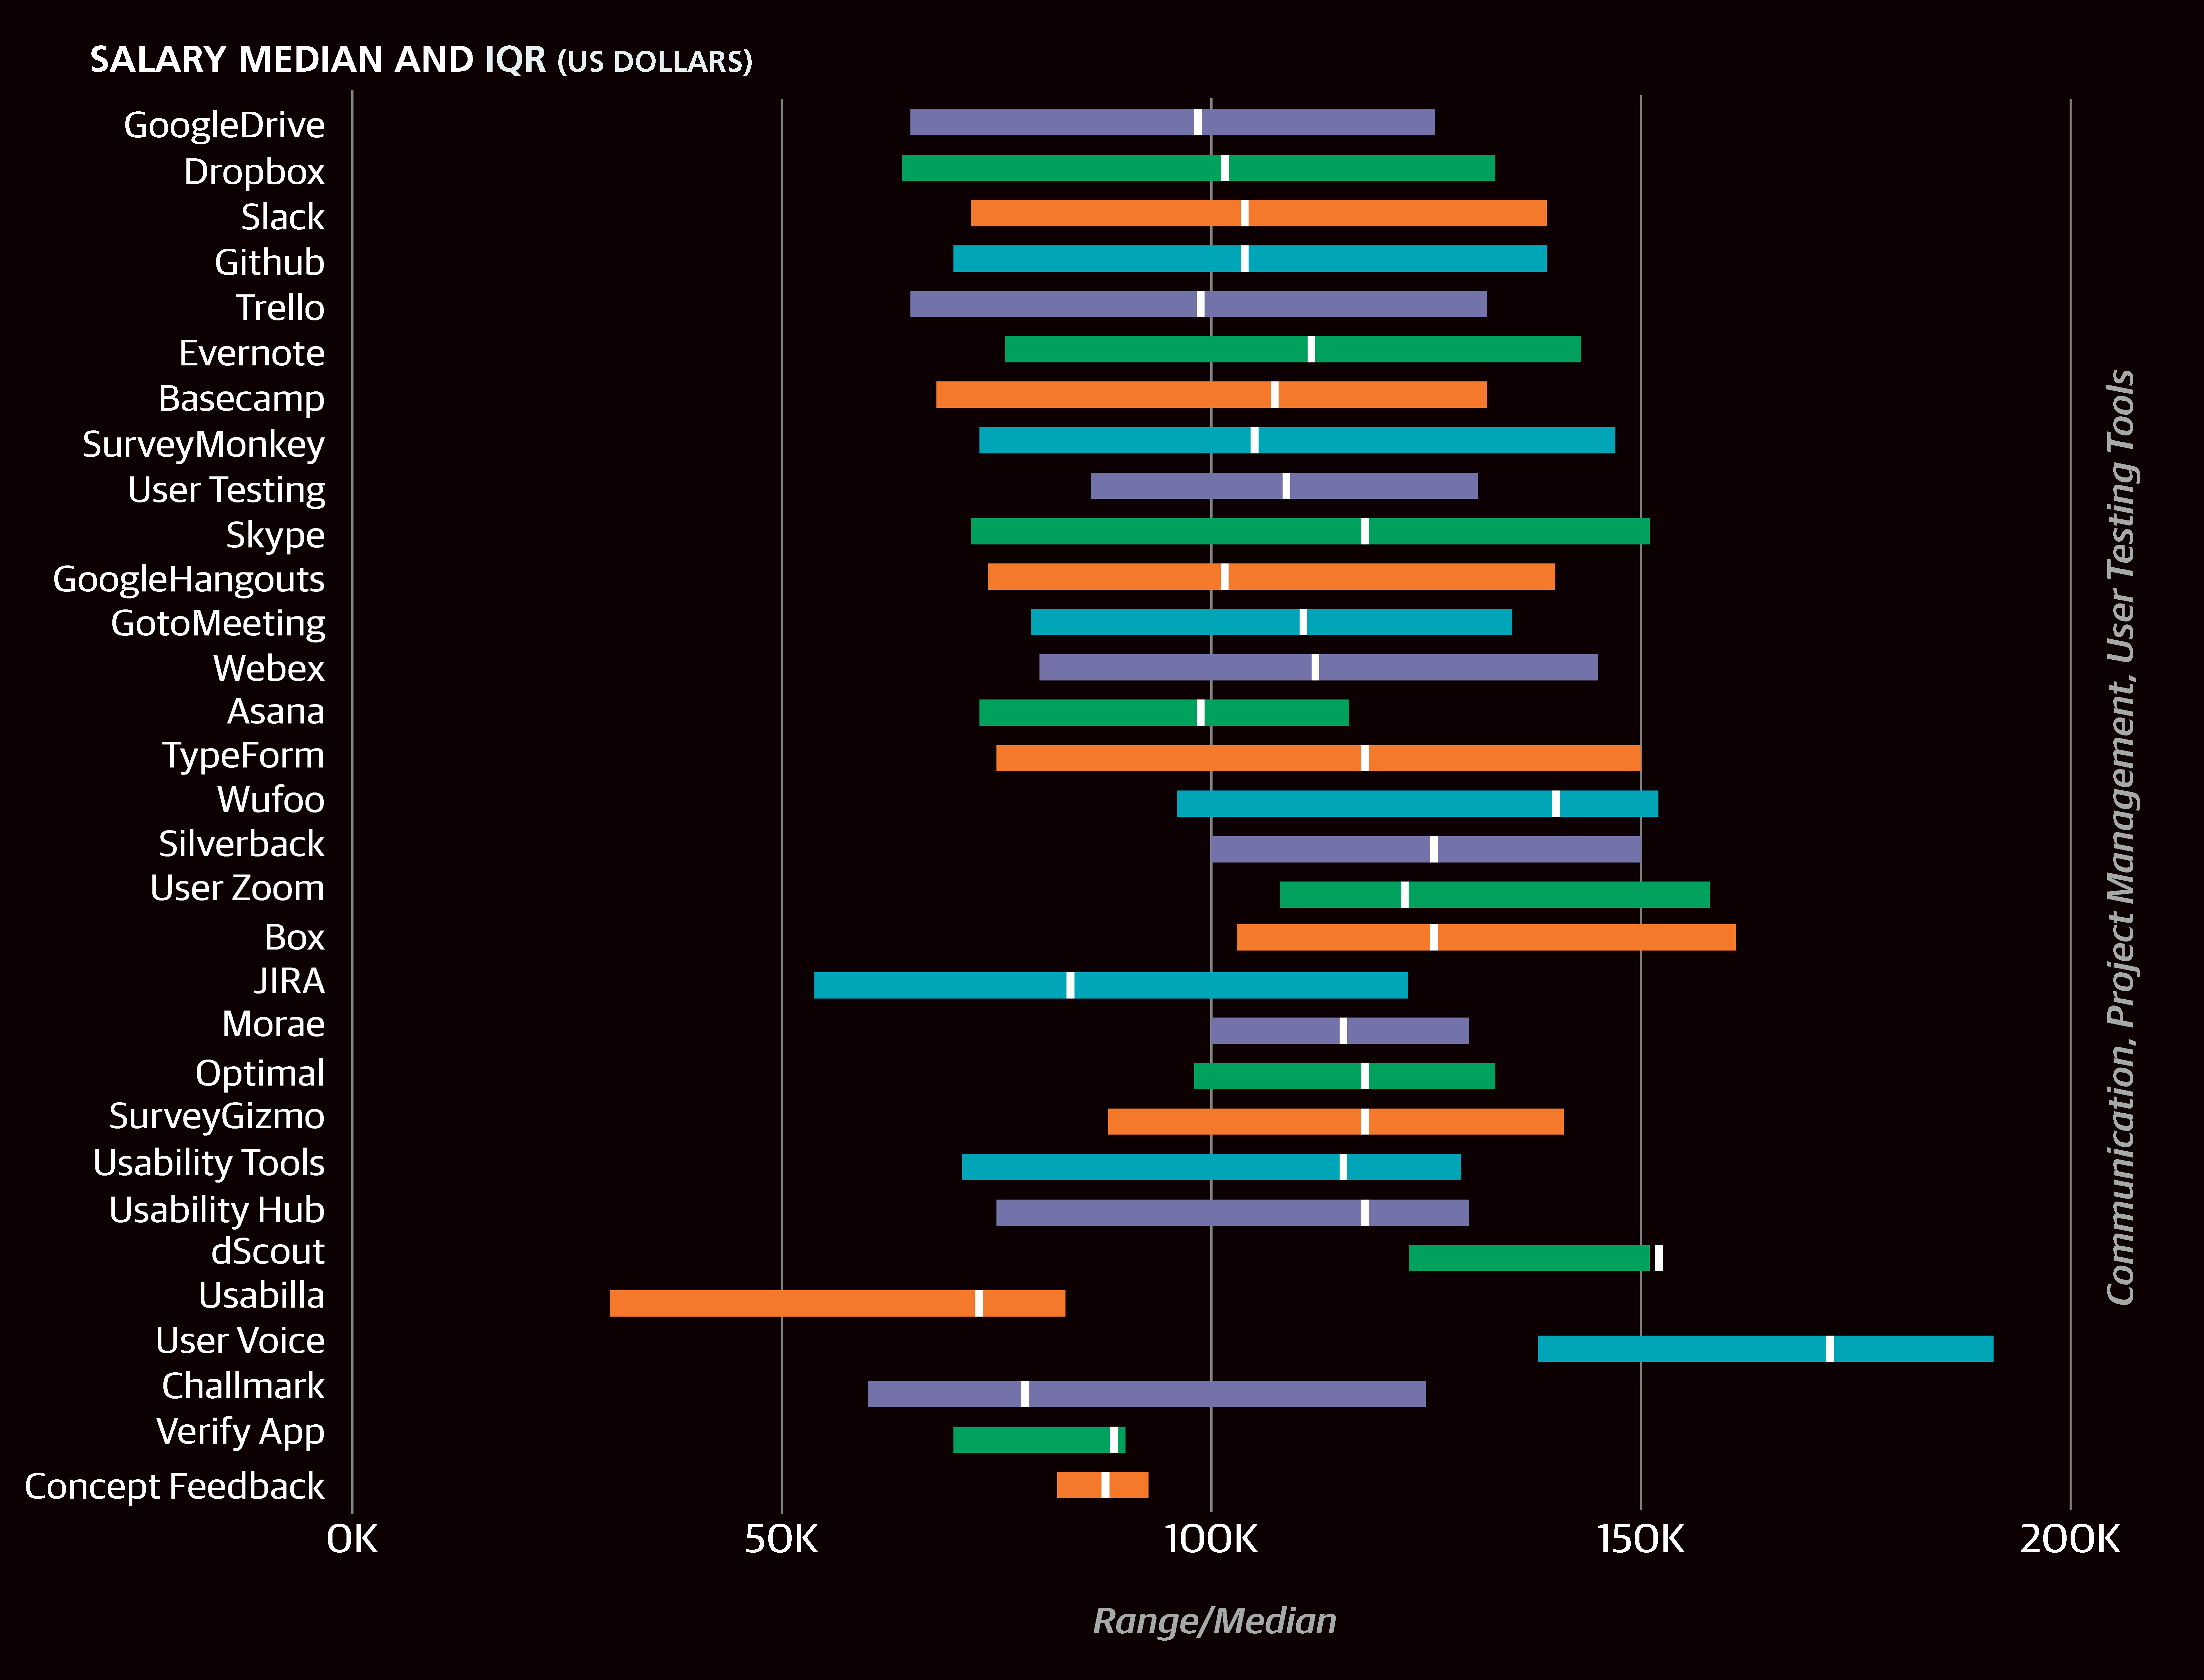
In the horizontal bar charts throughout this report, we include the interquartile range (IQR) to show the middle 50% of respondents’ answers to questions such as salary. One quarter of the respondents has a salary below the displayed range, and one quarter has a salary above the displayed range.

Individual Background Demographics
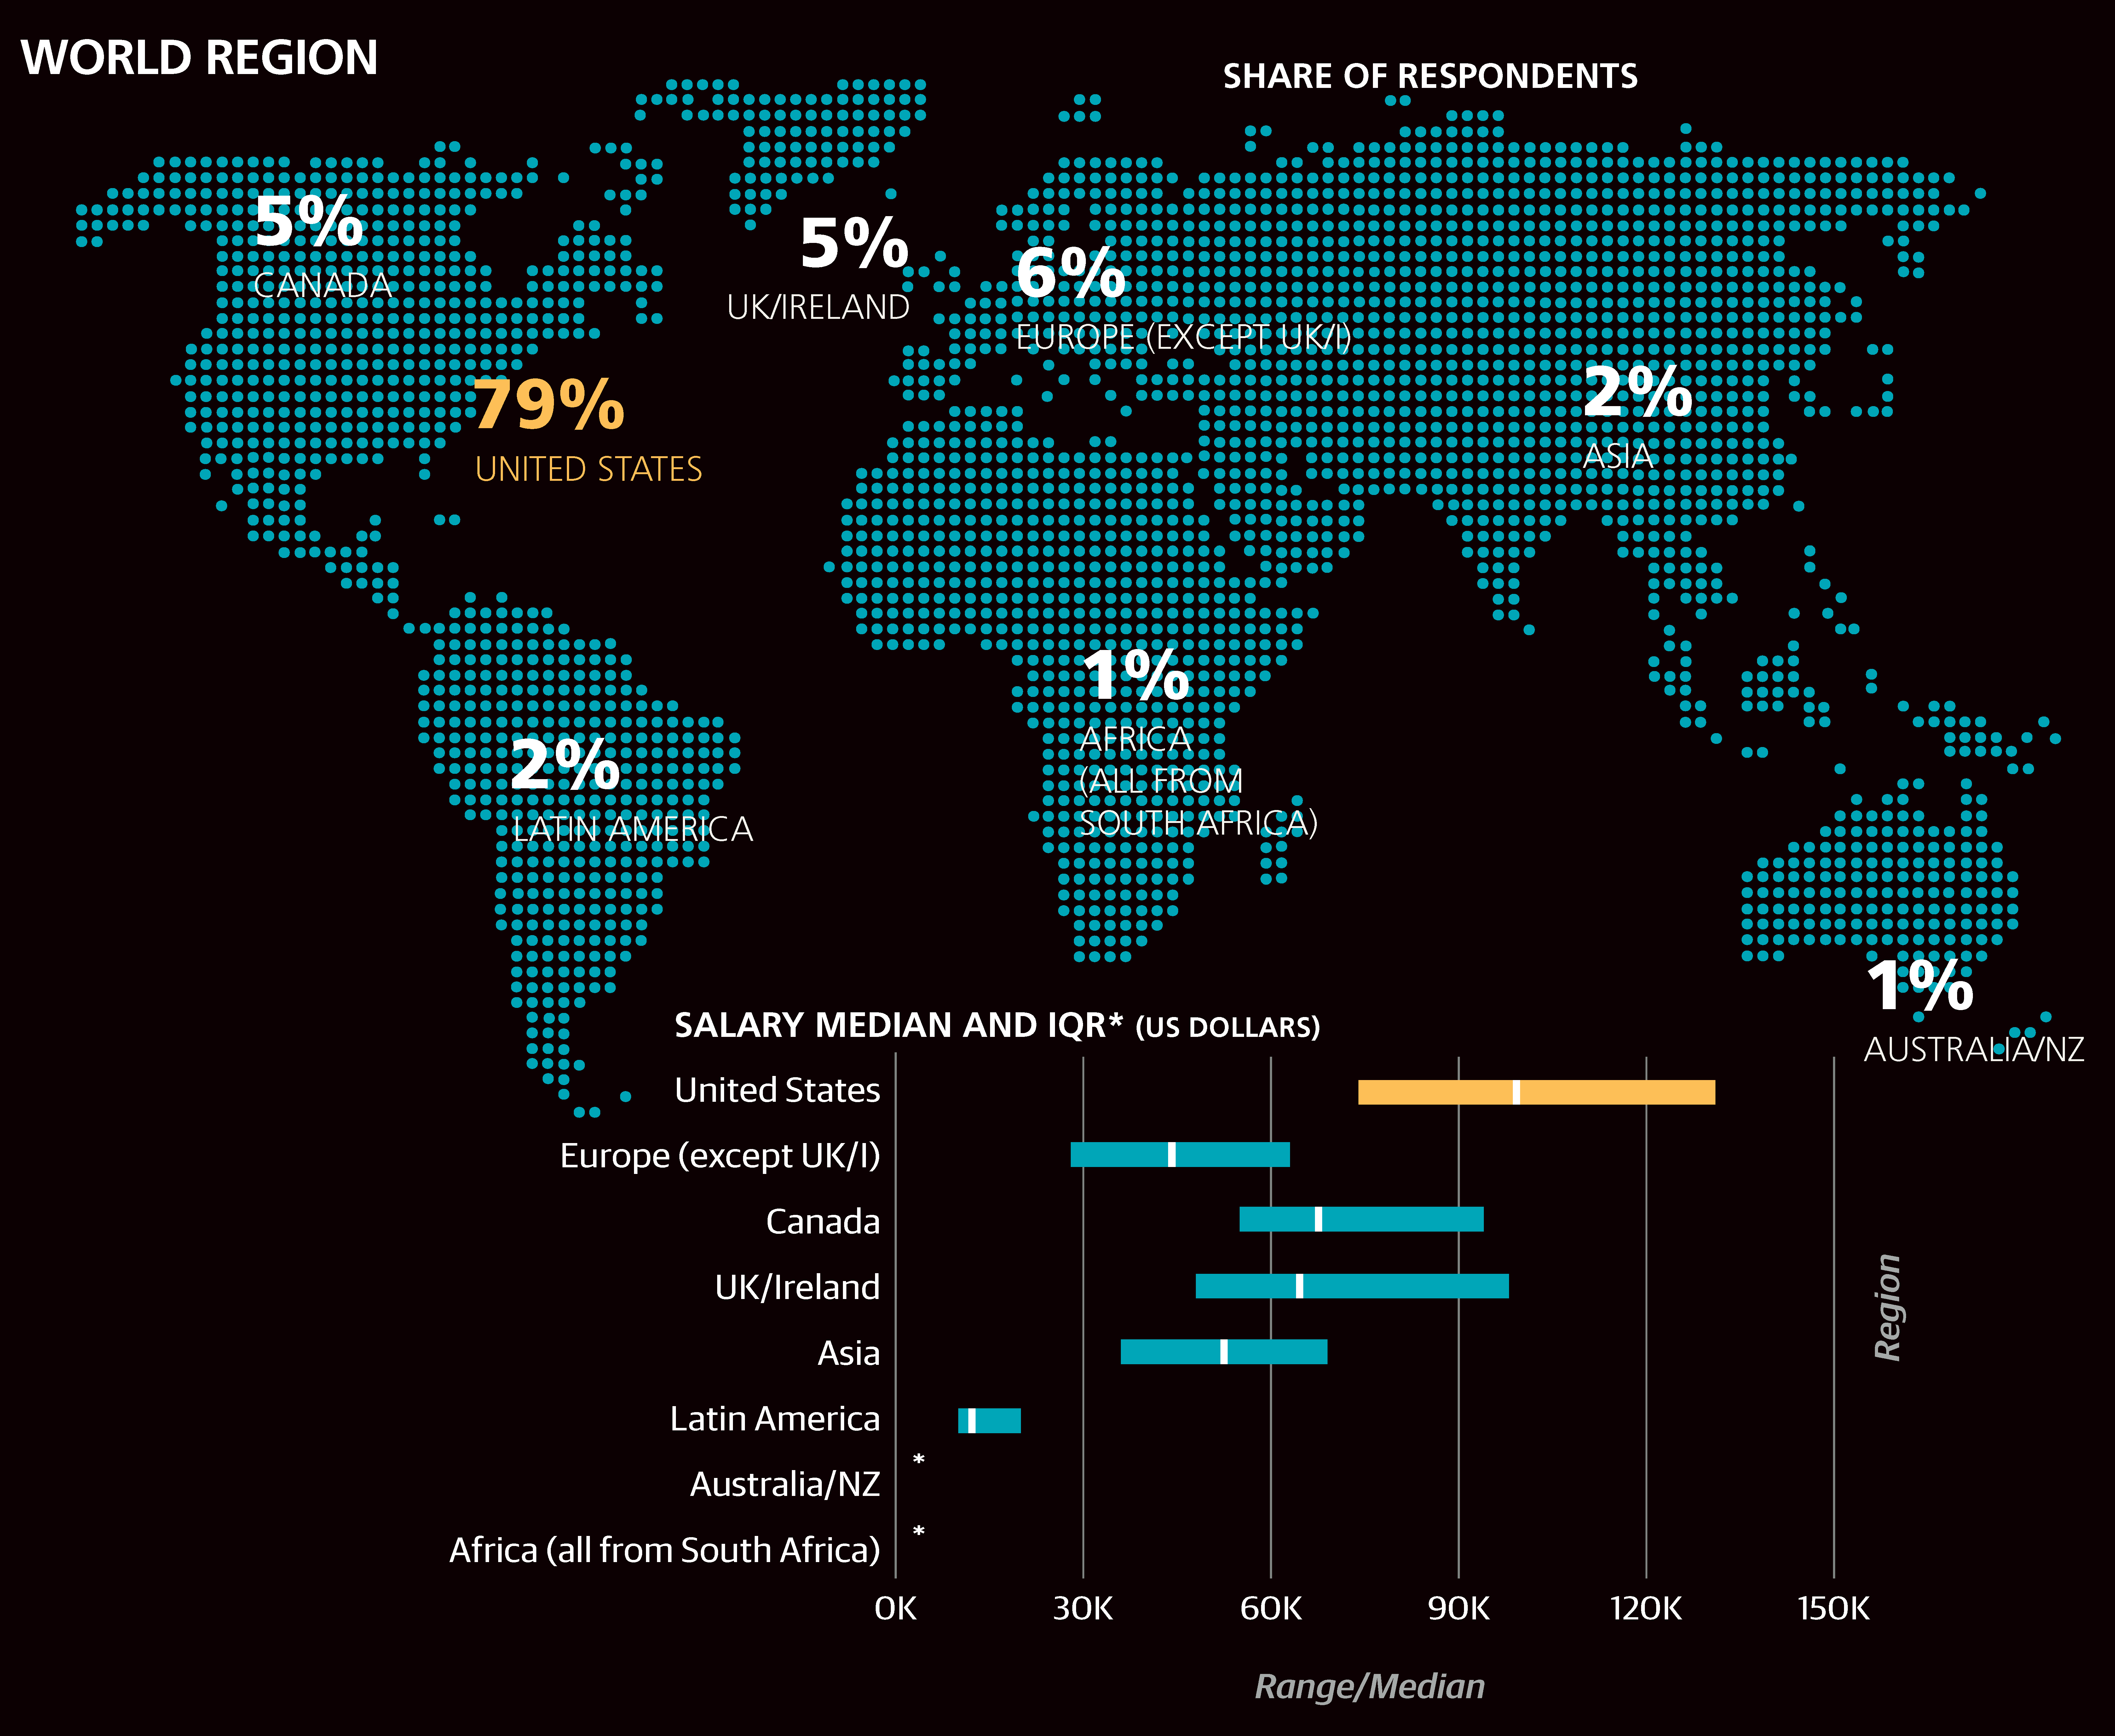
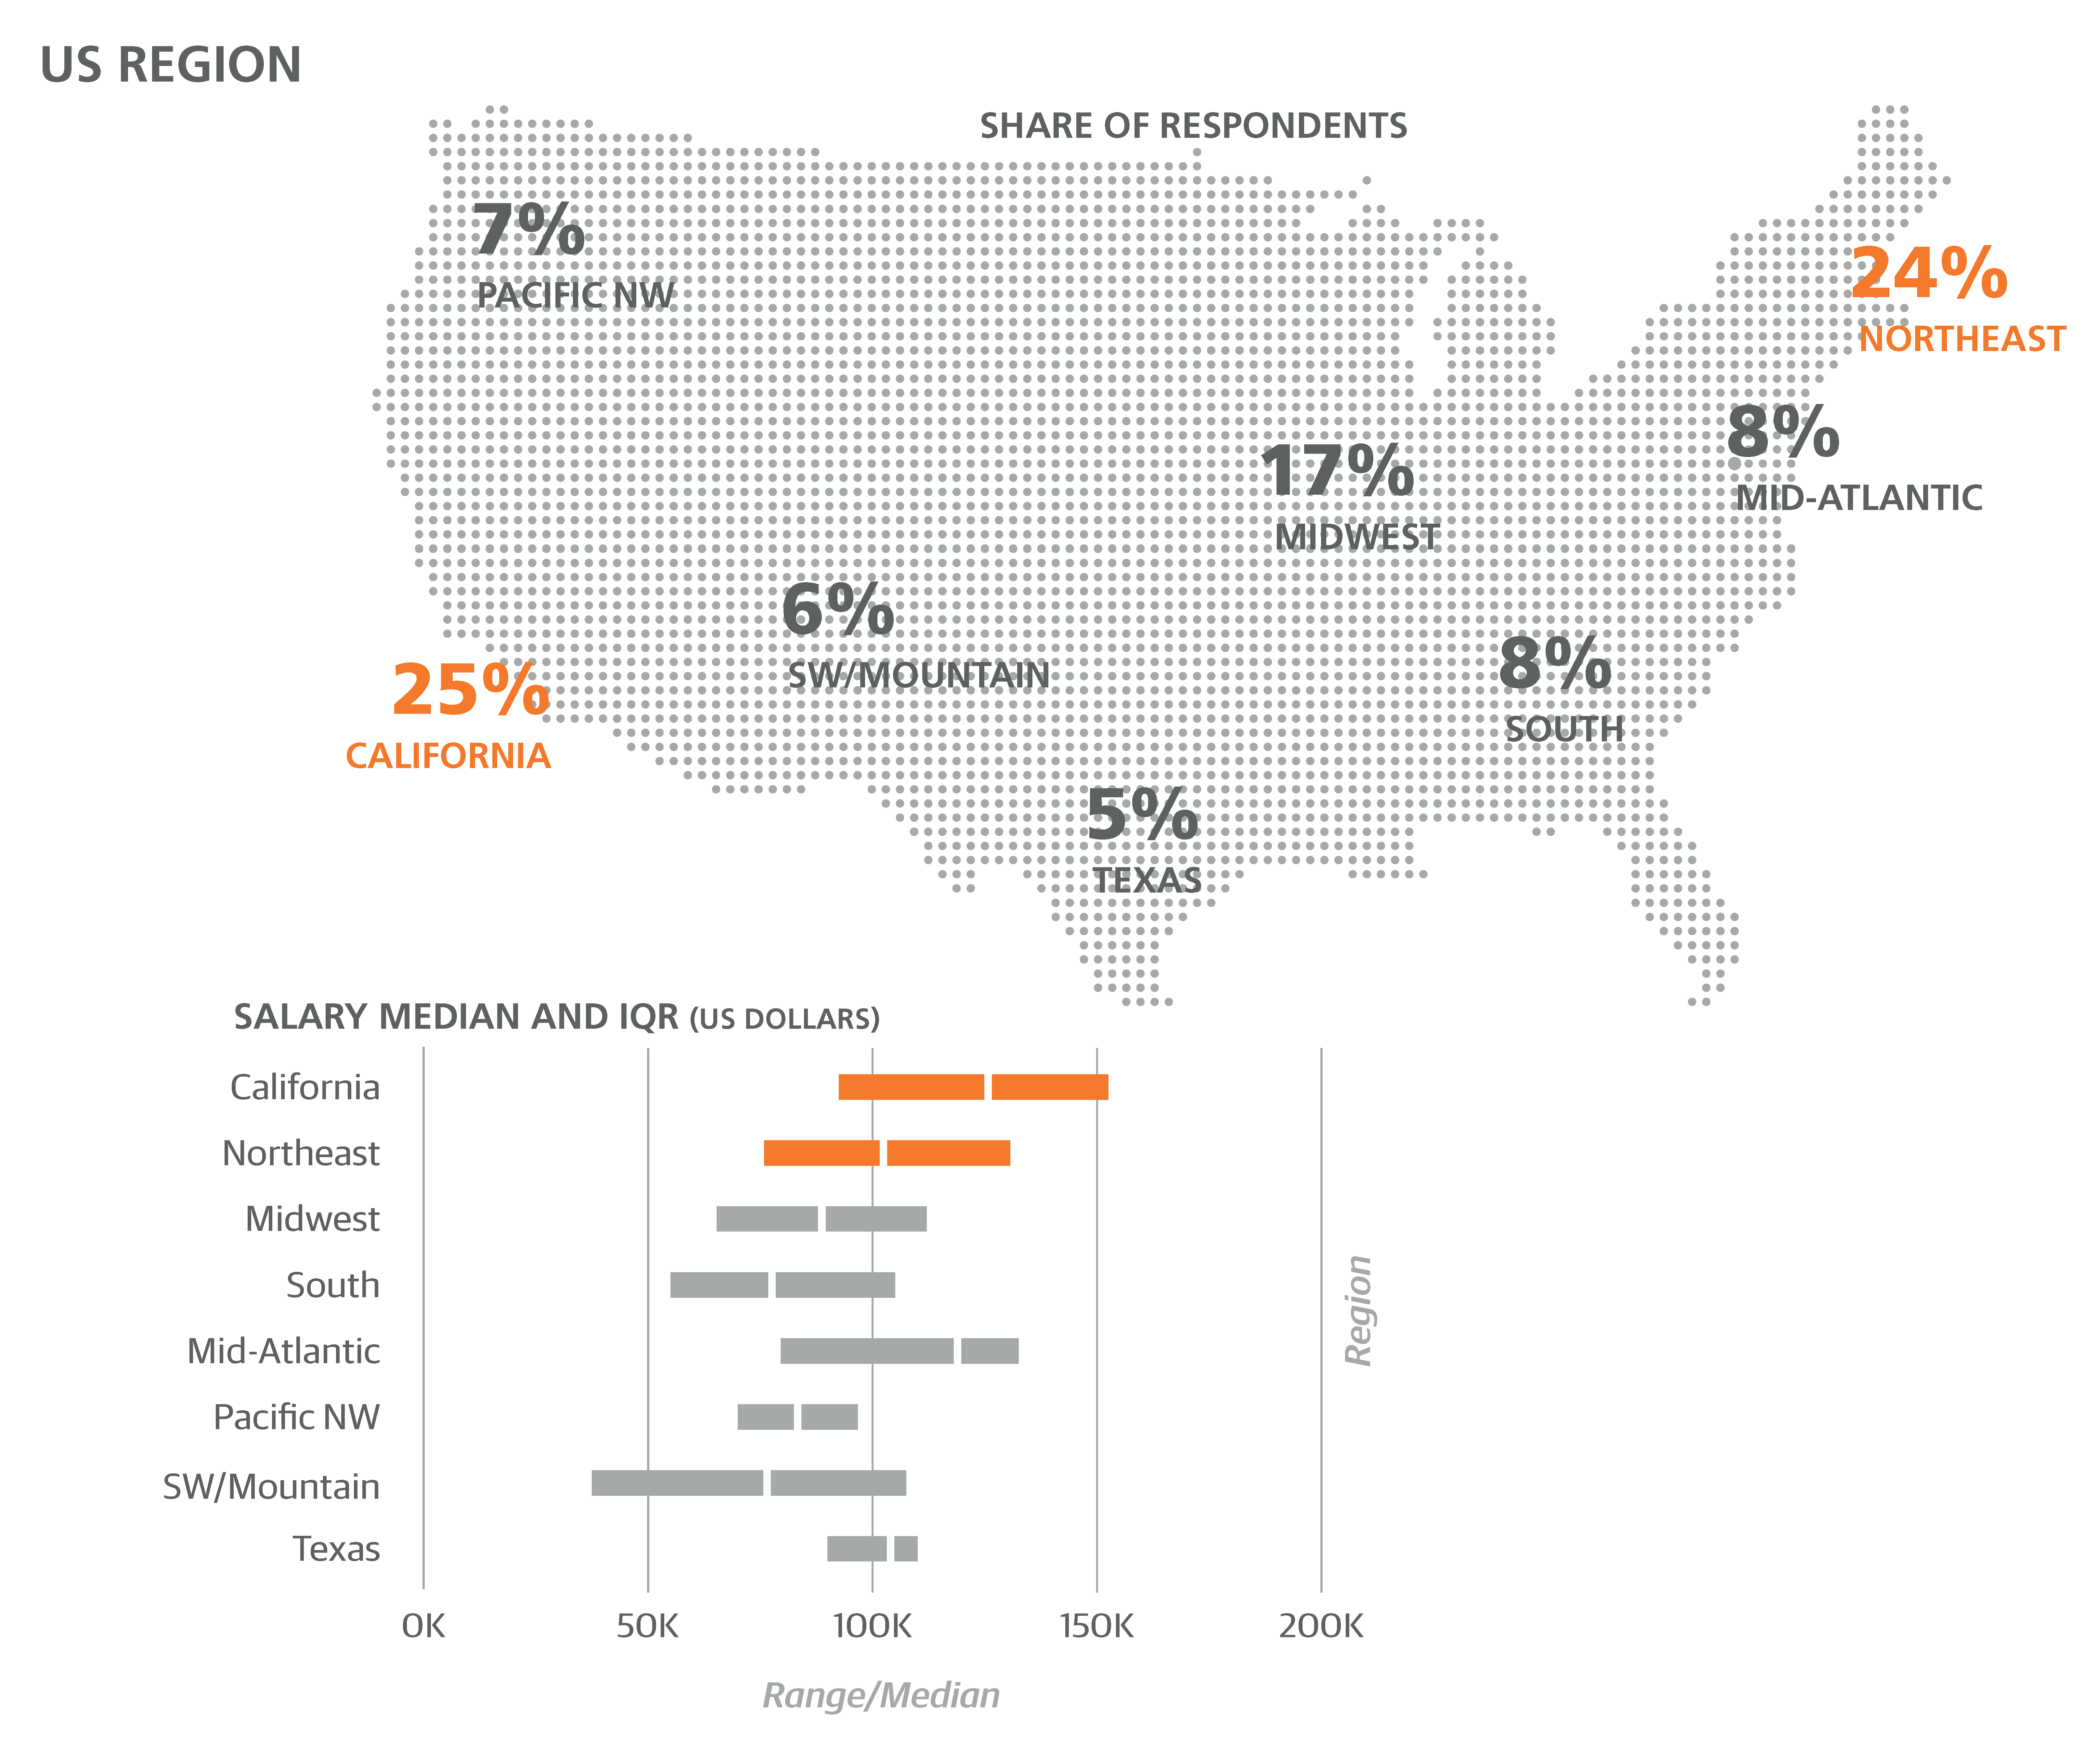
THE FIRST THING TO DO WITH SURVEY DATA is to get to know the sample. Most respondents (79%) work in the US with most of the rest working in Europe (11%) and Canada (5%). Half of the US respondents came from California and the Northeast (by way of comparison, these two regions make up about a quarter of the US population). We note two possible causes for bias towards California and the Northeast: people living in those regions disproportionately respond to O’Reilly surveys and those regions may have more design jobs. The discrepancy between the median salaries of US ($99K) and European respondents ($48K) is greater than what would be expected given national per capita income, but this is partially explained by more US respondents holding higher positions—a quirk of the sample. The US region with the highest salary was California (with median salary of $128K), followed by the Mid-Atlantic ($118K).
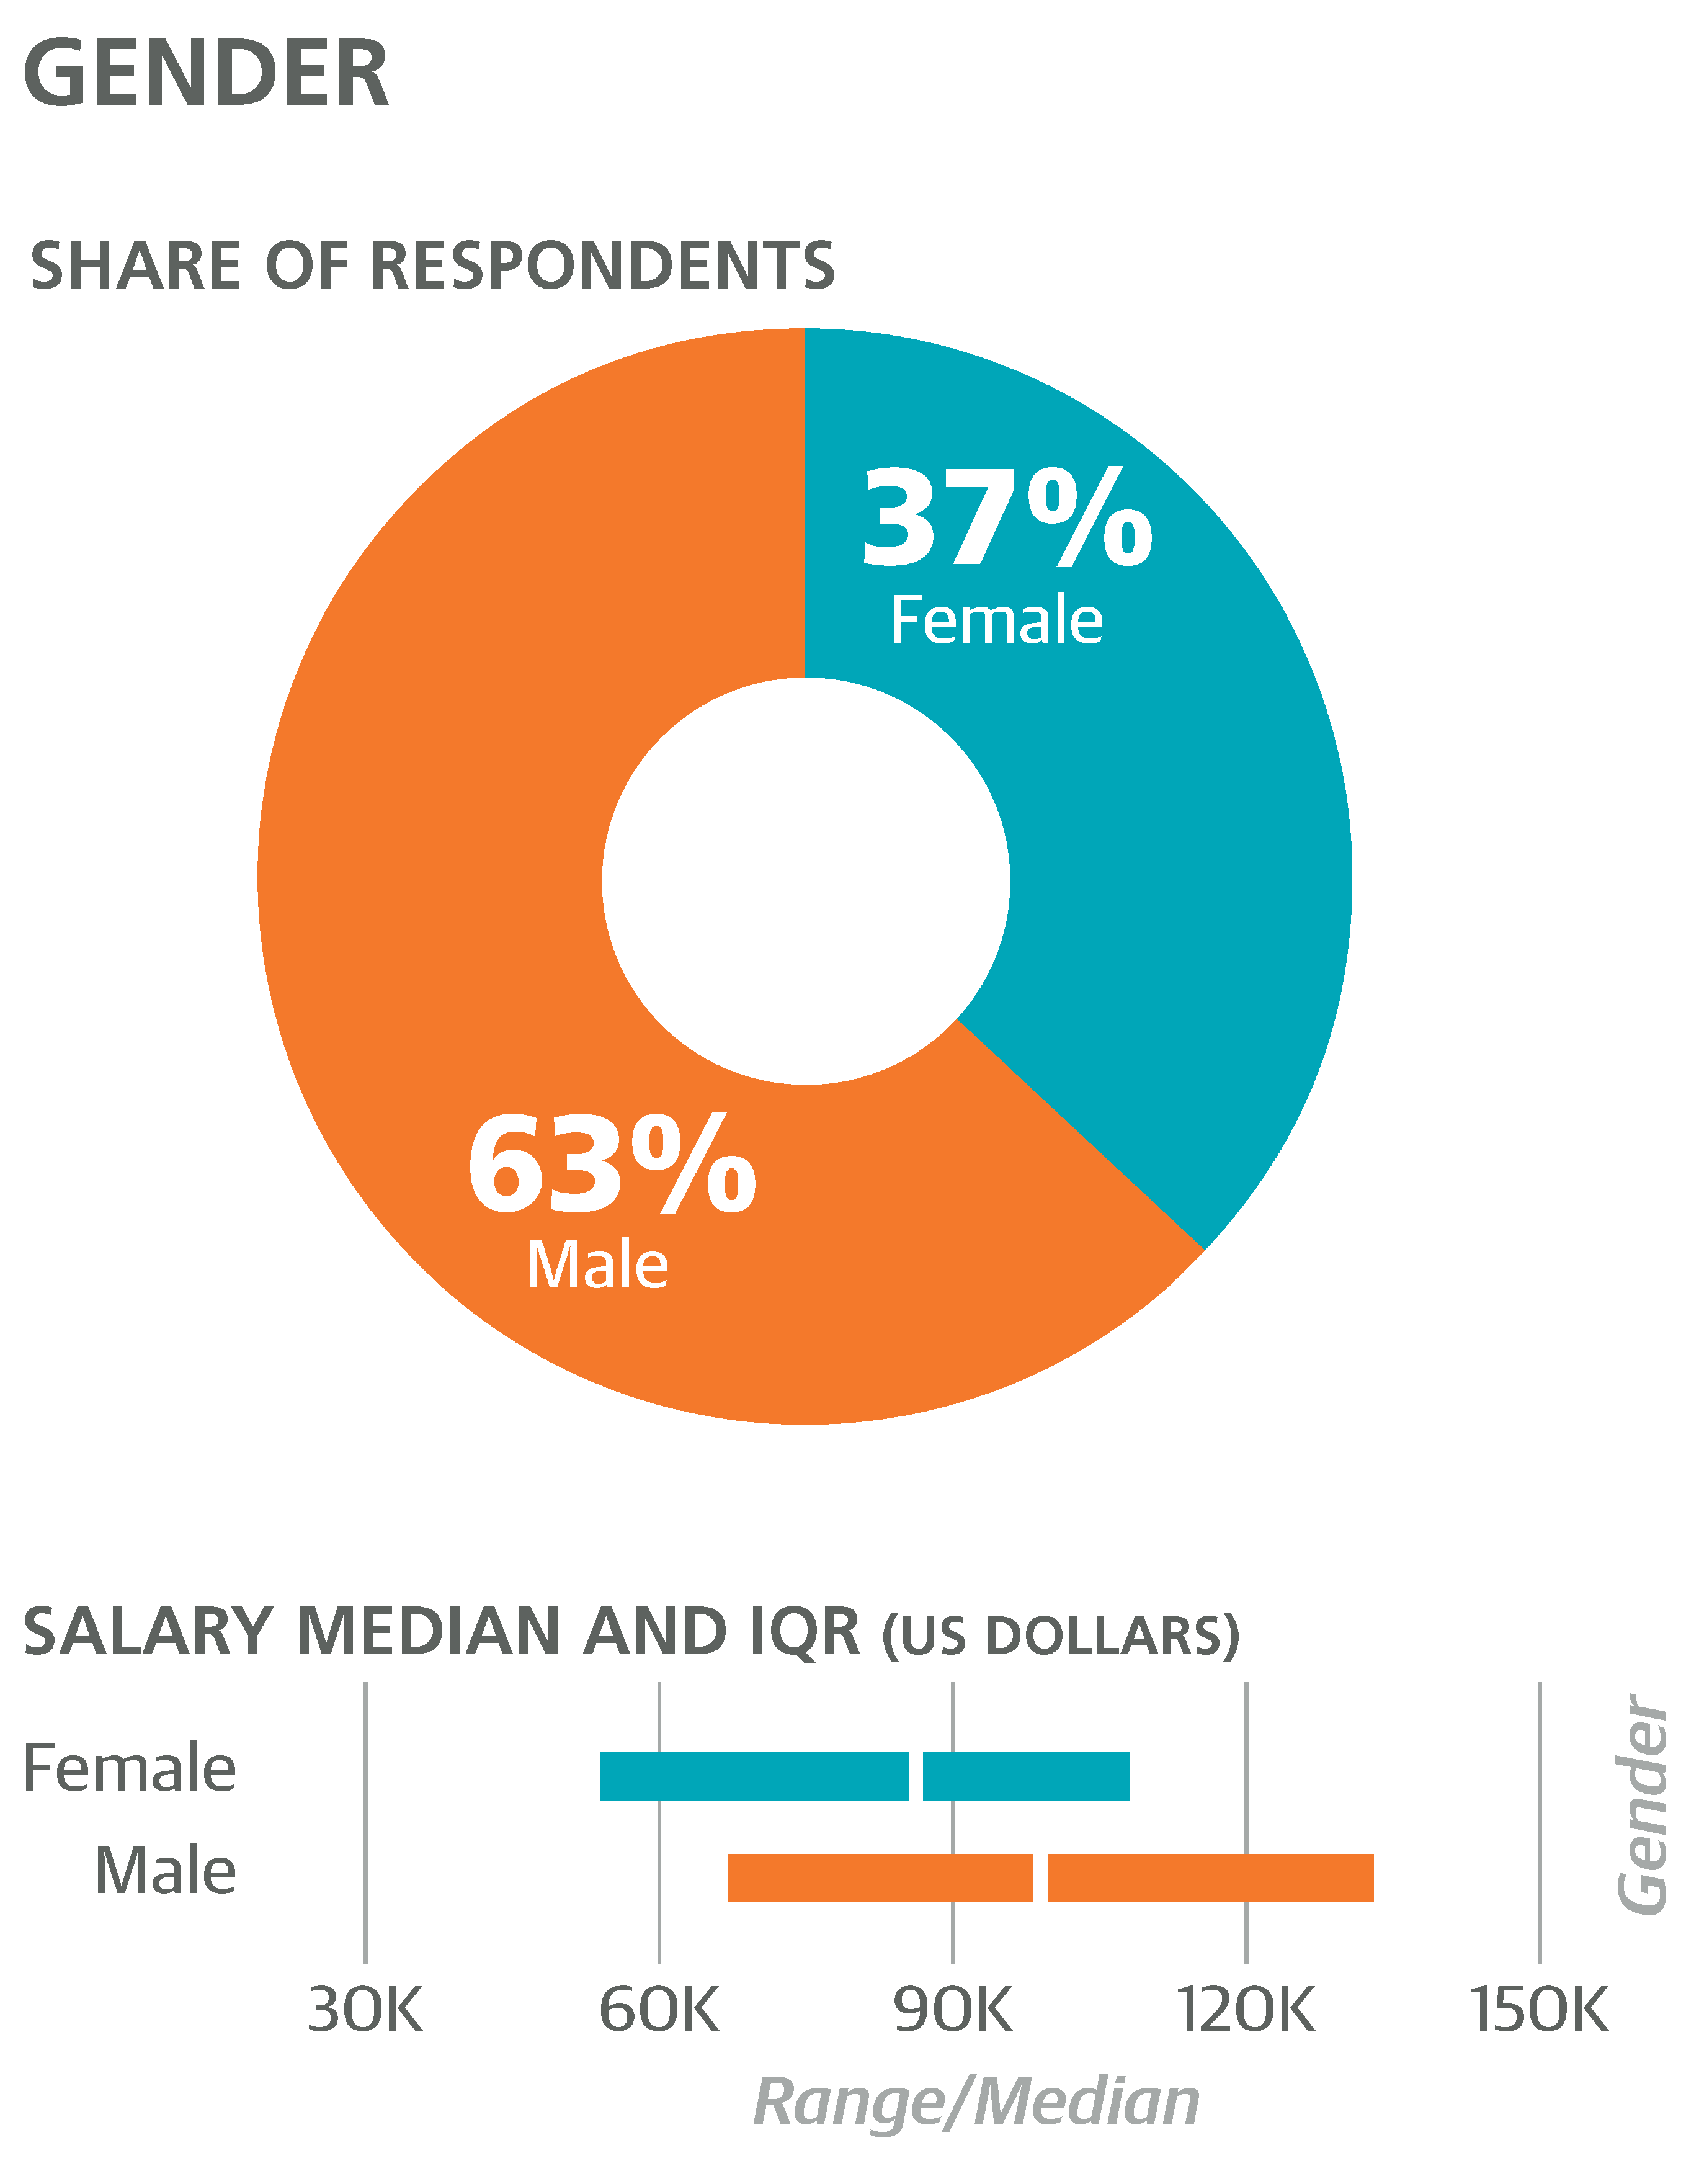
Two-thirds of the respondents were male, and a significant gap in median pay between male and female respondents was present ($99K and $85K, respectively). About half of the $14K difference in the sample is attributable to the fact that a larger share of the sample’s men held higher positions. Still, the –$6K coefficient for female in the linear model indicates that even when every other variable is held constant (same work, same skills) women earn about $6K less than men. This is roughly the same gender gap that we saw for data scientists in a different salary survey (depending on which model was used, $3K to $8K).
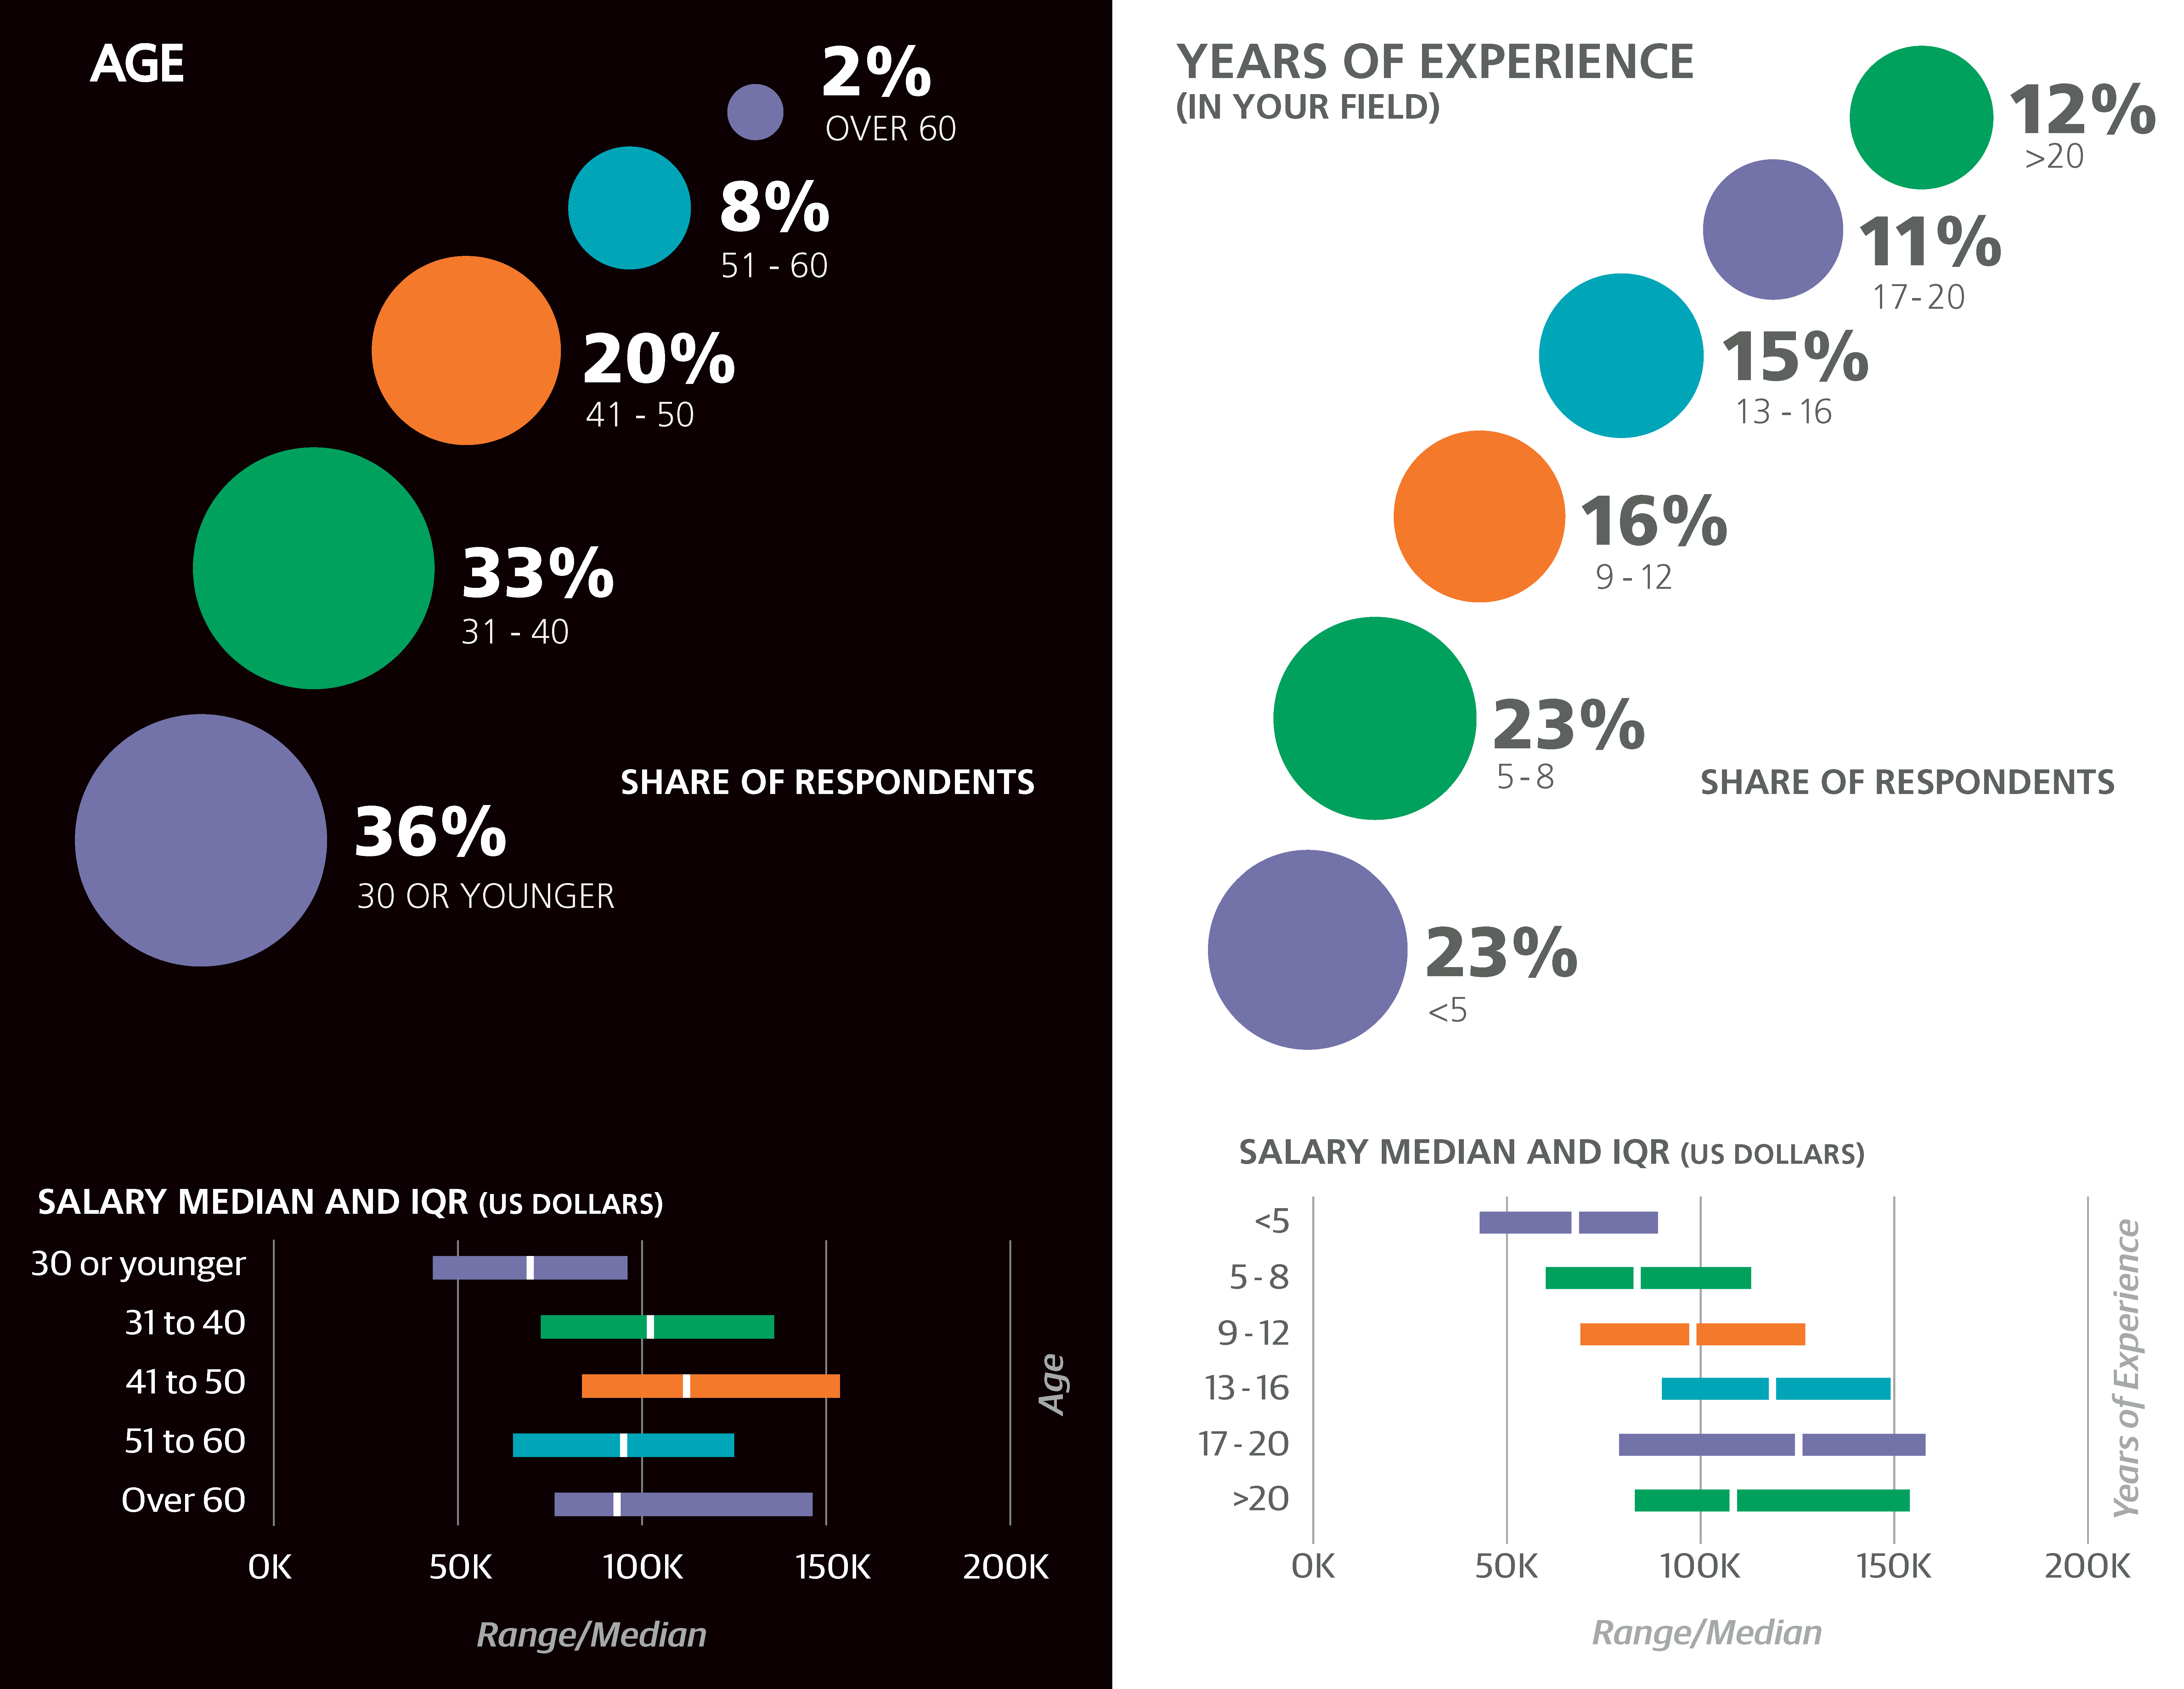
More than a third of the respondents were 30 years old or younger, and predictably this group had a lower median salary than the rest ($71K). However, the age groups with the highest salaries in the sample were from 36 to 50 ($116K), higher than the over-50 segment ($94K). This is partly explained (but only partly) by the different positions held by the respondents aged 36 to 50; for example, the share of directors in the 36 to 50 group was greater than in the over-50 group. About half of the respondents had at least 10 years of experience in their role, and earned a median salary of $114K, while the less-experienced half earned a median of $74K.
As for education, 4% had a doctorate degree and 29% had a master’s degree (but no PhD). While respondents with a PhD did have a higher median salary than average ($115K, though this is a fairly small sample), respondents with only a master’s did not have a significantly higher salary than those without one. Another significant pattern was that the 38% of respondents whose academic background was in graphic design reported a median salary of $81K—significantly less than those who had a different academic background (median $96K). In contrast, respondents with an academic background in mathematics, statistics, or physics earned much more than the rest of the sample (median $120K). Like the PhD figure, this is based on a small cohort—just 10 respondents— but it is worth noting that the titles of these respondents did not stand out from the rest: they were, for the most part, “UX” and “Designer.”
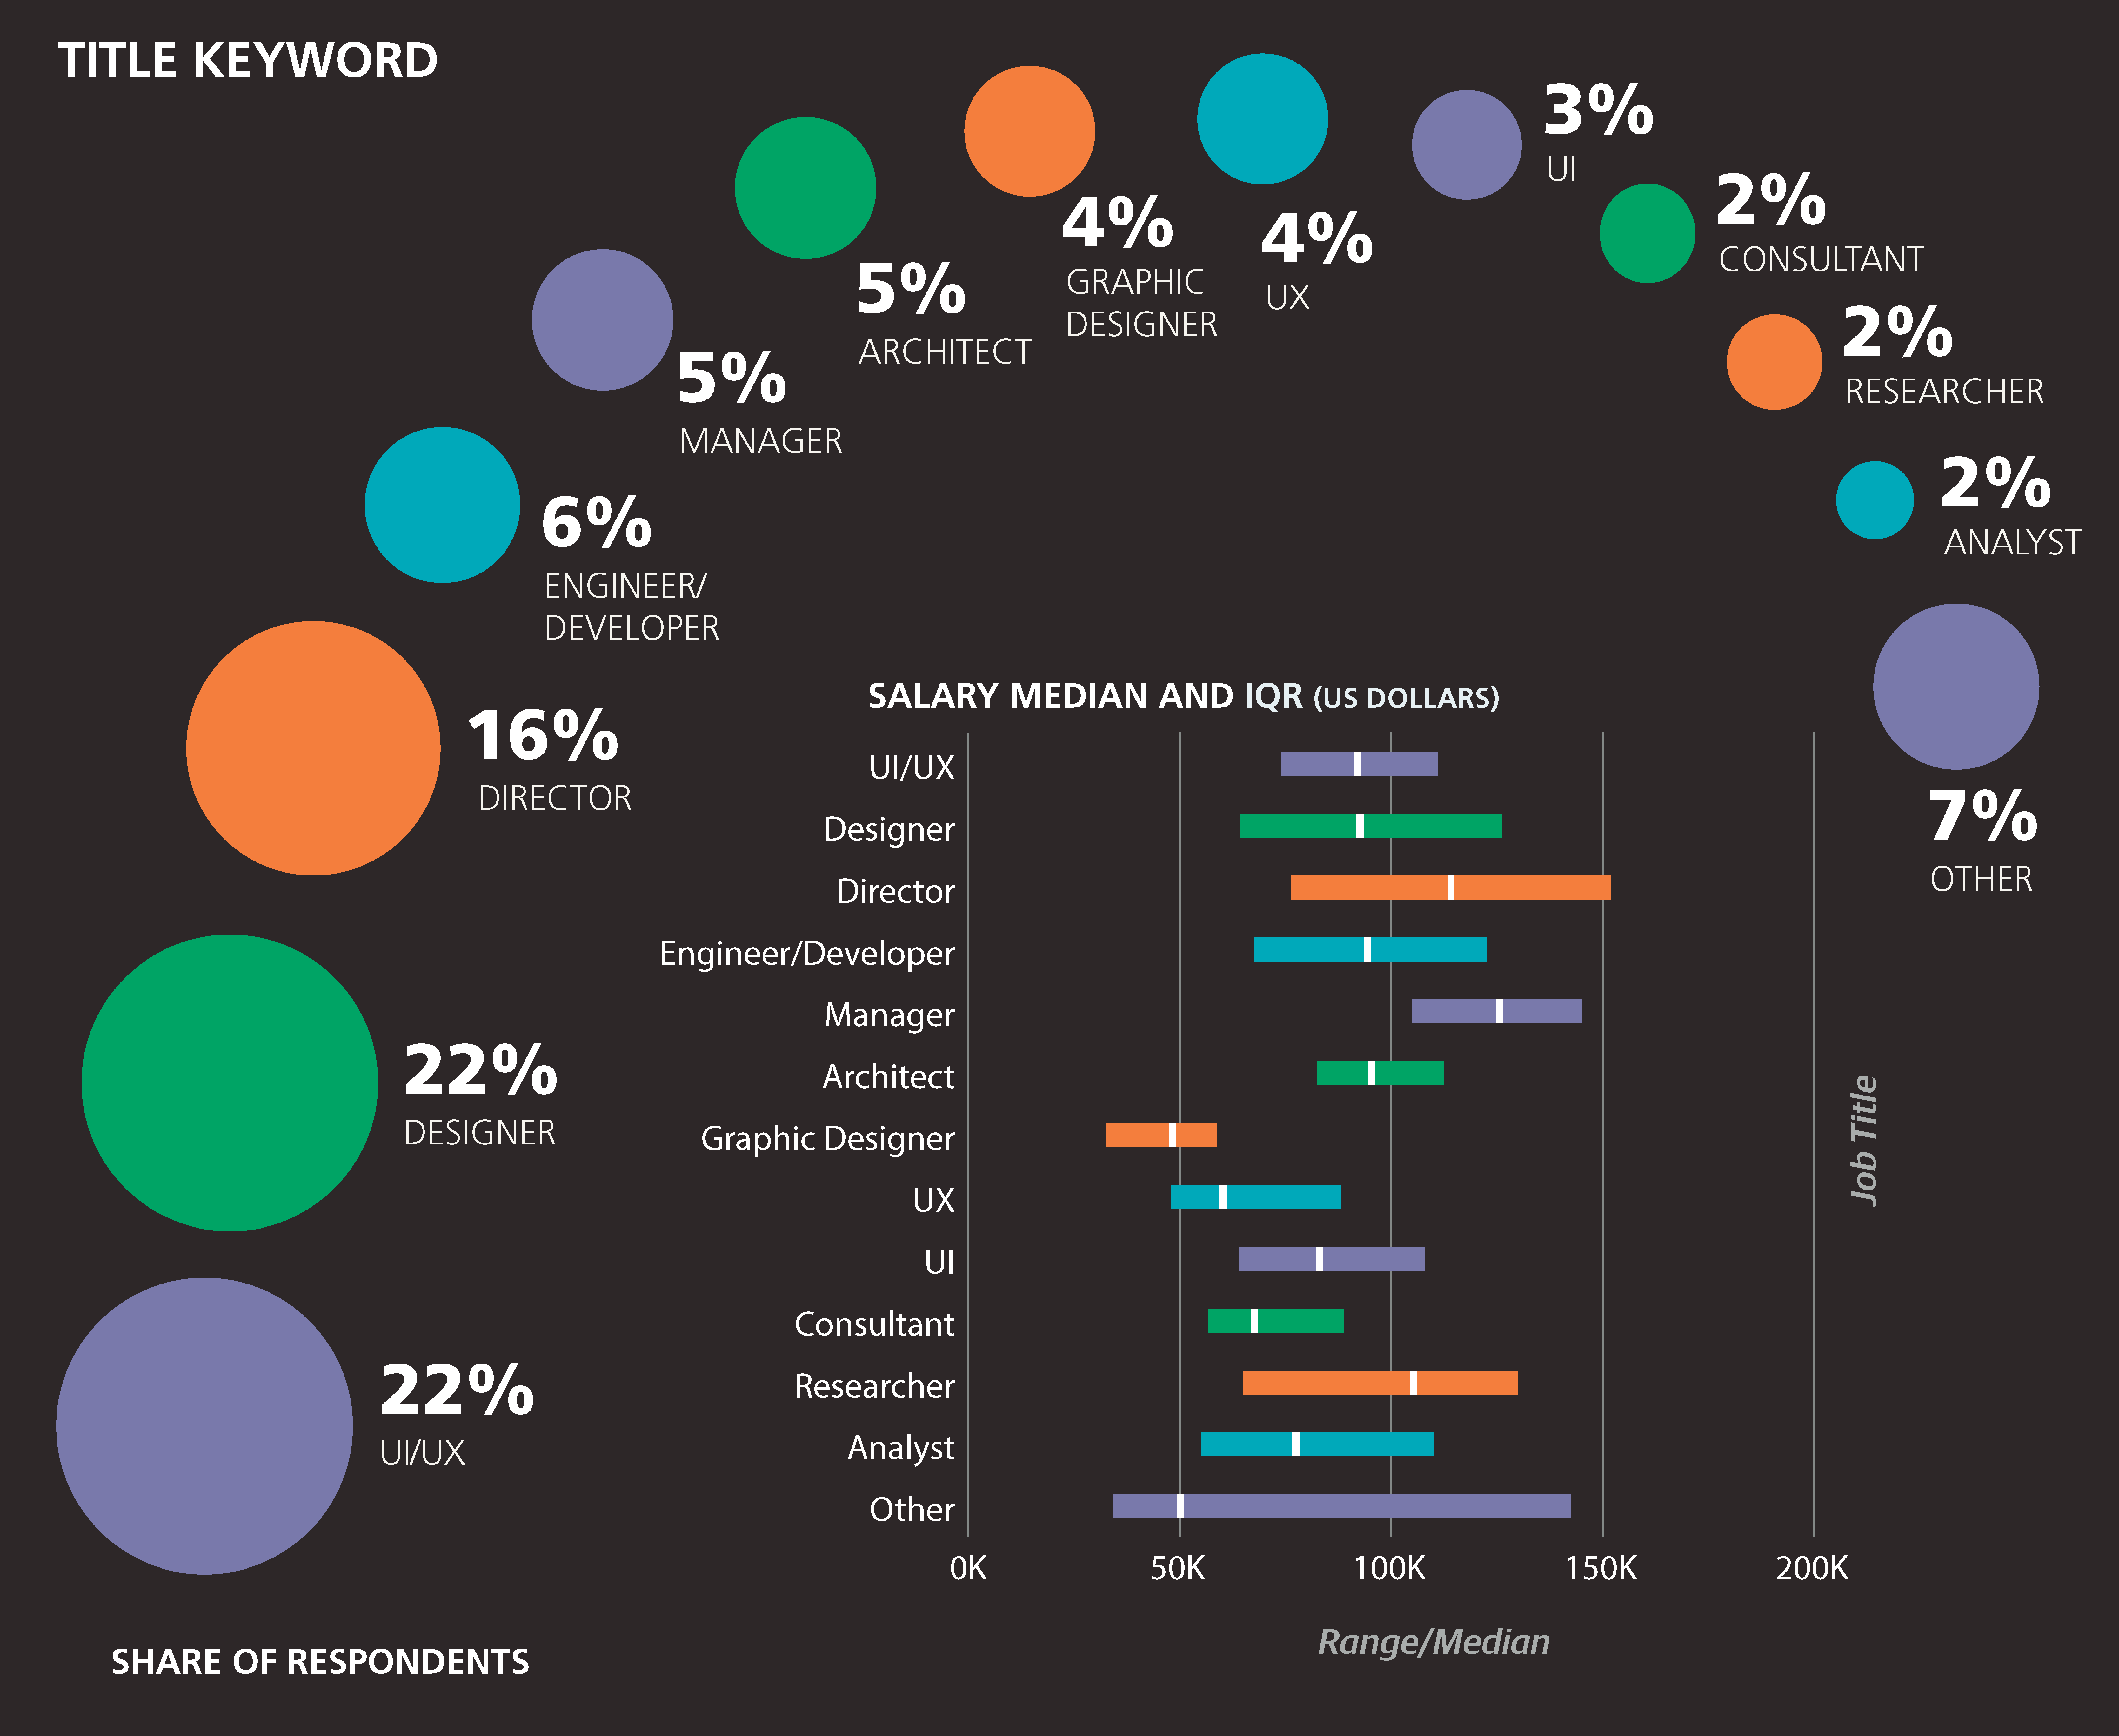
Job Title
JOB TITLE WAS COLLECTED AS AN OPEN-TEXT FIELD, and respondents entered 183 unique titles. Many of the titles are clearly just variations on the same type of role, but perhaps more accurately, they are points on a continuum: “Software Designer & Consultant,” “UX Consultant,” “UX Researcher,” “Design Research Associate,” “Visual Interaction Designer,” “Senior Mobile Interaction Designer,” “UI Developer,” “Web Developer,” “Front End Developer,” “Software Developer,” “Programmer.” Even this small list of titles could be binned in multiple ways. Our strategy here is to assign a title based on the first keyword it includes from a sequence: “Director,” “Manager,” “Architect,” “Consultant,” “Engineer/Developer” (or “Programmer”), “Researcher,” “Analyst,” “Graphic Designer,” “UI/UX,” “UX” (or “Experience”), “UI” (or “Interaction”), “Designer,” “Other.” So, “UX Director” becomes “Director” and “Designer Consultant” becomes “Consultant.”
Even though they come at the end of the keyword sequence above, “UX” and “Designer” were the top categories, each with 22% of the sample. The median salaries of these two groups, $91K and $92K, respectively, are approximately the same as the overall sample average. “UI” and “UI/UX” were broken out from “UX” to see if there were any key differences between these groups; the only real observation of interest is that there were far fewer titles containing “UI” or “UI/UX” than just “UX.” In terms of salary, respondents with “UI” or “UI/UX” titles earned less than the larger “UX” respondents, but this is entirely explainable by other variables; in particular, “UI” and “UI/UX” were much more common outside of the US, where salaries tended to be lower.
Most of the “Manager” job titles were some variation of “UX Product [or Project] Manager.” As we would expect, median salaries of managers ($126K) and directors ($116K) were the highest. In the sample, managers earn more than directors, likely influenced by more than half the managers working at companies with more than 10,000 employees while more than half the directors worked at companies with fewer than 100.
In the sample, managers earn more than directors, likely influenced by more than half the managers working at companies with more than 10,000 employees, while more than half the directors worked at companies wither fewer than 100.
Such a pattern shows a problem with trying to read too much into the job title results in isolation. While directors are generally understood to outrank managers, a “UX Director” at a small company may have similar duties and manage a similar number of people as a “UX Manager” at a large company— and we know that the number of people managed tends to correlate with salary.
Architects and engineers/developers made up 6% and 5% of the sample, respectively, but did not have significantly larger salaries than “UX” or “designers.” Graphic designers, however, reported much lower earnings than most other respondents (median $49K). This discrepancy turned out to be the one parameter from the job title question we used to build our linear model. That is, the factual information captured in other questions from the survey, e.g., “do you manage people” or “do you code,” helped predict salaries better than nominal data like job title.
Company, Team, Product
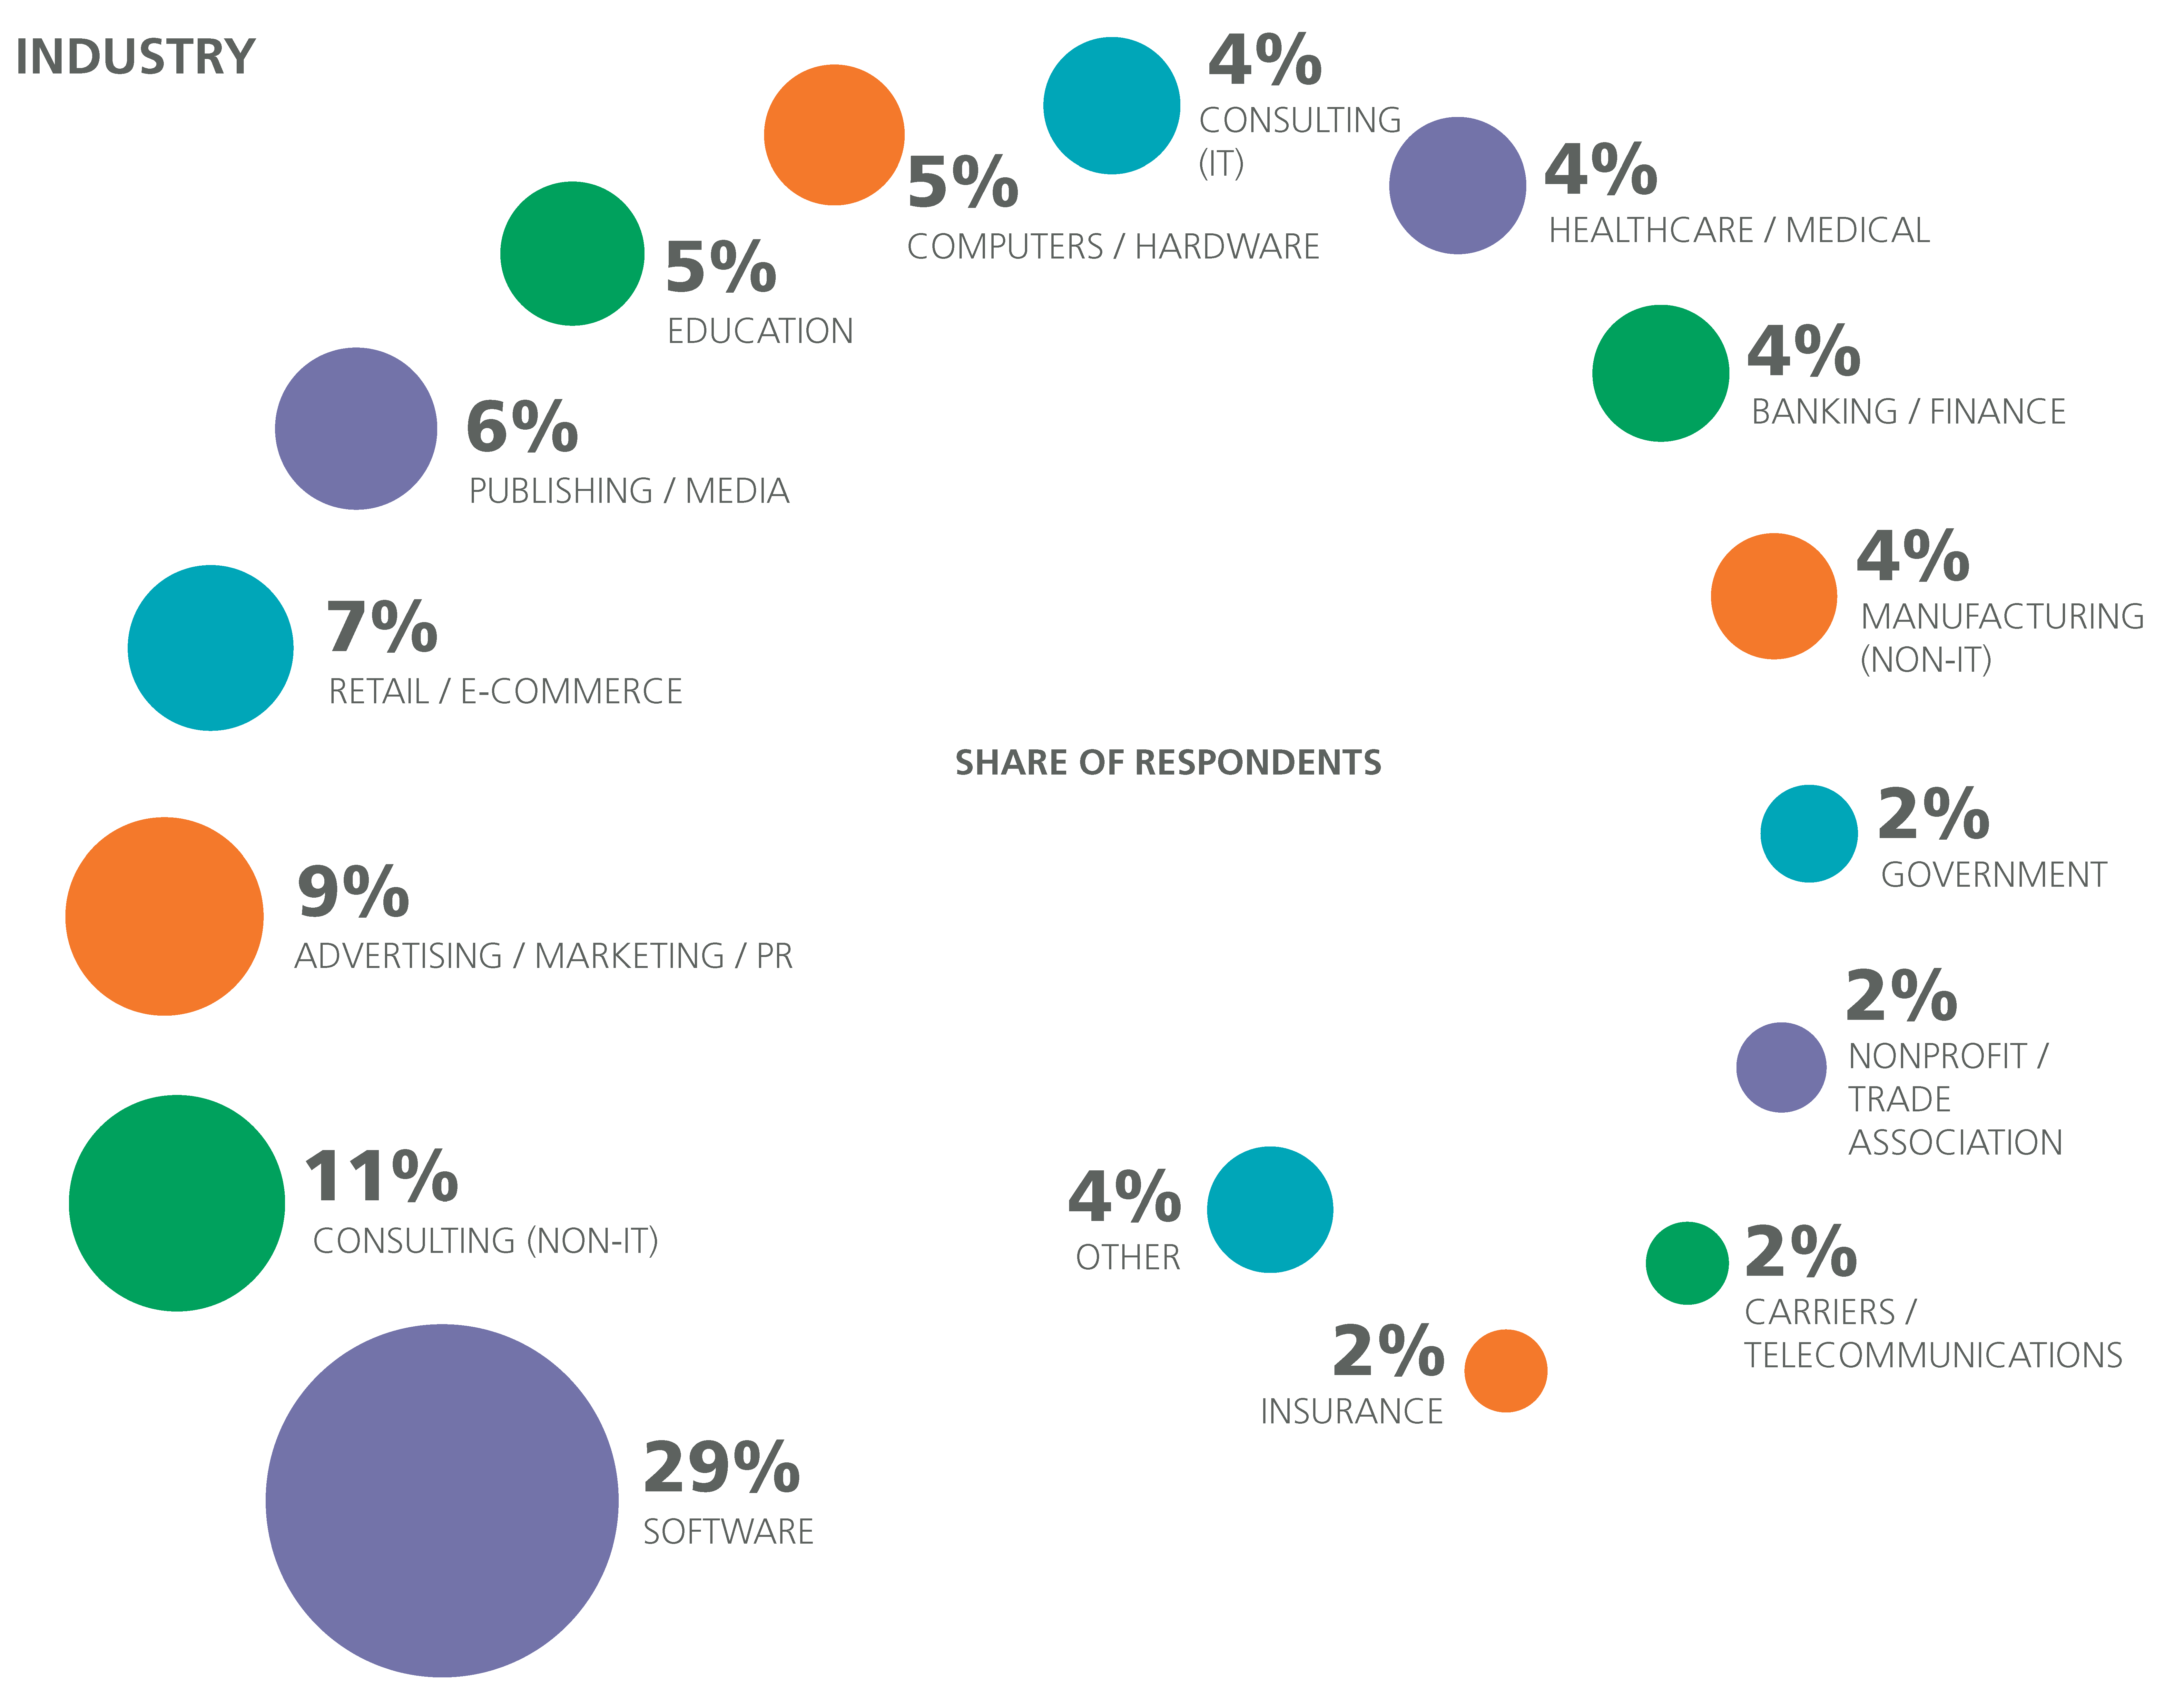
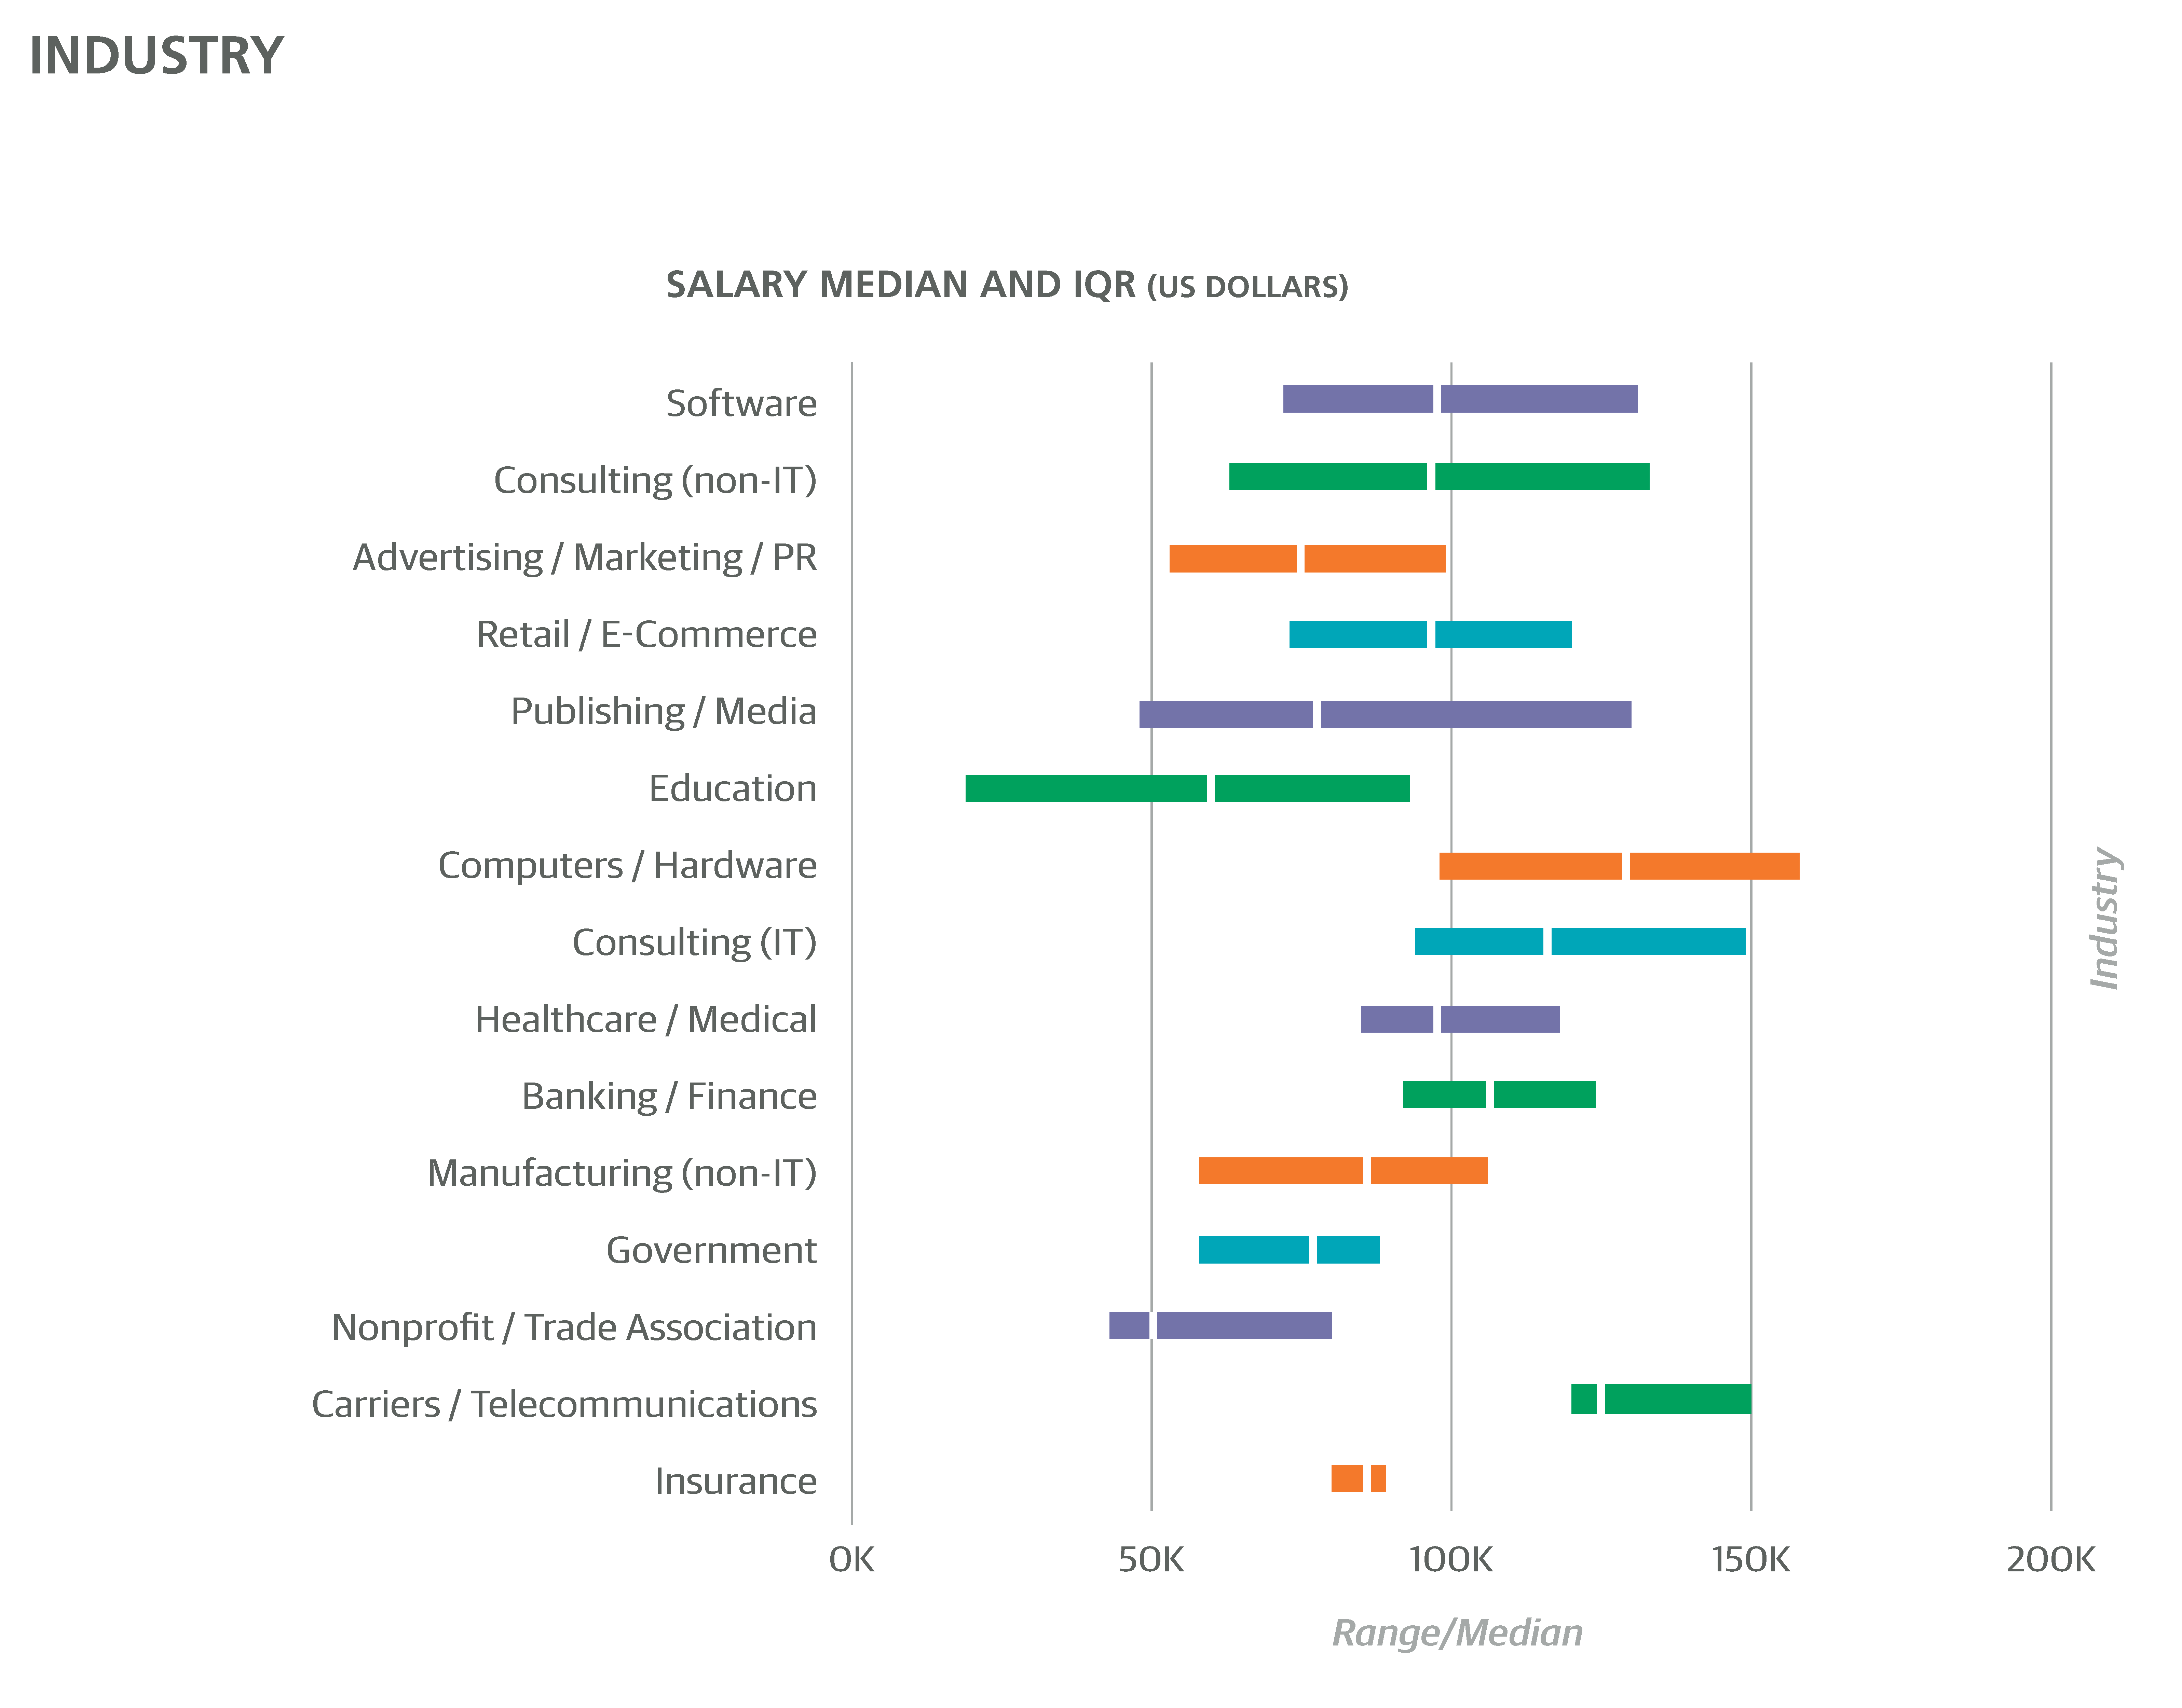
SOFTWARE WAS THE MOST WELL-REPRESENTED INDUSTRY in the sample (29%), followed by consulting (15%). Computers/hardware (including wearables) stood out for its high salaries, with a median of $130K. This correlation is conflated with geography—half of the computers/ hardware respondents came from California—although even the non-California respondents from the hardware industry reported above-average salaries ($115K). This was even higher than the banking industry (median $108K).
While only 29% of respondents worked at companies from the “software industry,” the vast majority worked at companies that nevertheless produced software: 86% of respondents worked on web products, and a slightly smaller majority (69%) worked on mobile products (almost all of the latter also worked on web products). Fewer respondents worked on wearables (15%) or other connected devices (24%), but these respondents reported higher salaries ($110K and $105K, respectively) than those who worked on neither ($86K). More generally, respondents who did not work on products at all (services only) earned less: this was 13% of the sample, and they earned a median of $70K.
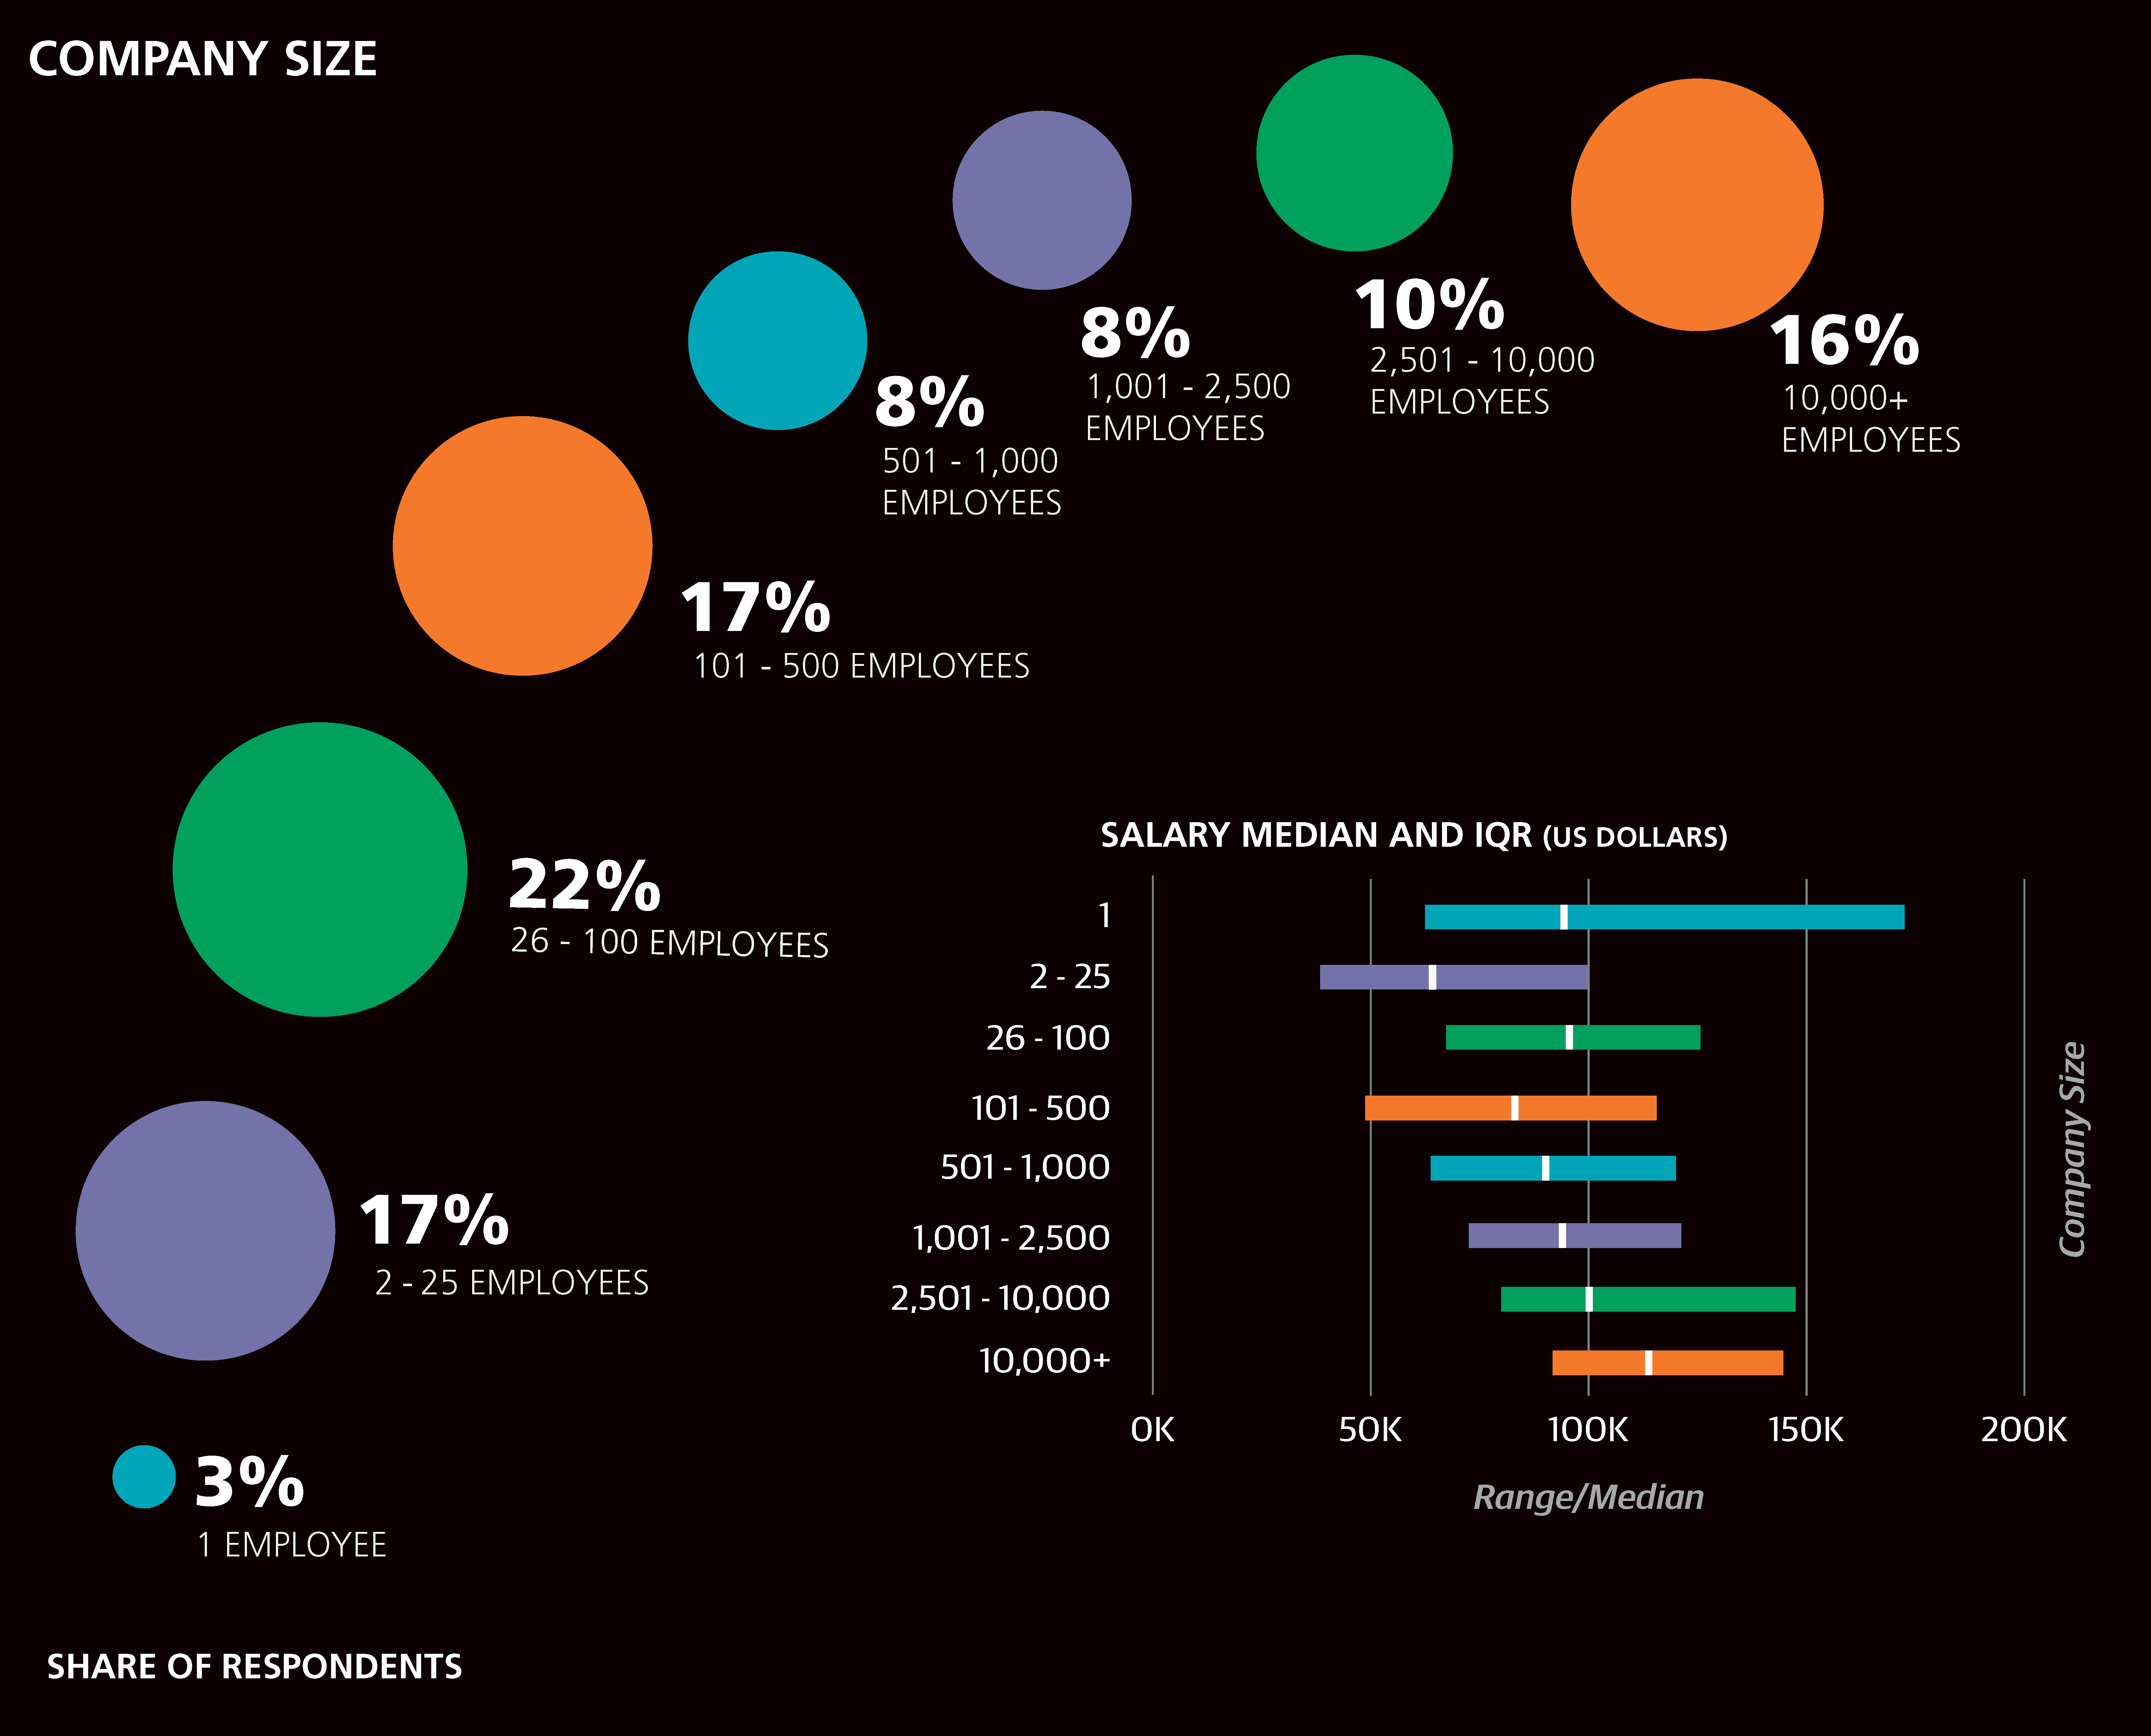
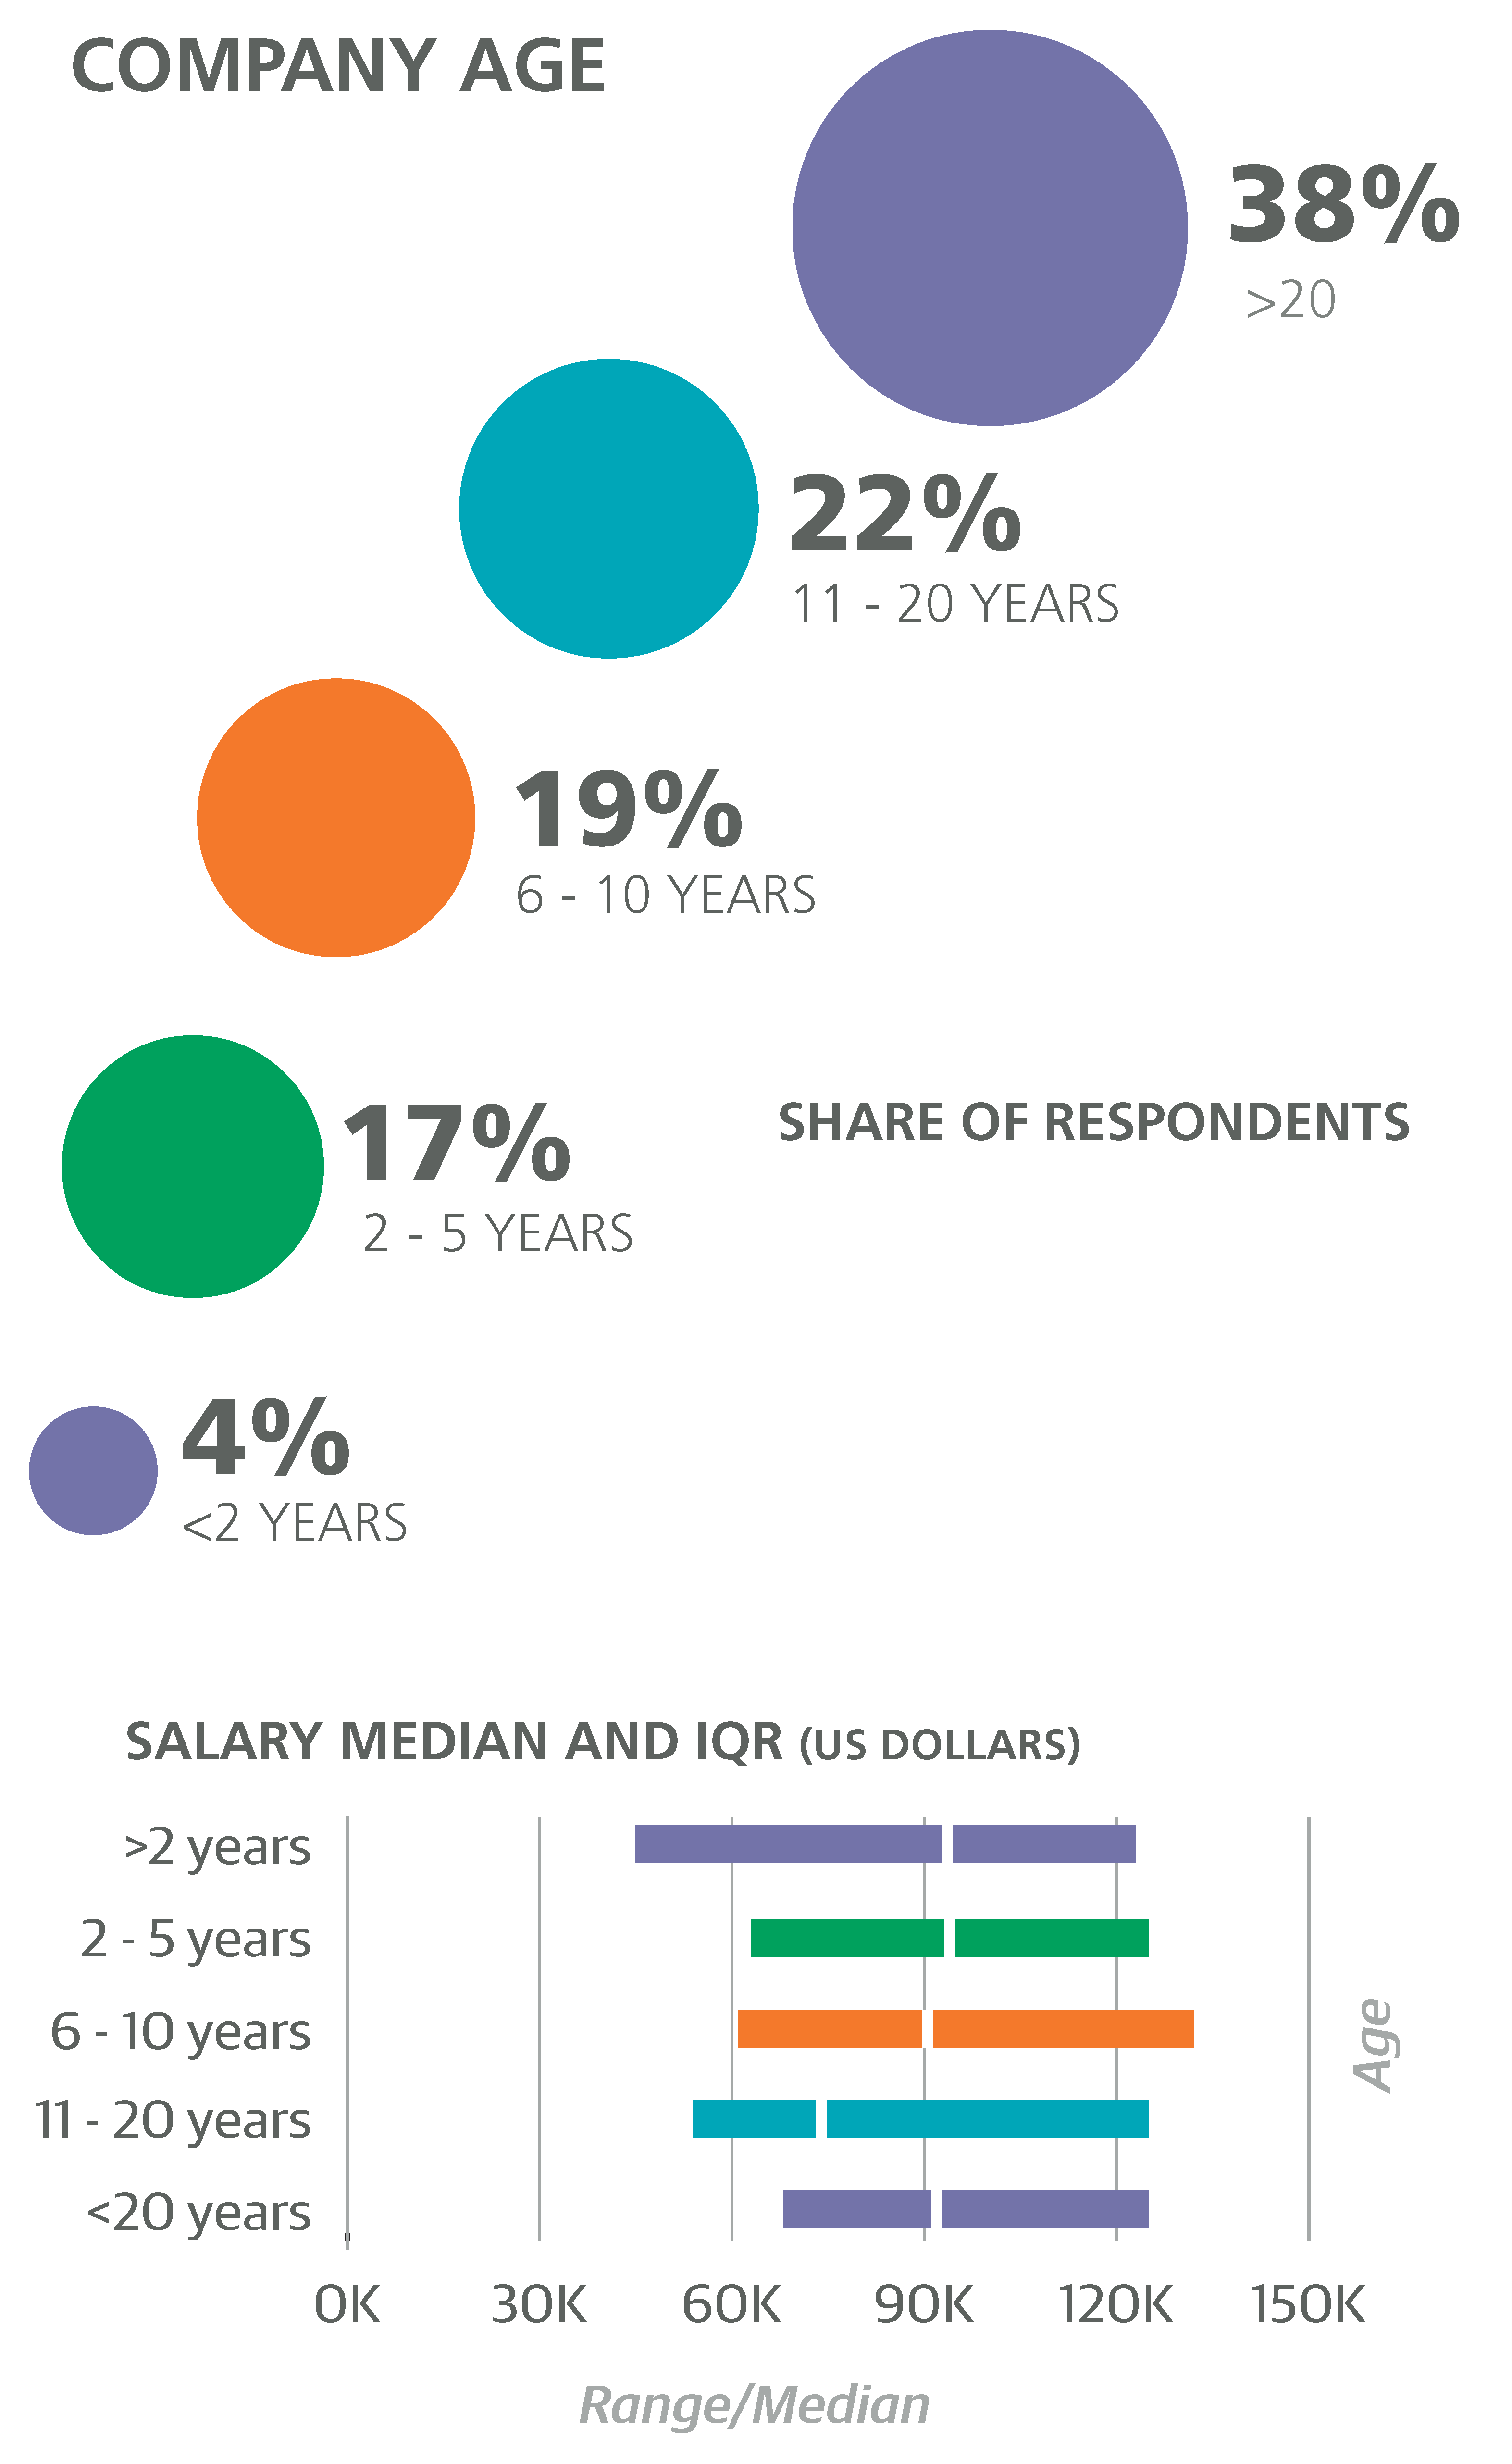
A quarter of respondents came from large companies (at least 2,500 employees) and had larger salaries: $114K versus $83K among respondents from smaller companies. Company age was varied in the sample—21% from companies no older than 5 years, 38% from companies older than 20—but this variable did not appear to have any significant correlation with salary.
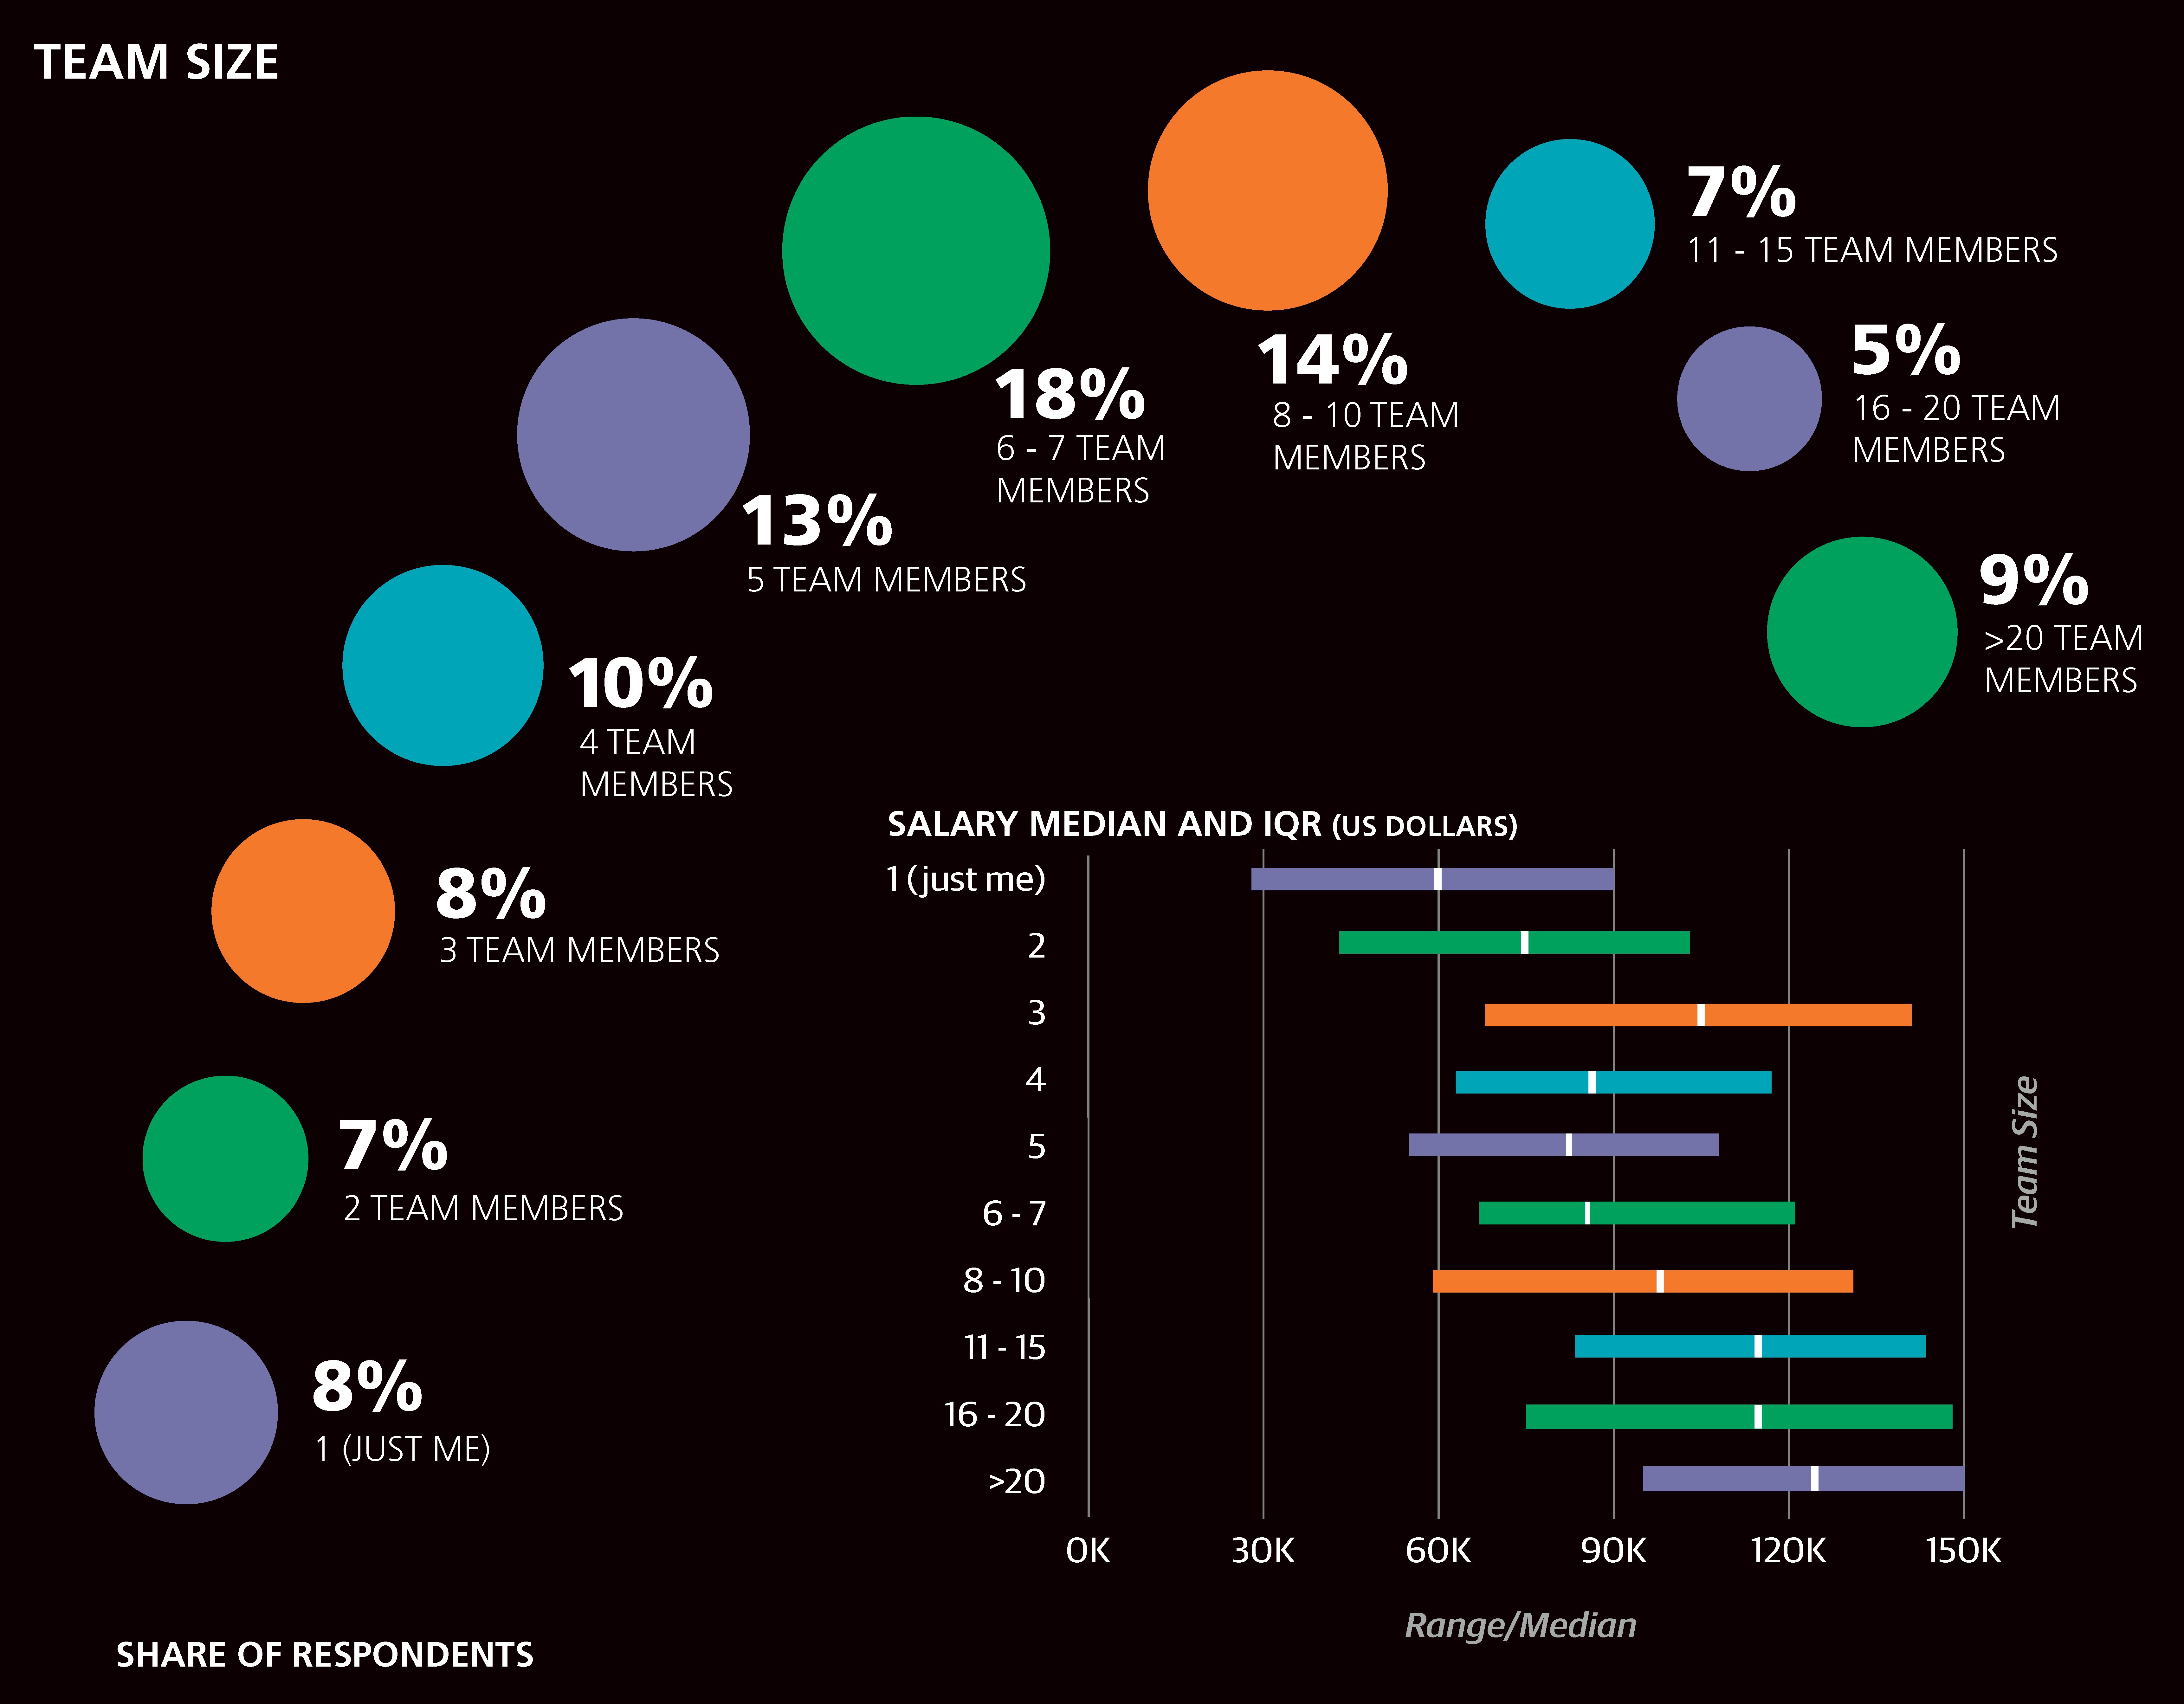
Most respondents’ teams contained between 4 and 10 people. Team size positively correlated with salary in the sample: members of larger teams earned more (for example, $117K median for those in teams with more than 10 members). Team size also correlated with company size, but we shall see that the model retained both as significant.
We also asked about the roles of colleagues—with whom respondents worked—and found that most work with programmers (84%), (other) designers (83%), and product managers (78%). For each of these three, the minority of respondents who did NOT work with that type of colleague earned significantly less than those who did. For example, the 84% who worked with programmers earned a median salary of $96K, while those who did not earned a median salary of $60K. One interpretation of why communication channels between other roles correlate with salary is that an employer who highly values designers (and is willing to pay them above-average wages) will also be more inclined to encourage their greater participation in the business. Such a possibility raises the general point that paying attention to how a prospective employer organizes teams is a good idea, and in particular, designers may prefer companies that integrate design with other functions over companies that treat design as a standalone silo. It should be mentioned, however, that for salespeople, the opposite of the above patterns was apparent: the 38% of respondents who reported working with salespeople earned less ($86K) than those who did not ($92K).
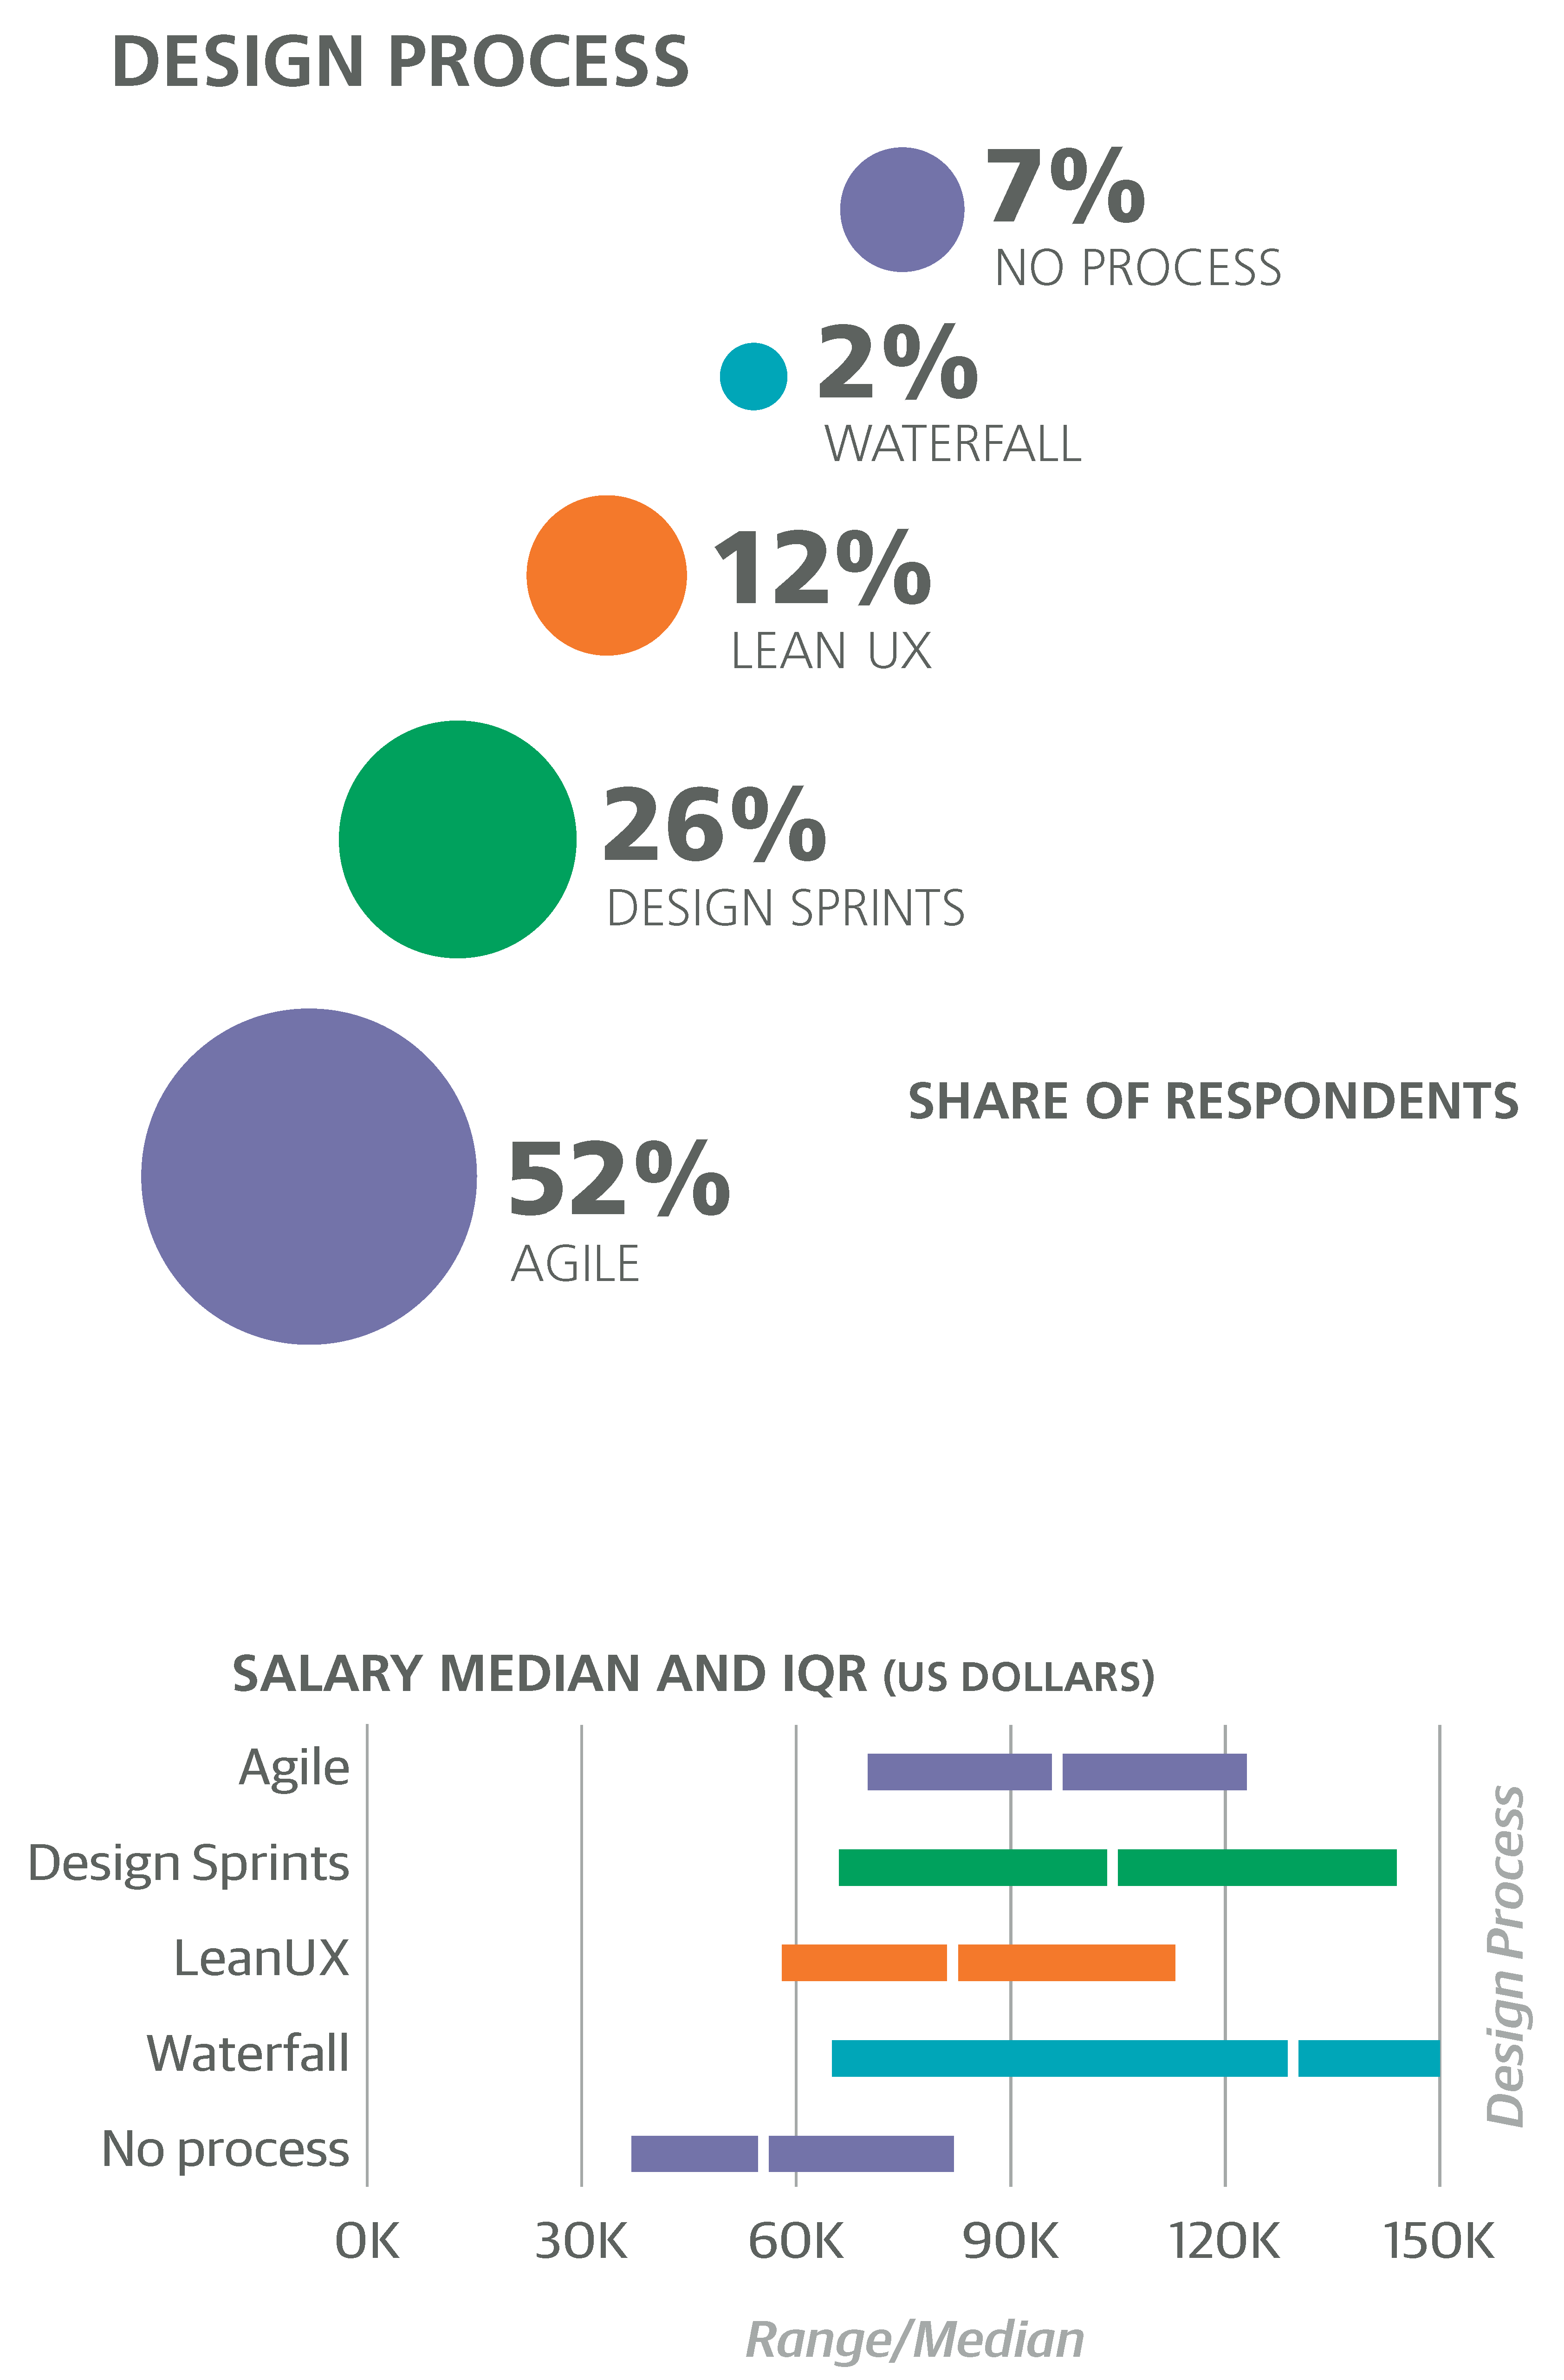
The design process may not lend itself to multiple-choice survey questions—many respondents gave a wide variety of answers, such as “half waterfall half agile,” “hybridized lean UX,” “whatever works best,” “a good mix of the above,” and, our favorite, “chaos.” 17% of respondents selected “other”, 43% use agile, 22% use design sprints, 10% use Lean UX, and 6% use no process at all.
Tasks
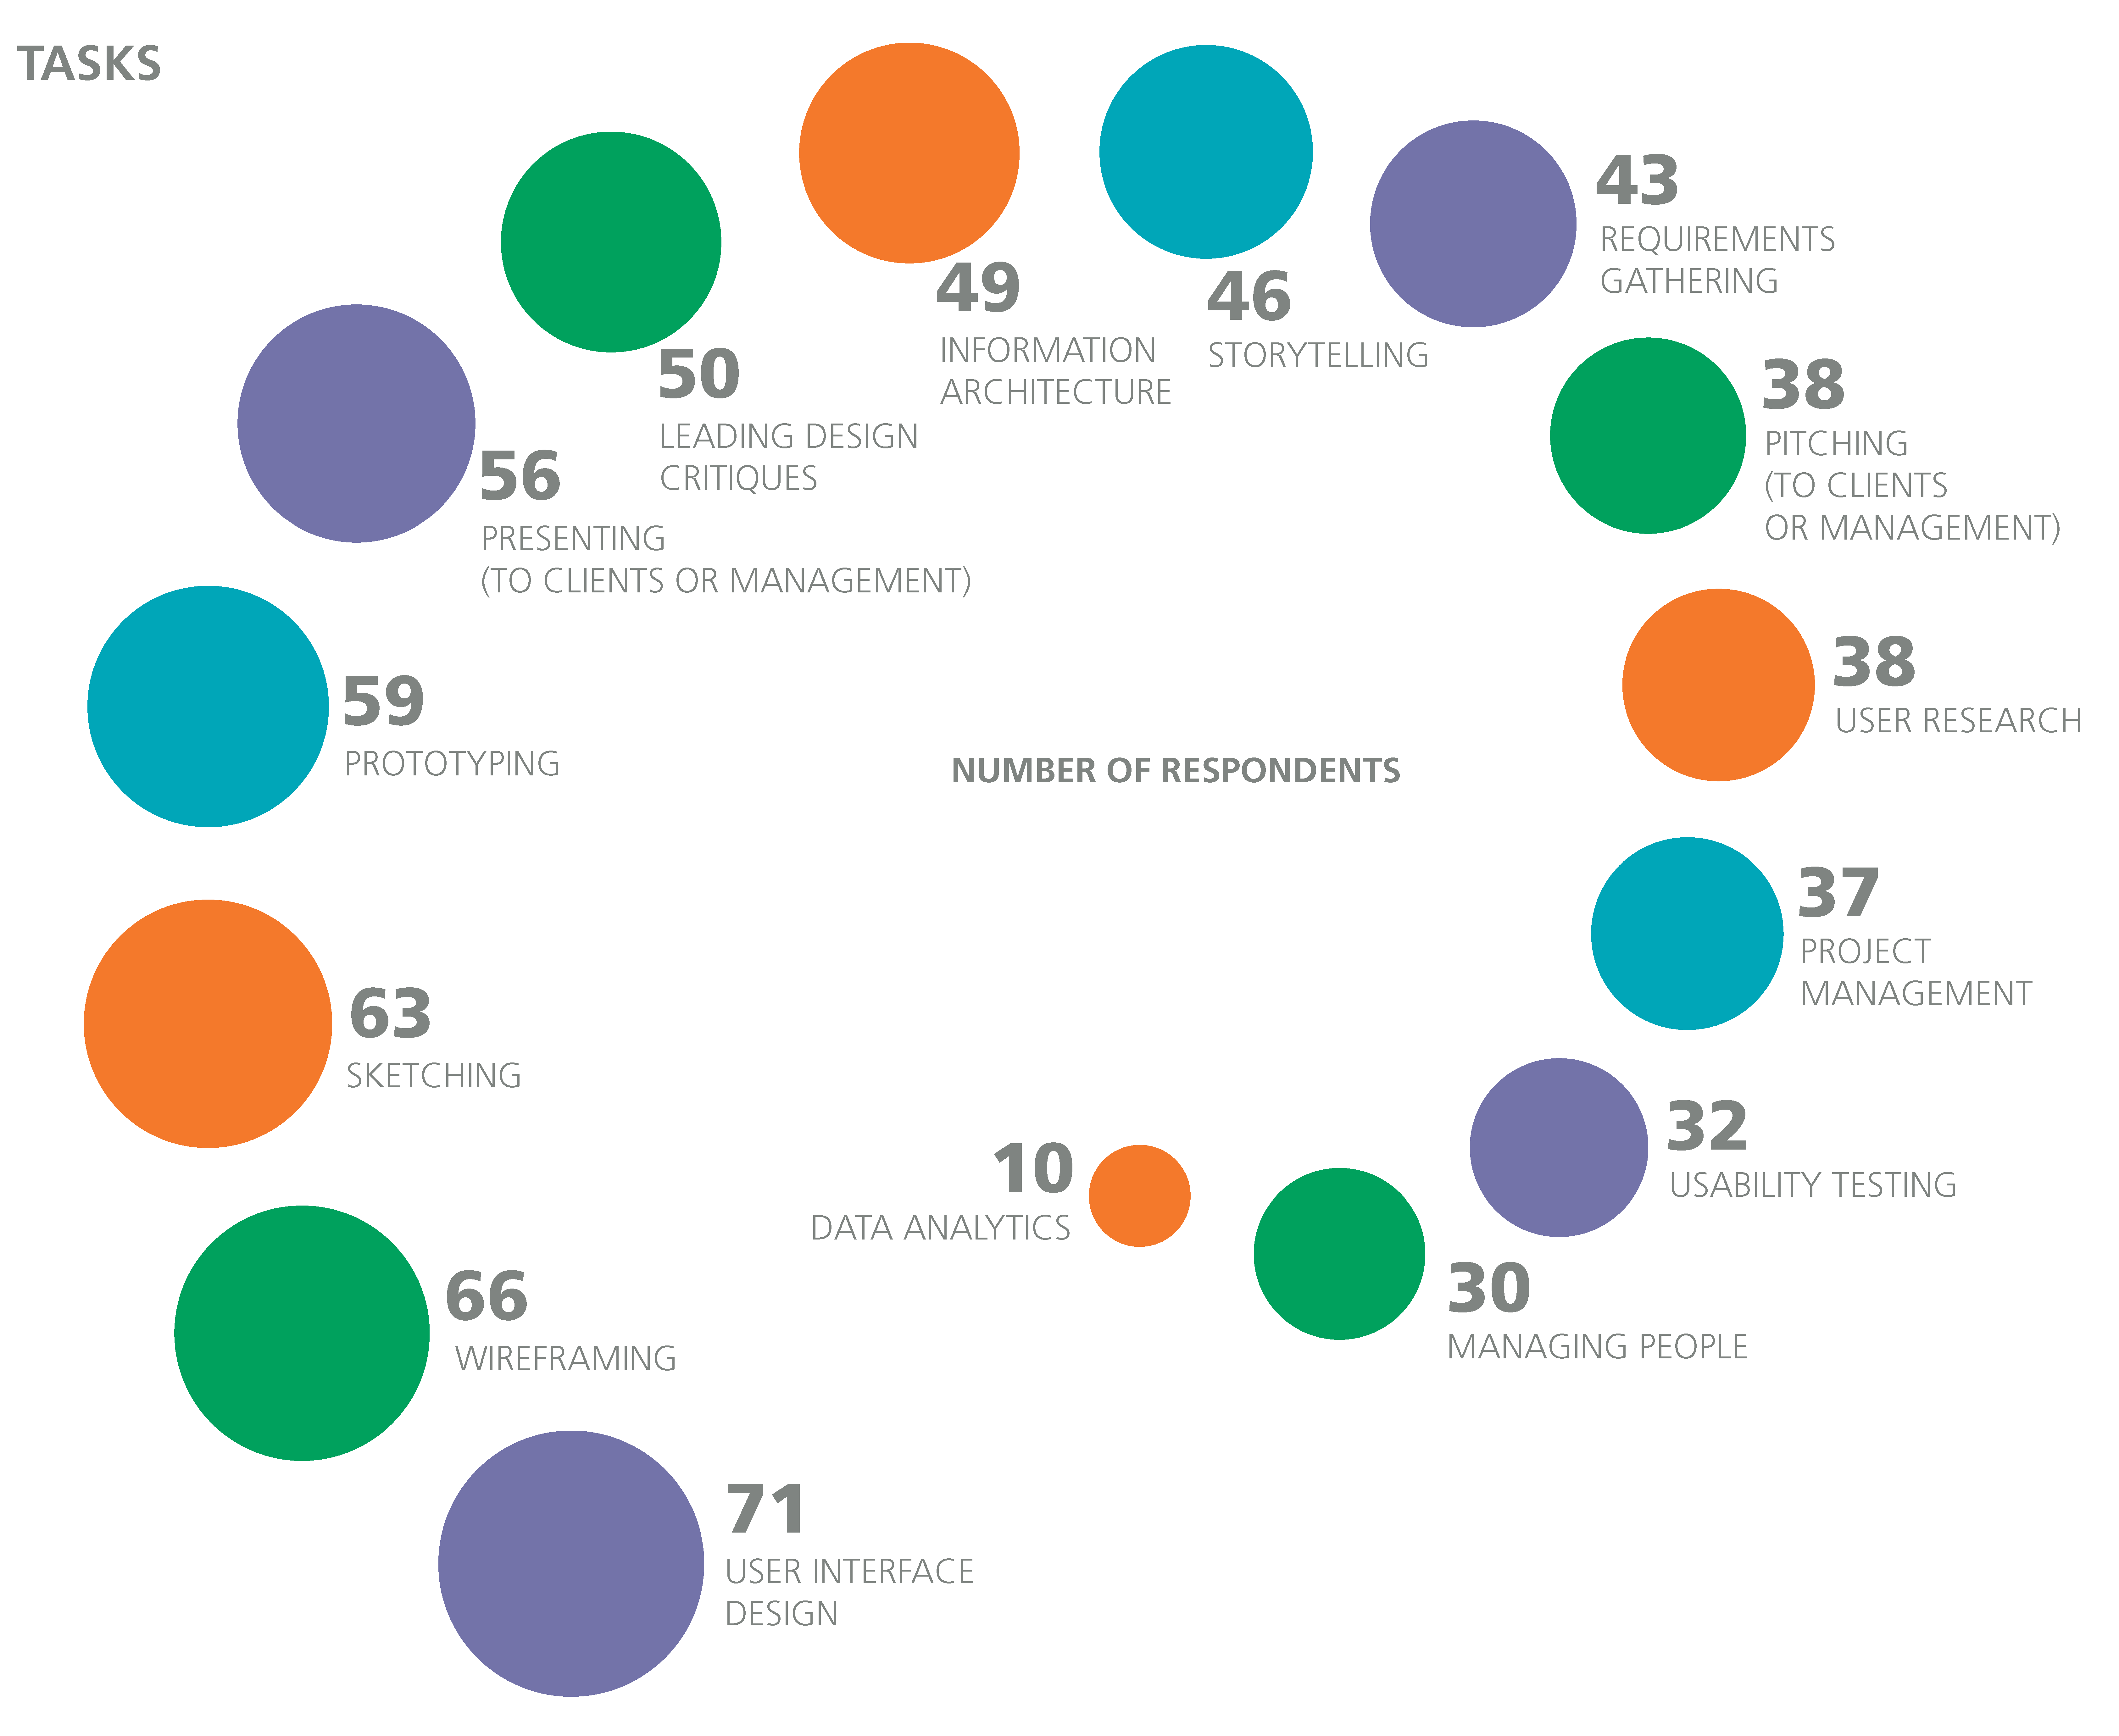
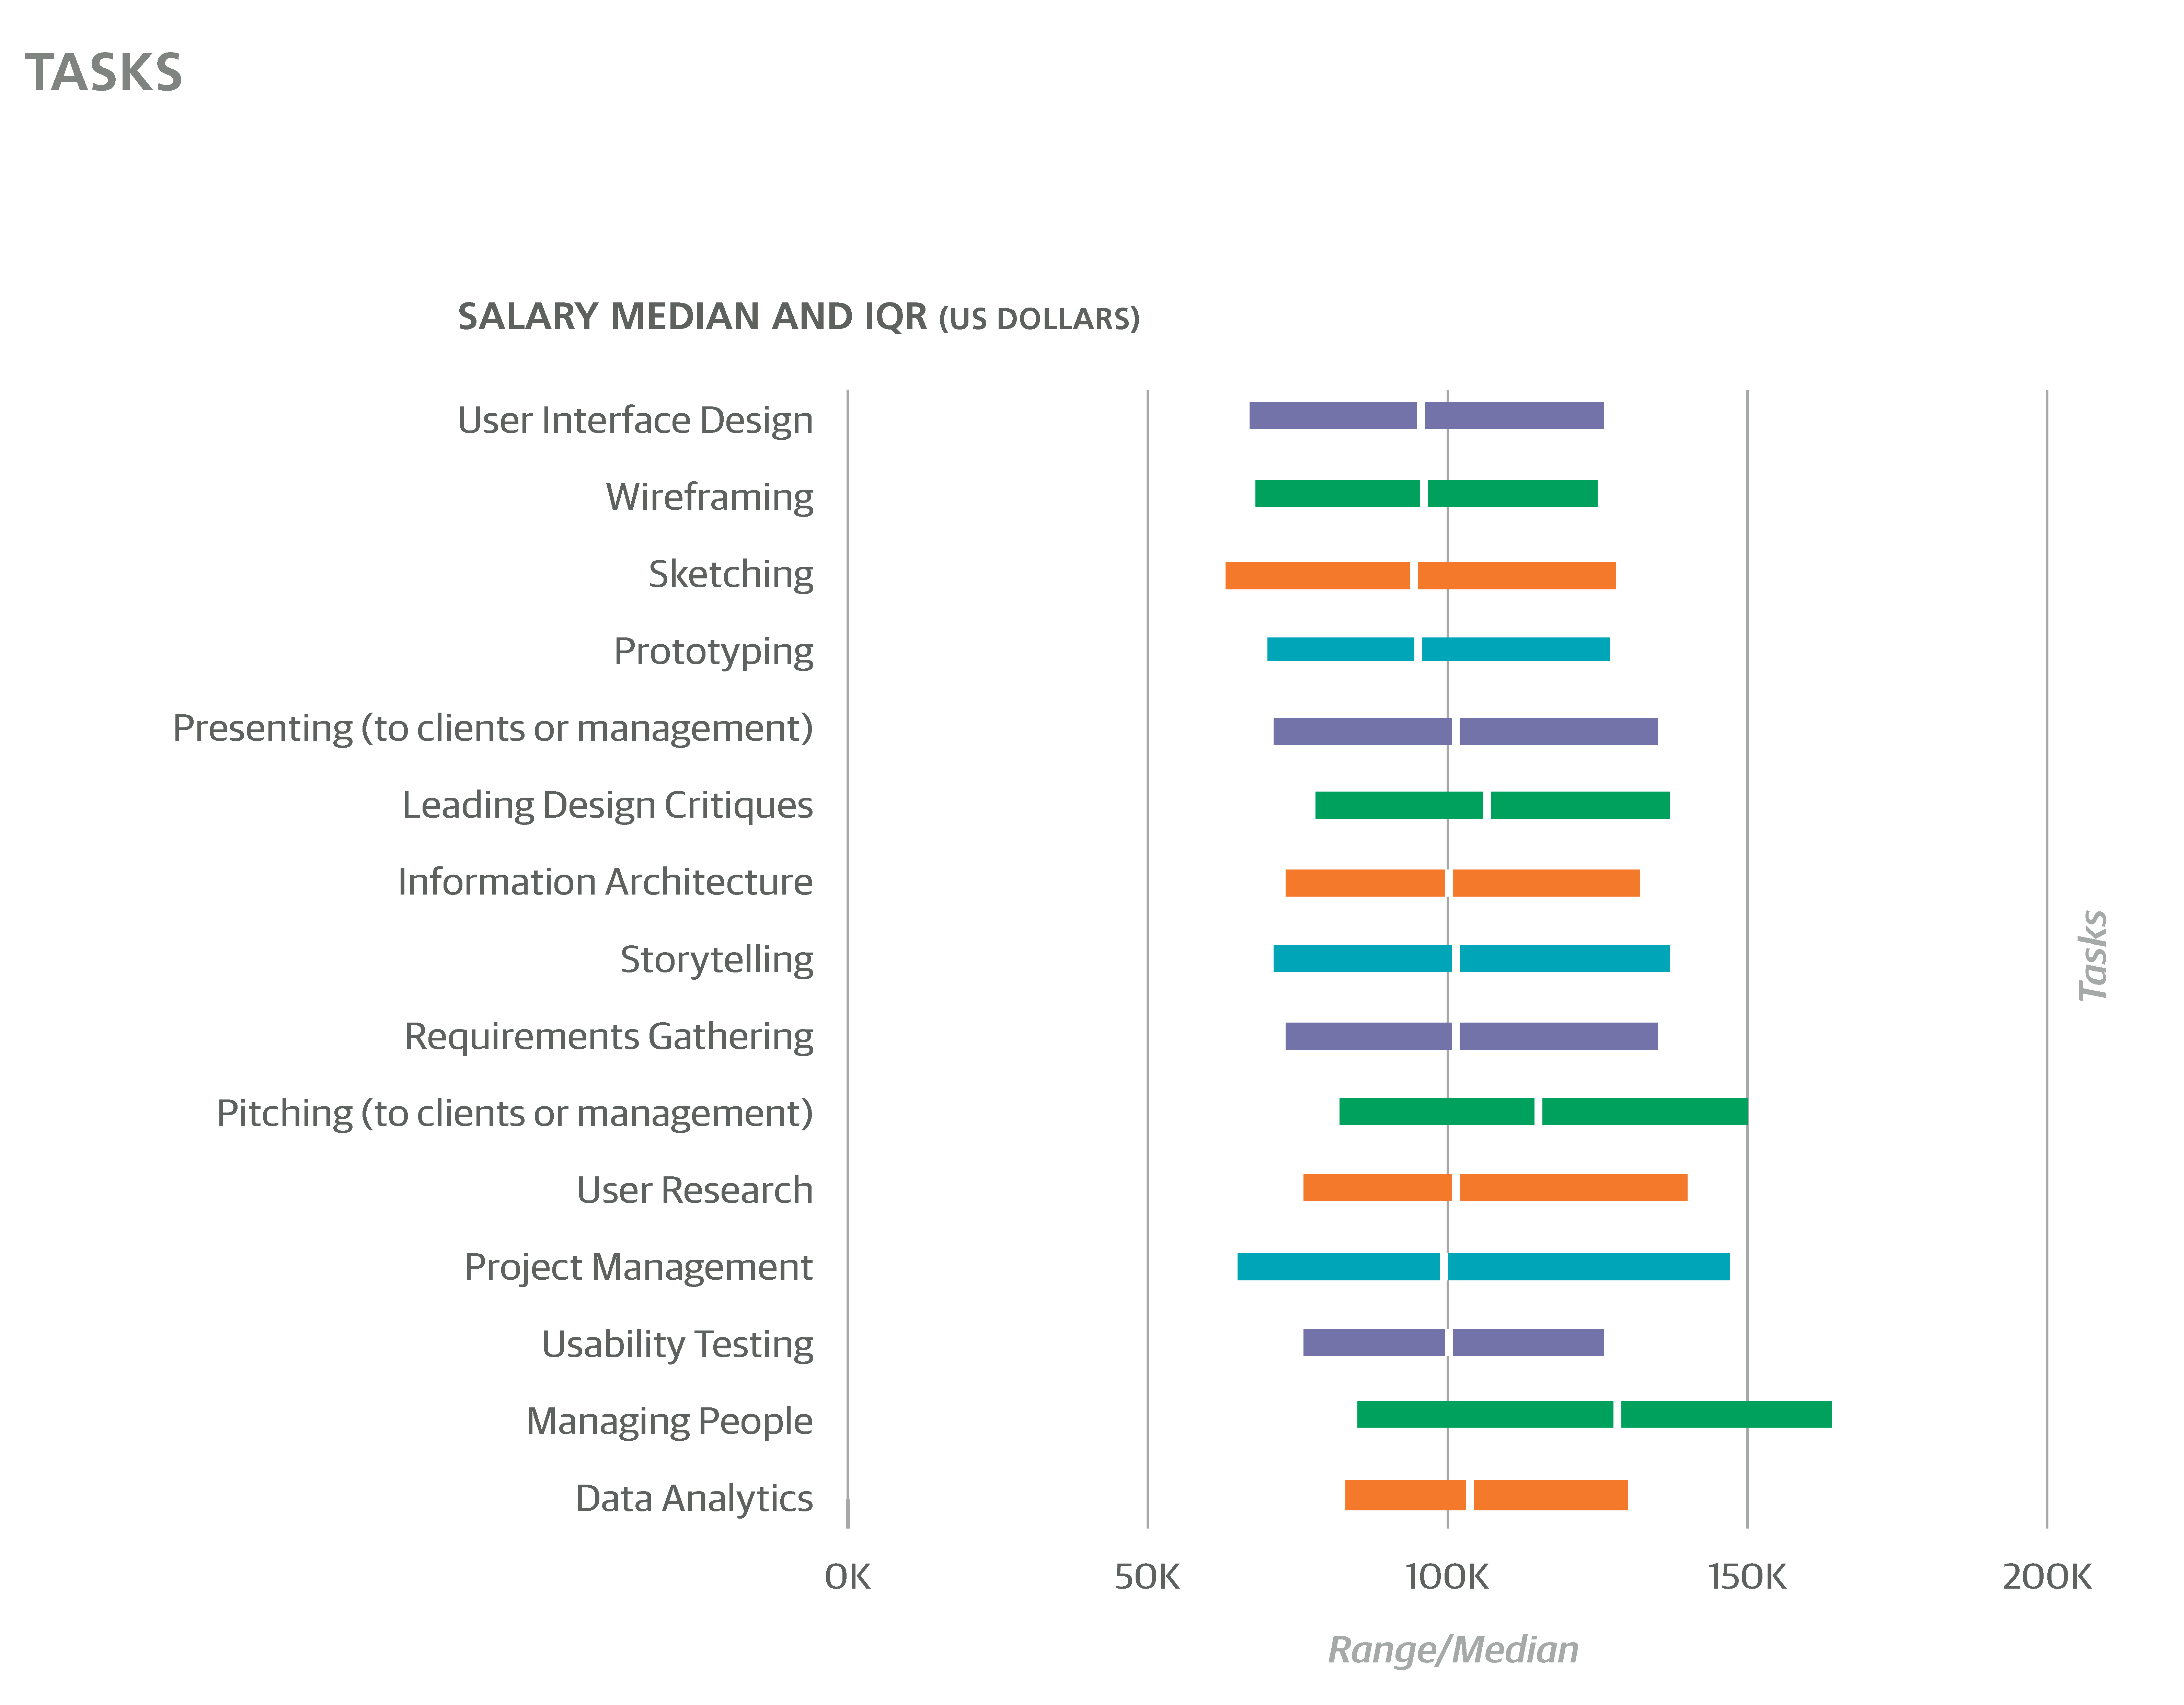
A MUCH BETTER WAY OF ASSESSING JOB FUNCTION than just a title is through questions about specific tasks. In this survey, we allowed respondents to answer “no involvement,” “minor involvement,” or “major involvement”—the latter meaning that this task is “essential to most or all of your projects and responsibilities, and that you perform it frequently (i.e., most days).” The tasks available were “user research,” “usability testing,” “information architecture,” “user interface design,” “data analytics,” “prototyping,” “wireframing,” “brainstorming,” “project management,” “managing people,” “requirements gathering,” “storytelling,” “sketching,” “pitching (to clients or management),” “presenting (to clients or management),” and “leading design critiques.”
For each of the 16 tasks, a majority of respondents reported that they have minor or major involvement—even managing people. Furthermore, for all tasks except “sketching,” respondents with more involvement earned more. That is, the more tasks a respondent indicated they take on, the higher their salary.
The median salary of the 20% that had major involvement in at most 4 tasks was $73K; the median salary of the 26% that had major involvement in more than 10 tasks was $118K.
Despite the explicit definition of “major tasks” provided in the survey questions, we think respondents appear to have interpreted “major” differently, i.e., respondents who report that they work on two or three tasks might not see the 10 tasks other respondents claim they work on as major. However, we see some indication that UX designers who wear many hats tend to earn higher salaries.
Aside from some of the more obvious correlations among tasks—“people management” and “product management” are often done by the same people—there are some worth pointing out. “Wireframing” and “prototyping” are often performed as major tasks by the same people, with half the sample involved in both, and only 21% involved in one but not the other. “User interface design” also highly correlated with each of these tasks. “Pitching,” “presenting,” “storytelling,” and “leading design critiques” correlated with each other.
“Data analytics”—the least common of the 16 as a major task—tended to be done by the same respondents who were involved in “user research,” “usability testing,” and “requirements gathering.”
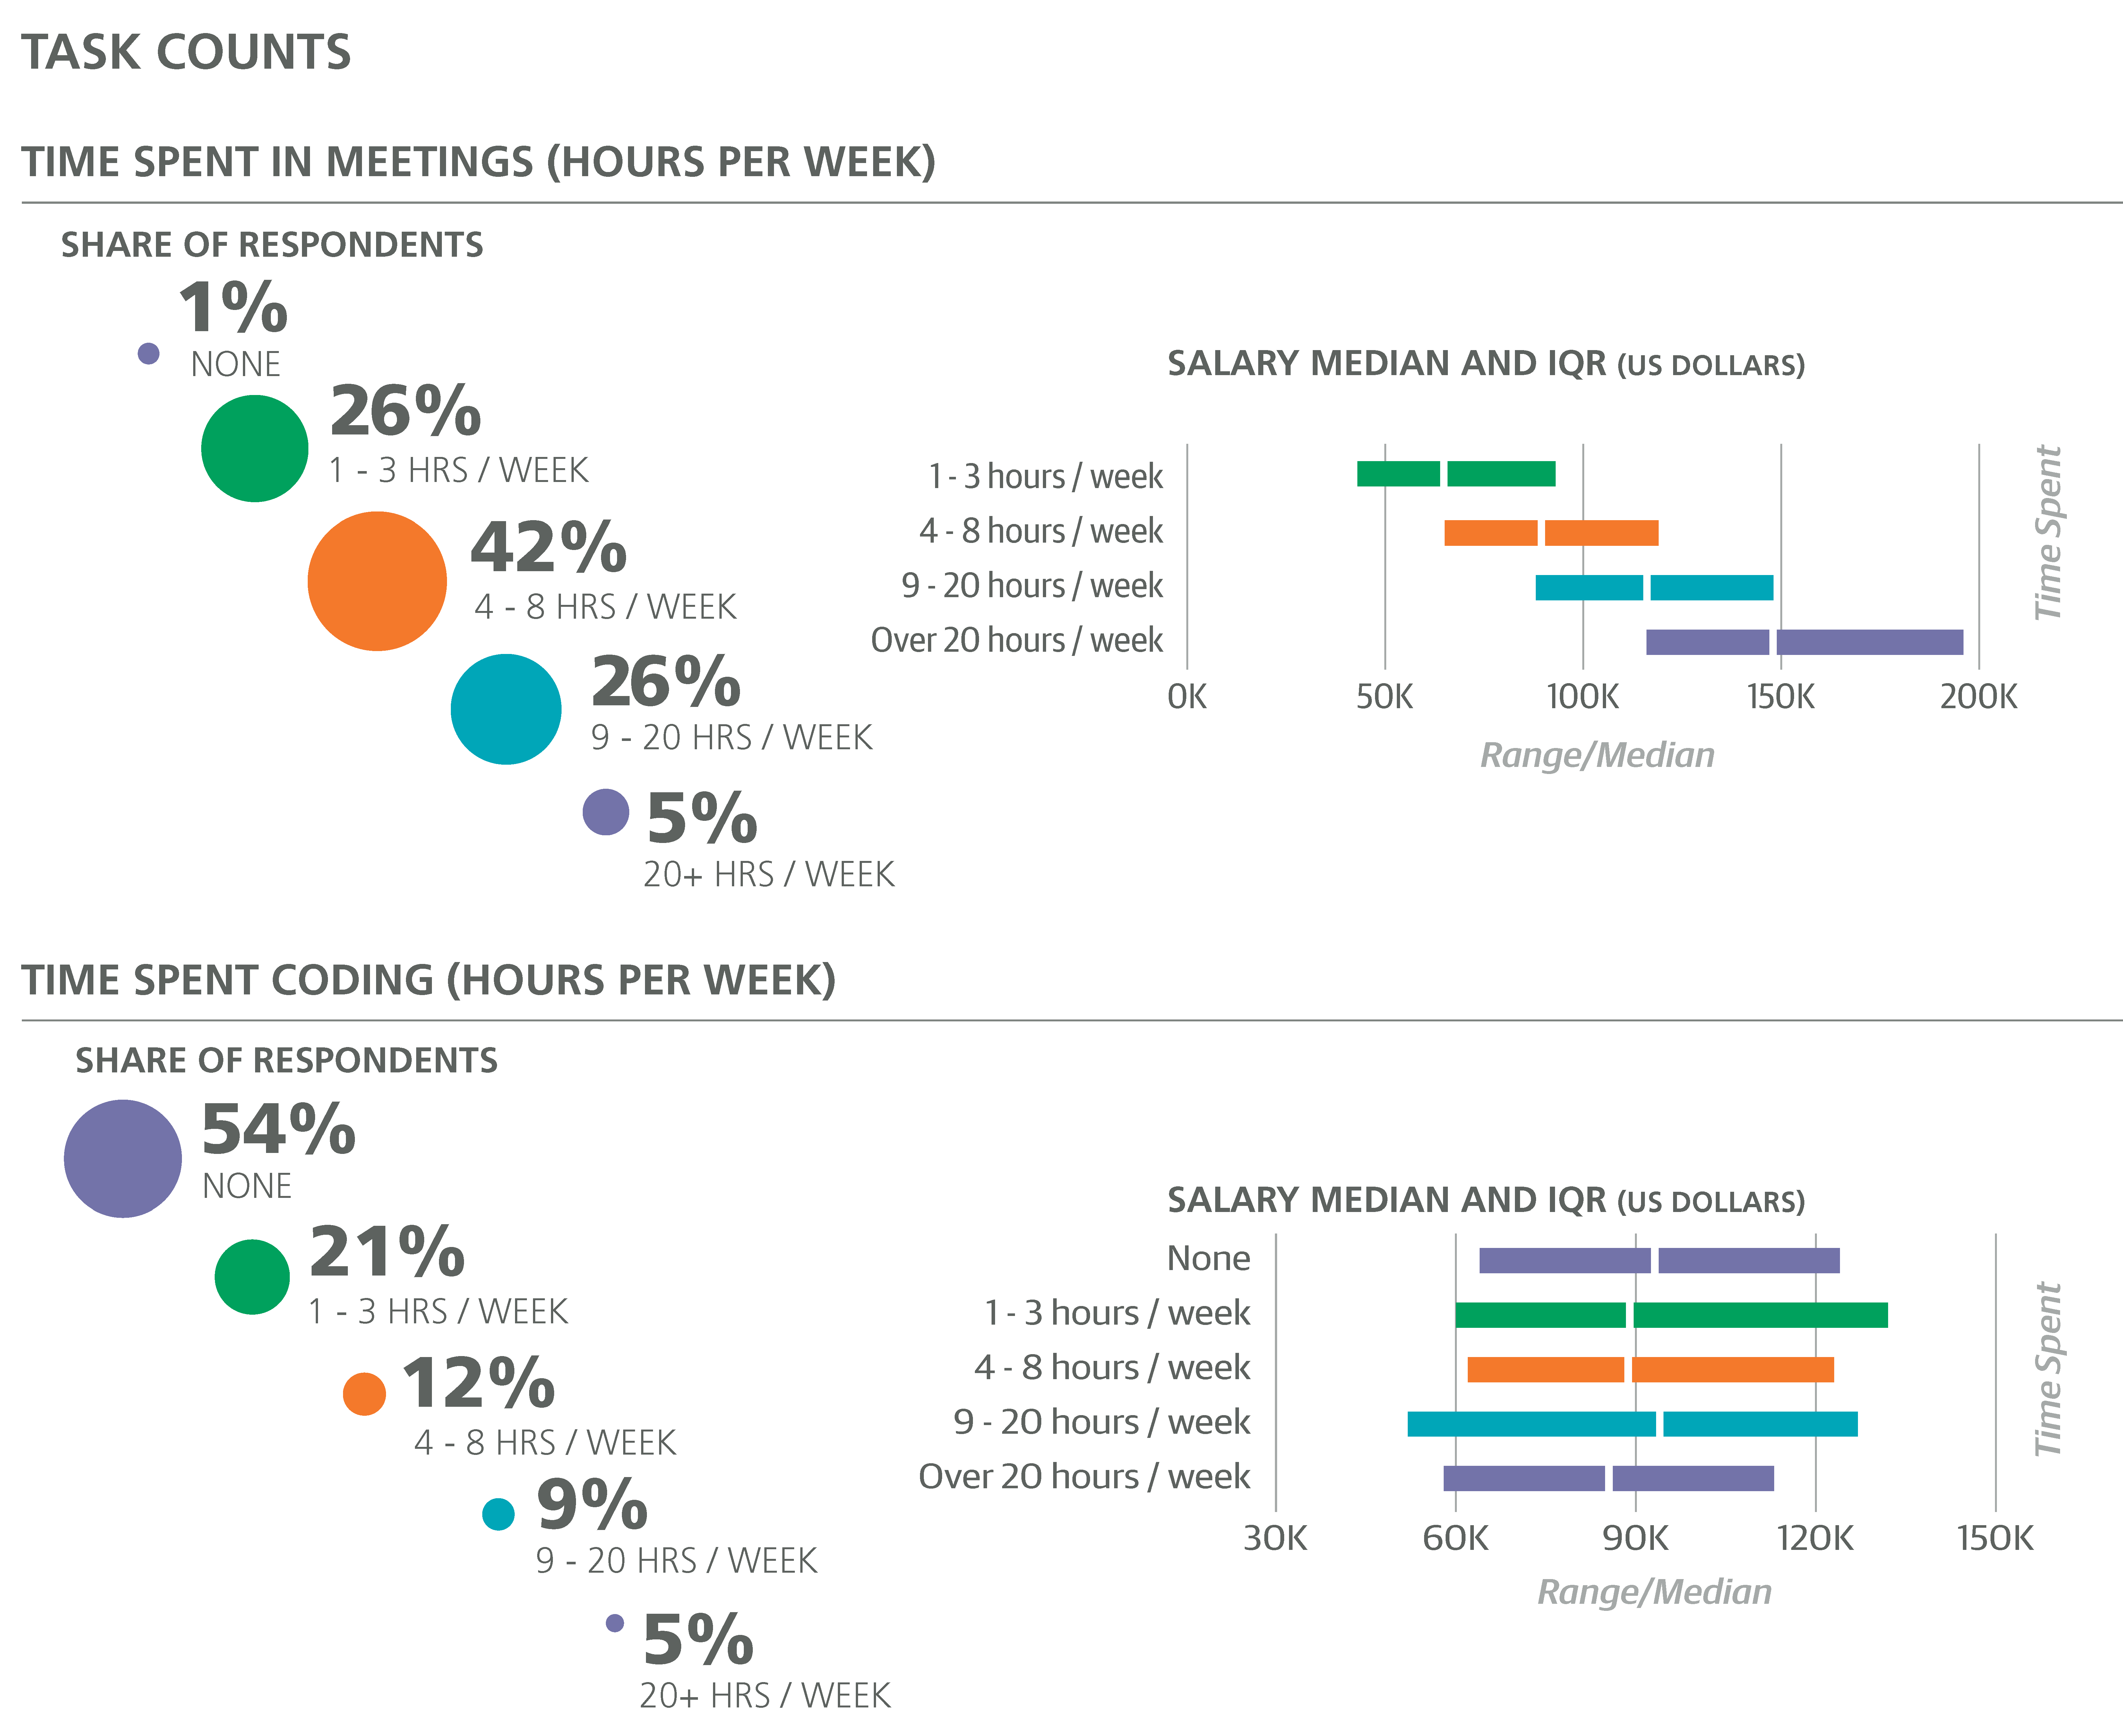
For two very general tasks—“coding” and “meetings”—we asked for more exact information on how much time is spent on them. More than half of the sample did not code at all (54%) and only 13% coded for more than 8 hours per week. There was no clear, simple trend in salary as coding hours increased: those in the “no coding” and “9–20 hours / week” groups earned slightly more than the others. If we exclude managers and directors, however, salary does rise steadily as coding hours increase, from a median of $82K for the non-coders to $98K for the 9–20 hours/week group; although, for the few respondents who reported coding more than 20 hours/week, median salary fell back down to $88K. One explanation for the drop: spending too much time coding leaves less time for long meetings.
The correlation between meeting hours and salary is no joke: the quarter of respondents who spend no more than 3 hours in meetings each week had a median salary of $63K, rising to $88K for “4–8 hr/w,” $118K for “9–20 hr/w,” and $148K for “over 20 hr/w.” This seems a good time to remind the reader that these correlations do not imply causation—we do not advise scheduling more meetings under the false pretense of boosting one’s salary! A more reasonable assumption is that roles with more responsibility are associated with not only higher salaries, but more time in meetings.
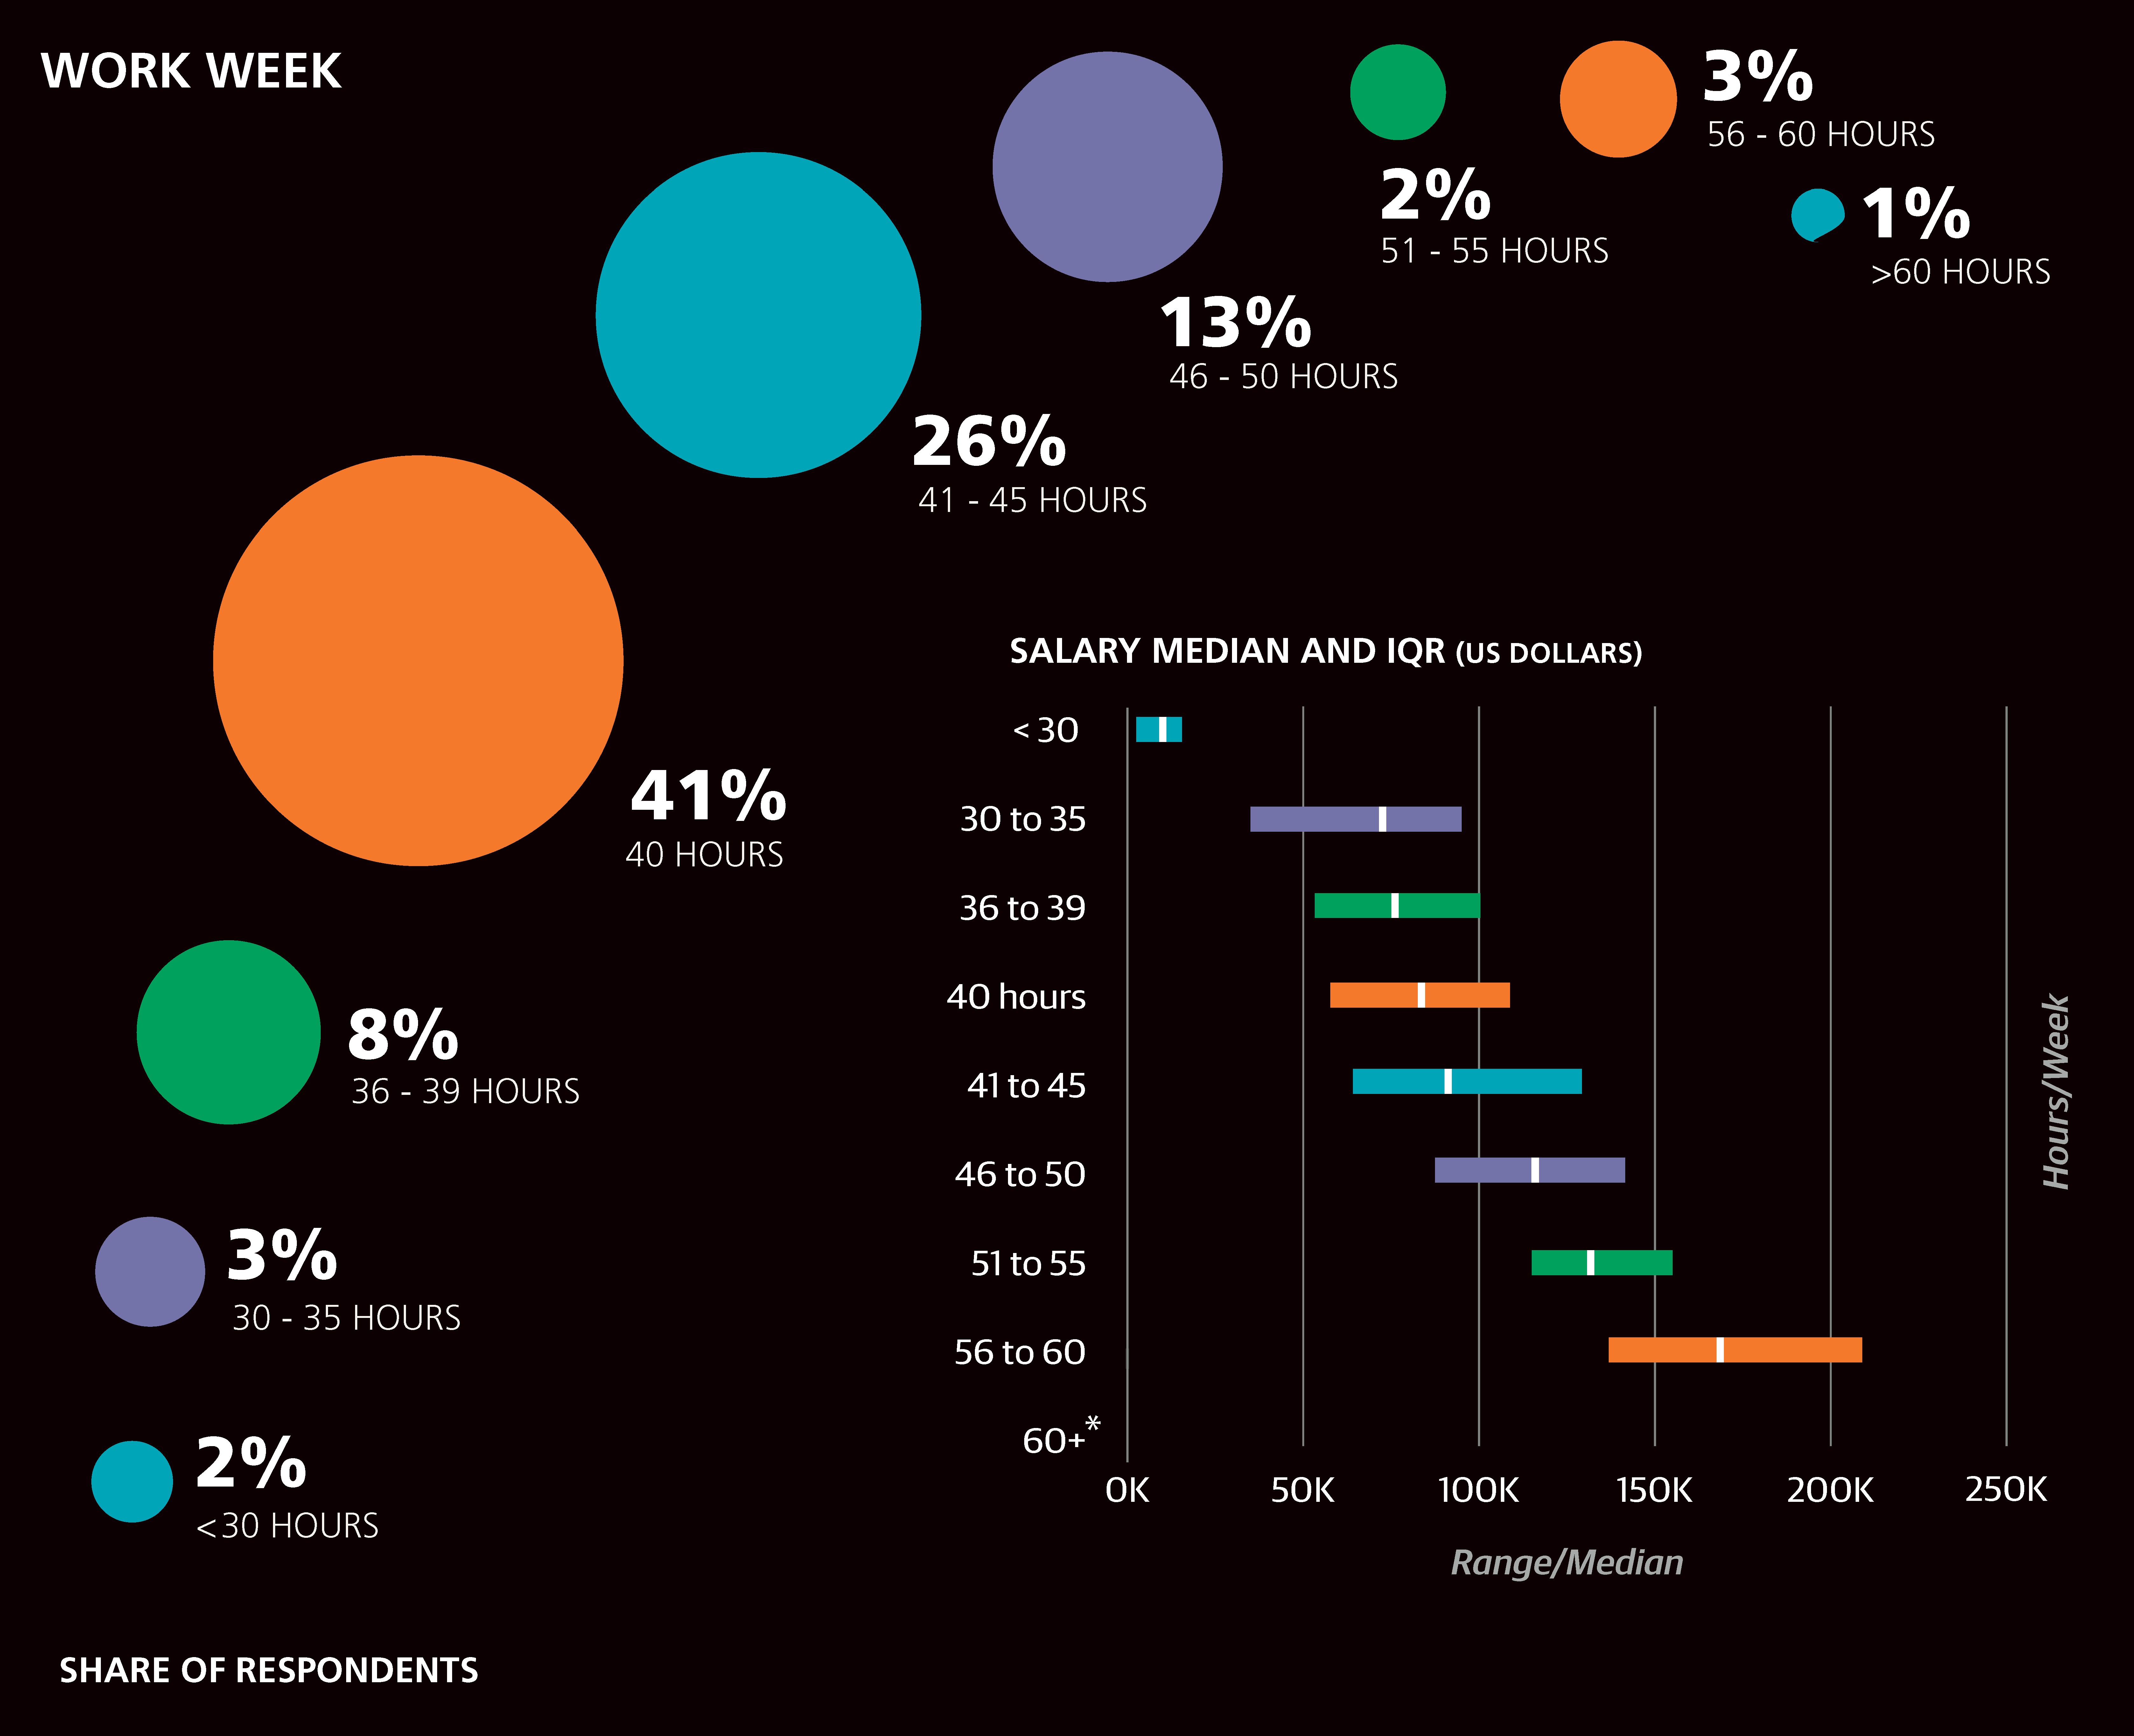
The pattern of more pay for more time in meetings or more time coding may be conflated with the more general pattern correlating longer work weeks with higher salaries. For the small share (13%) of respondents who worked fewer than 40 hours, median salary was only $66K, rising to $82K for those working exactly 40, and to $90K for those working from 41 to 45 hours per week. From here, median salary rose quite rapidly: $120K for the 46- to 50-hour workweek and $155K for those working more than 50 hours per week. As with the demographic variables, we resolve some of the ambiguity as to which variable or variables best predict salary with a linear model (see Model section).
Tools
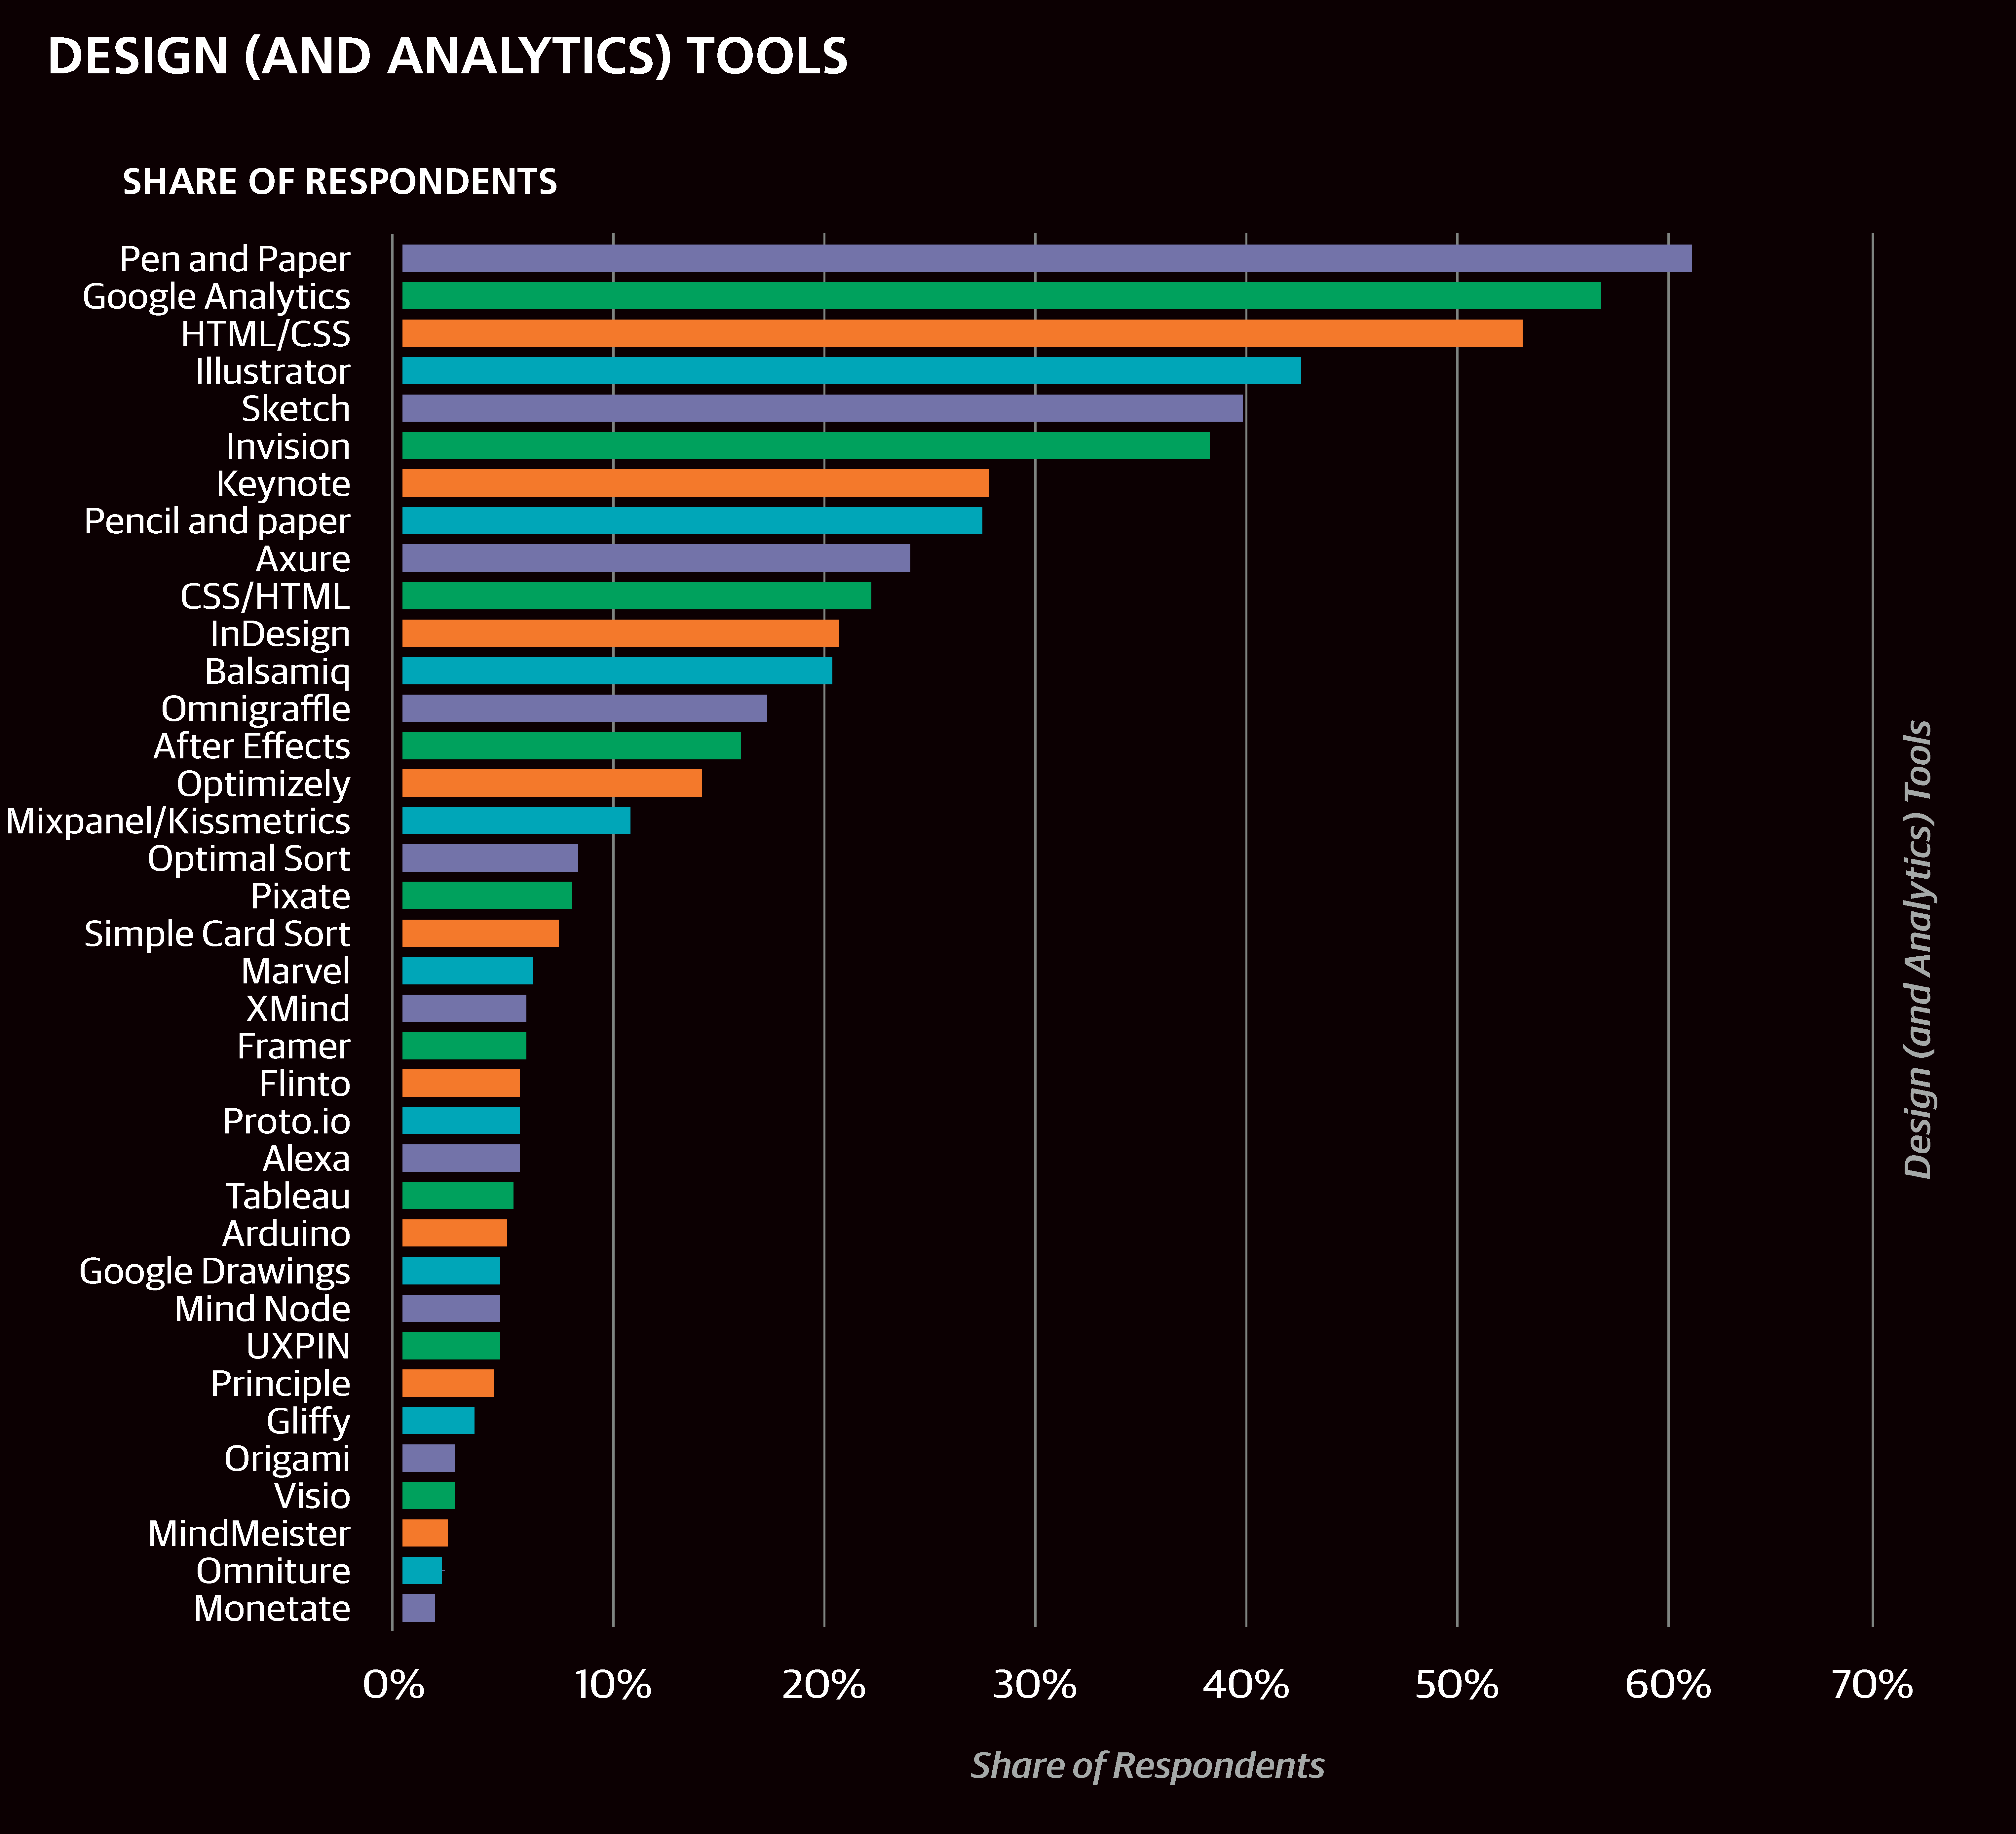
THE SURVEY CONTAINED QUESTIONS IN THE FORM OF “do you use this tool in your current role on a regular basis (about every week)?” for more than 100 tools. Not all tools were specific to design—the list included programming languages, work organization tools, and operating systems—and it wasn’t meant to be exhaustive, with “other” answers available.
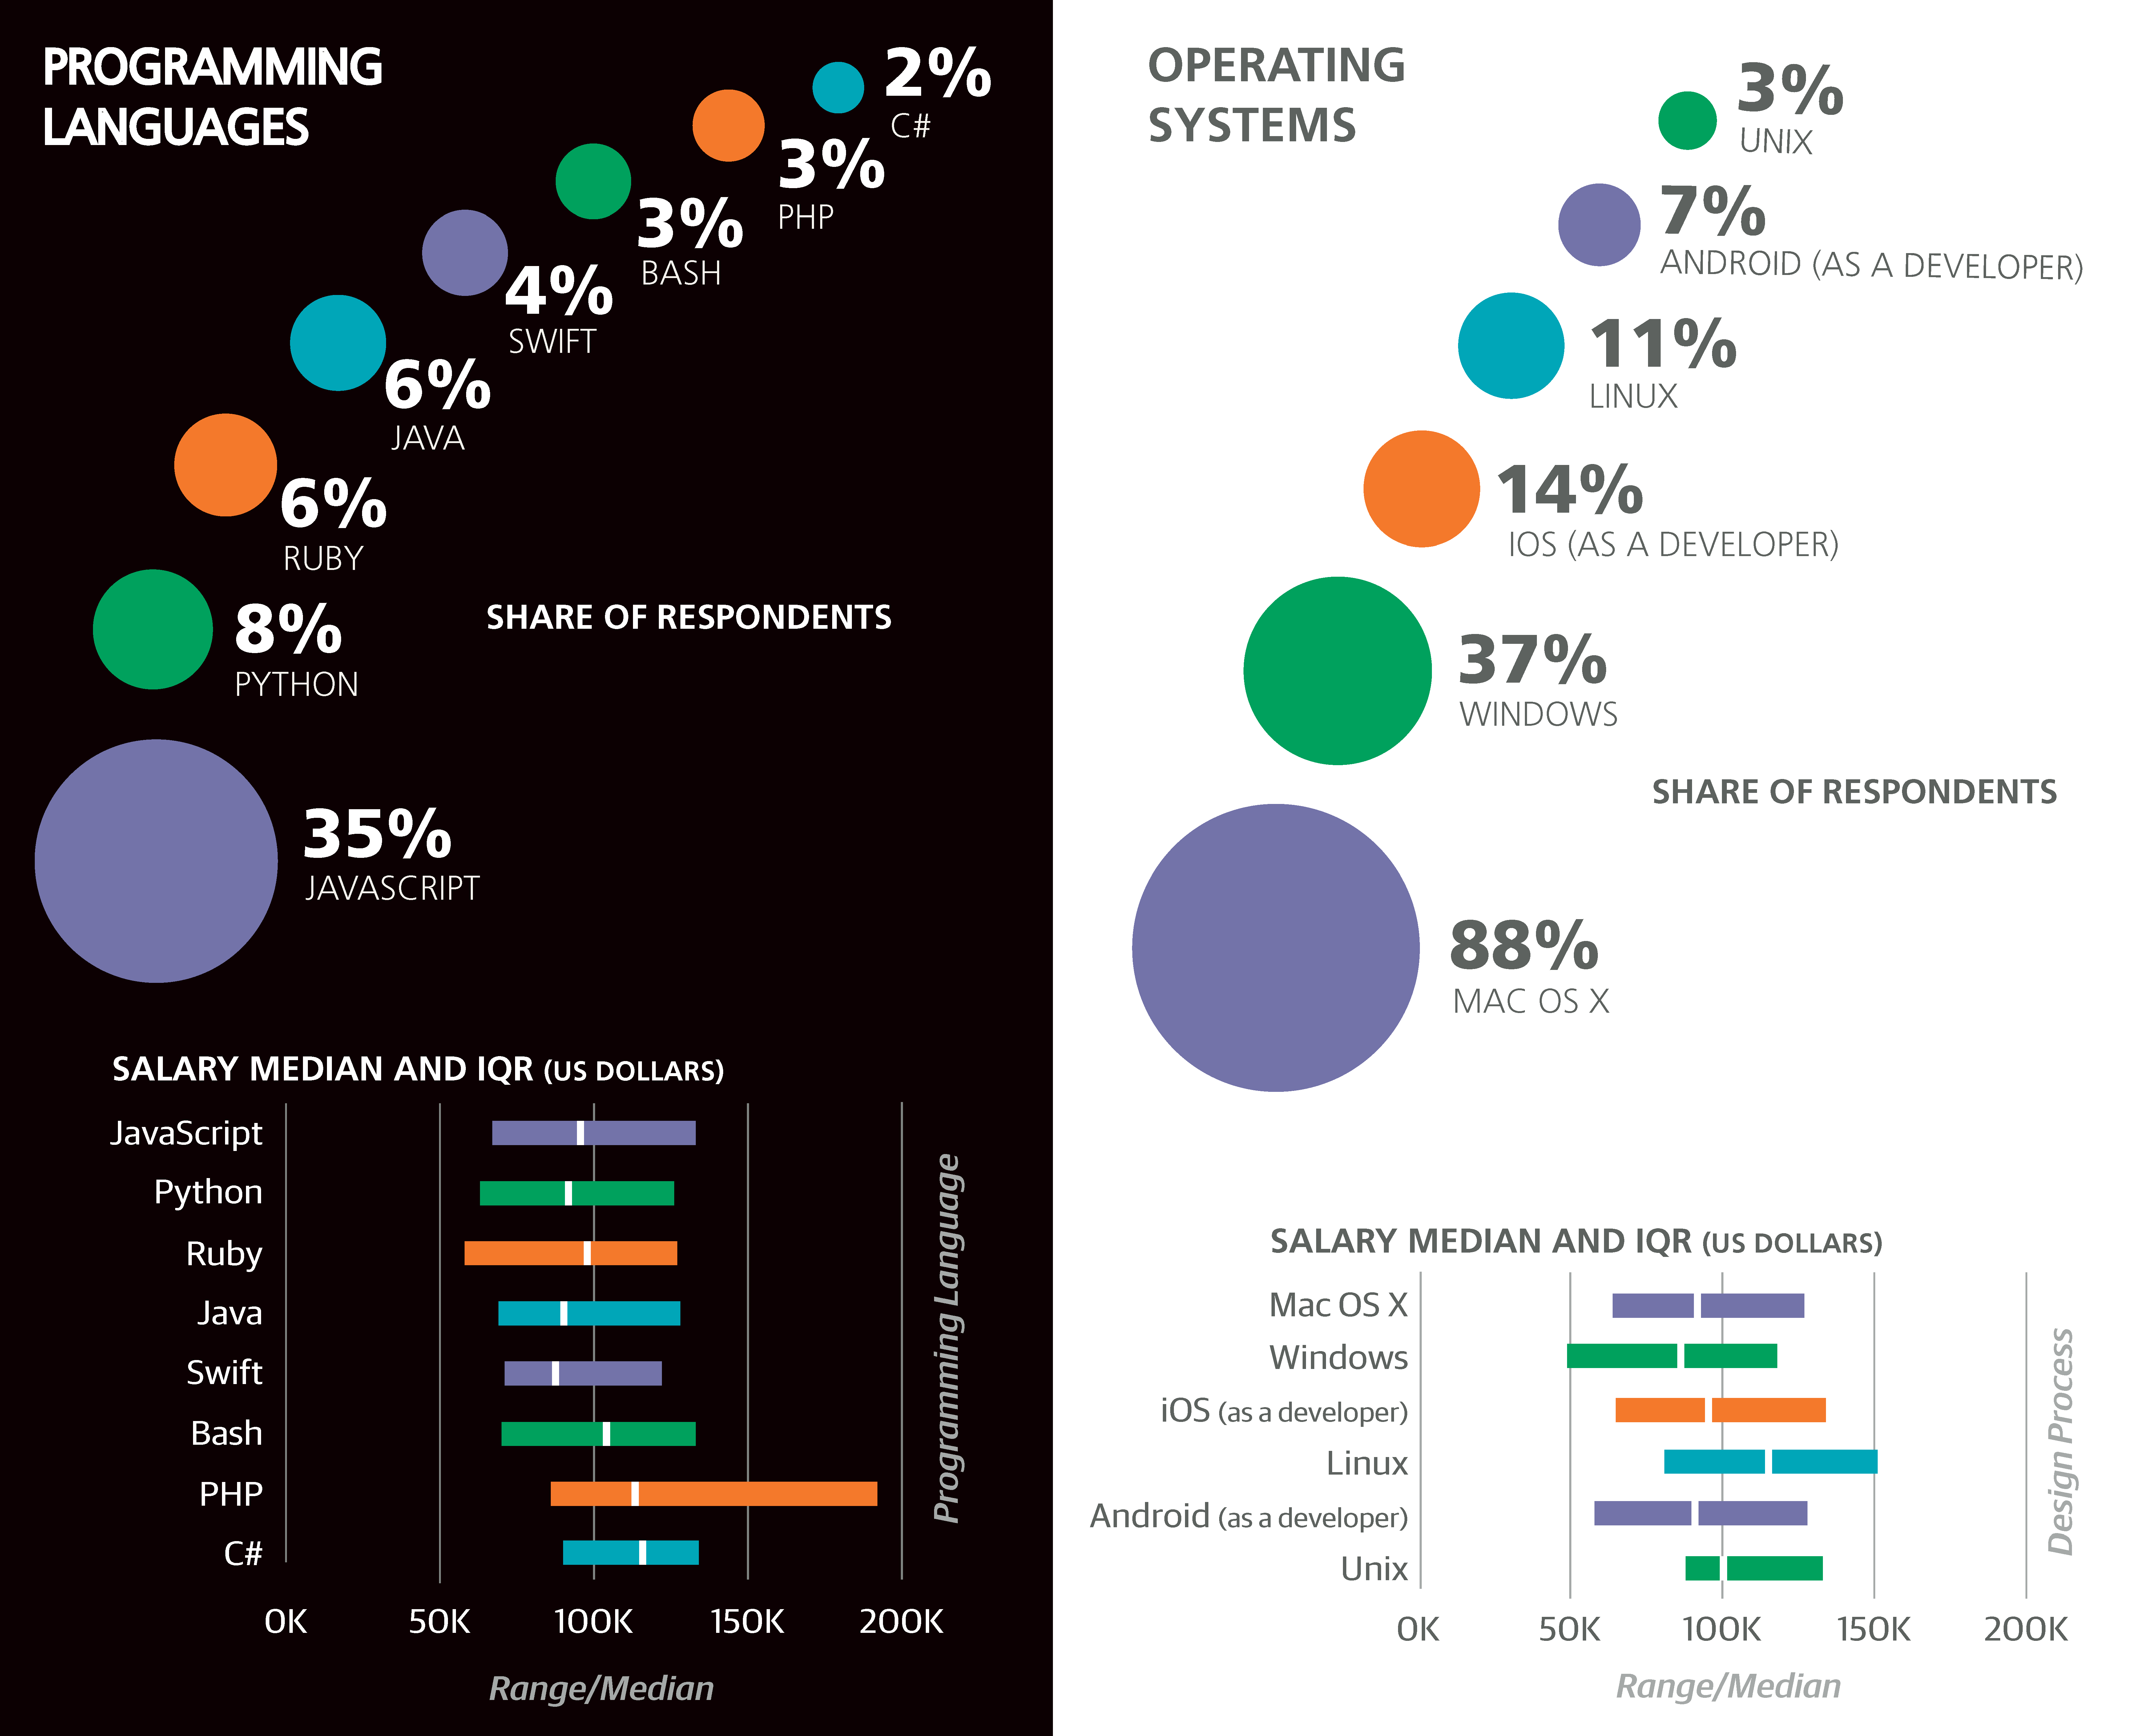
Mac OS X appears to be the clear choice for those in the design space, with 88% of the sample using Macs, far more than the 38% who use Windows and the 12% who use Linux. Windows users earned less than Mac users: among those who used one (but not both) of these operating systems, Mac users had a median salary of $95K and Windows users had a salary of $78K, while those who used both had a median salary of $88K.
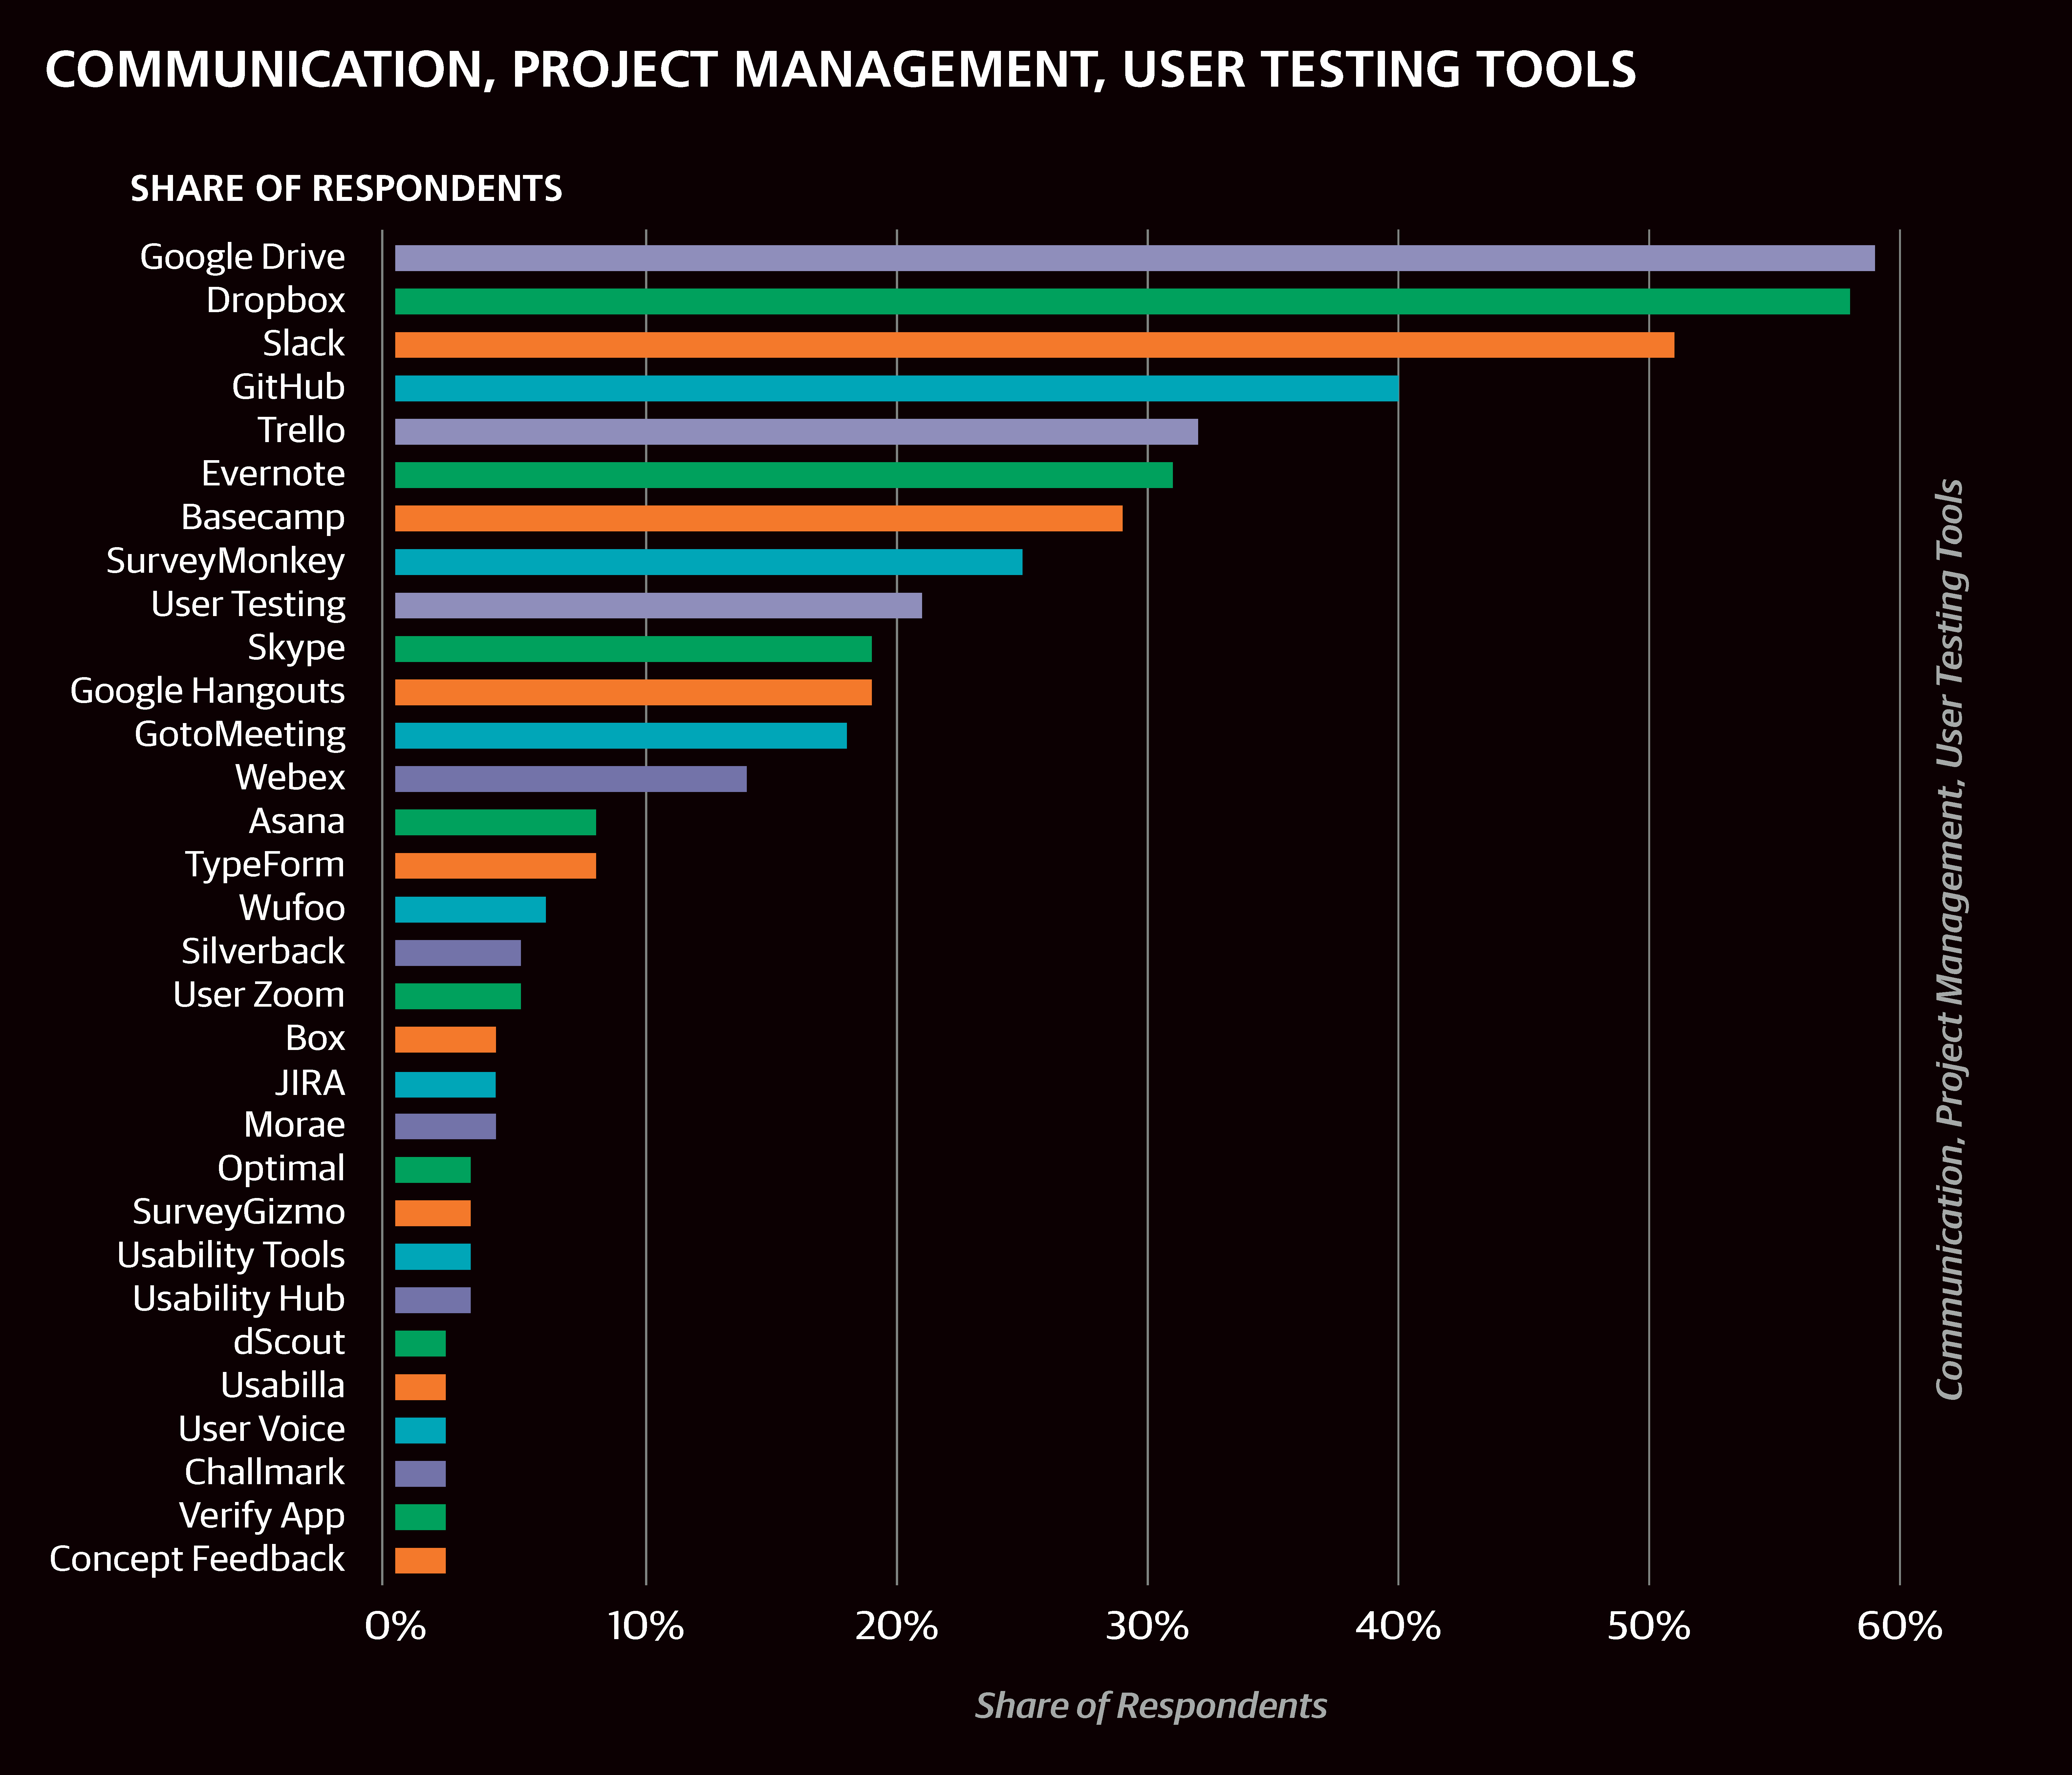
Many of the tools we asked about are for communications, file sharing, or project management. Among the most common are Google Drive (59%), Dropbox (58%), Slack (51%), GitHub (40%), Trello (32%), Evernote (32%), and Basecamp (29%). Of these tools, Slack, GitHub, and Evernote were notable for the higher salaries of their users: the median salary of respondents who used at least one of these tools (69% of the sample) was $100K, $108K for those who used all three (12%), and only $76K for those who did not use any (32%).
Aside from operating systems and communications tools, the most commonly used tool in the sample was pen and paper (with 61% of the sample), followed by Google Analytics (57%) and HTML/CSS (53%). It is perhaps a little surprising that the top non-OS software used among designers is for analytics— remember that analytics was the task with fewest respondents reporting major involvement—but this might be because there is less in-depth attention to or focus on analytics that would lead to greater tool specialization or experimentation. Or else, Google Analytics just works very well for designers.
We found respondents using three dominant tools: Adobe Illustrator (43%), Bohemian Coding’s Sketch (40%), and InVision (38%). Most Sketch users, 63%, also use InVision. The latter two positively correlated: 63% of respondents who used Sketch also used InVision, while only 24% of respondents who did not use Sketch did use InVision. There was no significant correlation between either of these two and Illustrator: someone who used one was no more or less likely to use the other. However, if we consider only those with “UX,” “UI,” “UI/UX,” “Designer,” or “Graphic Designer” job titles, Sketch and Illustrator negatively correlate; that is, most UX designers tend to use one but not both (the change is caused by the large share of non-UX designers who use neither). The same is true for InVision and Illustrator. An even clearer division emerges when we start to look at how these three correlate with other tools.
Aside from InVision, design/analytics tools that correlated with Sketch—more precisely, tools that were used by a significantly greater share of respondents who used Sketch than those who did not—included Google Analytics, Keynote, Optimizely, Mixpanel/Kissmetrics, Pixate, Marvel, Framer, Flinto, Proto.io, and Tableau (among others). Most of these tools also correlated with InVision (but not quite as strongly as with Sketch), and the few that also correlated with Illustrator— Keynote, Flinto, and Proto.io—did so to a much lesser degree. In fact, in the network of usage correlation between all tools, Sketch becomes the most dominant “hub”: many tools correlate with it (chief among them InVision), and for many tools, it is the best-correlated (or most well-connected) neighbor. Among tools outside of the design/analytics category, Slack correlated highly with Sketch (as well as with InVision and other associated tools listed above).
In contrast, the only design tools that gravitated to Illustrator are two other Adobe products, InDesign and After Effects: this is a vendor-based stack silo. More generally, respondents in this stack tended to use fewer tools: the average number of tools (of any type) used by respondents who use Illustrator (but not Sketch) was 12, while for those who use Sketch (but not Illustrator), the average number of tools used was 16. When we identify tool stack silos like this, there is always a degree of uncertainty in the interpretation of why it arose without further study: for example, it could arise because there are compatibility issues, or because those who use this stack don’t need other tools (all their use cases are satisfied since the tools are effectively generalized). As usual, we should note that there is a difference in salaries between the two groups: users of Illustrator had a median salary of $87K; users of Sketch had a median salary of $101K; and users of InVision had a median salary of $96K.
The final group of tools on the survey were programming languages. JavaScript was by far the most popular language (35%, median salary $95K), followed by Python (8%, $90K), Ruby (6%, $98K), Java (6%, $88K), and Swift (4%, $85K). There were no major correlations between particular programming languages and design tools; if we include programming languages in the clustering schema above, they would just form their own cluster. Swift has a stronger connection with iOS, as we would expect, but with Android as well, indicating that the extent to which these two major mobile platforms require specialization among mobile designers is limited.
Model
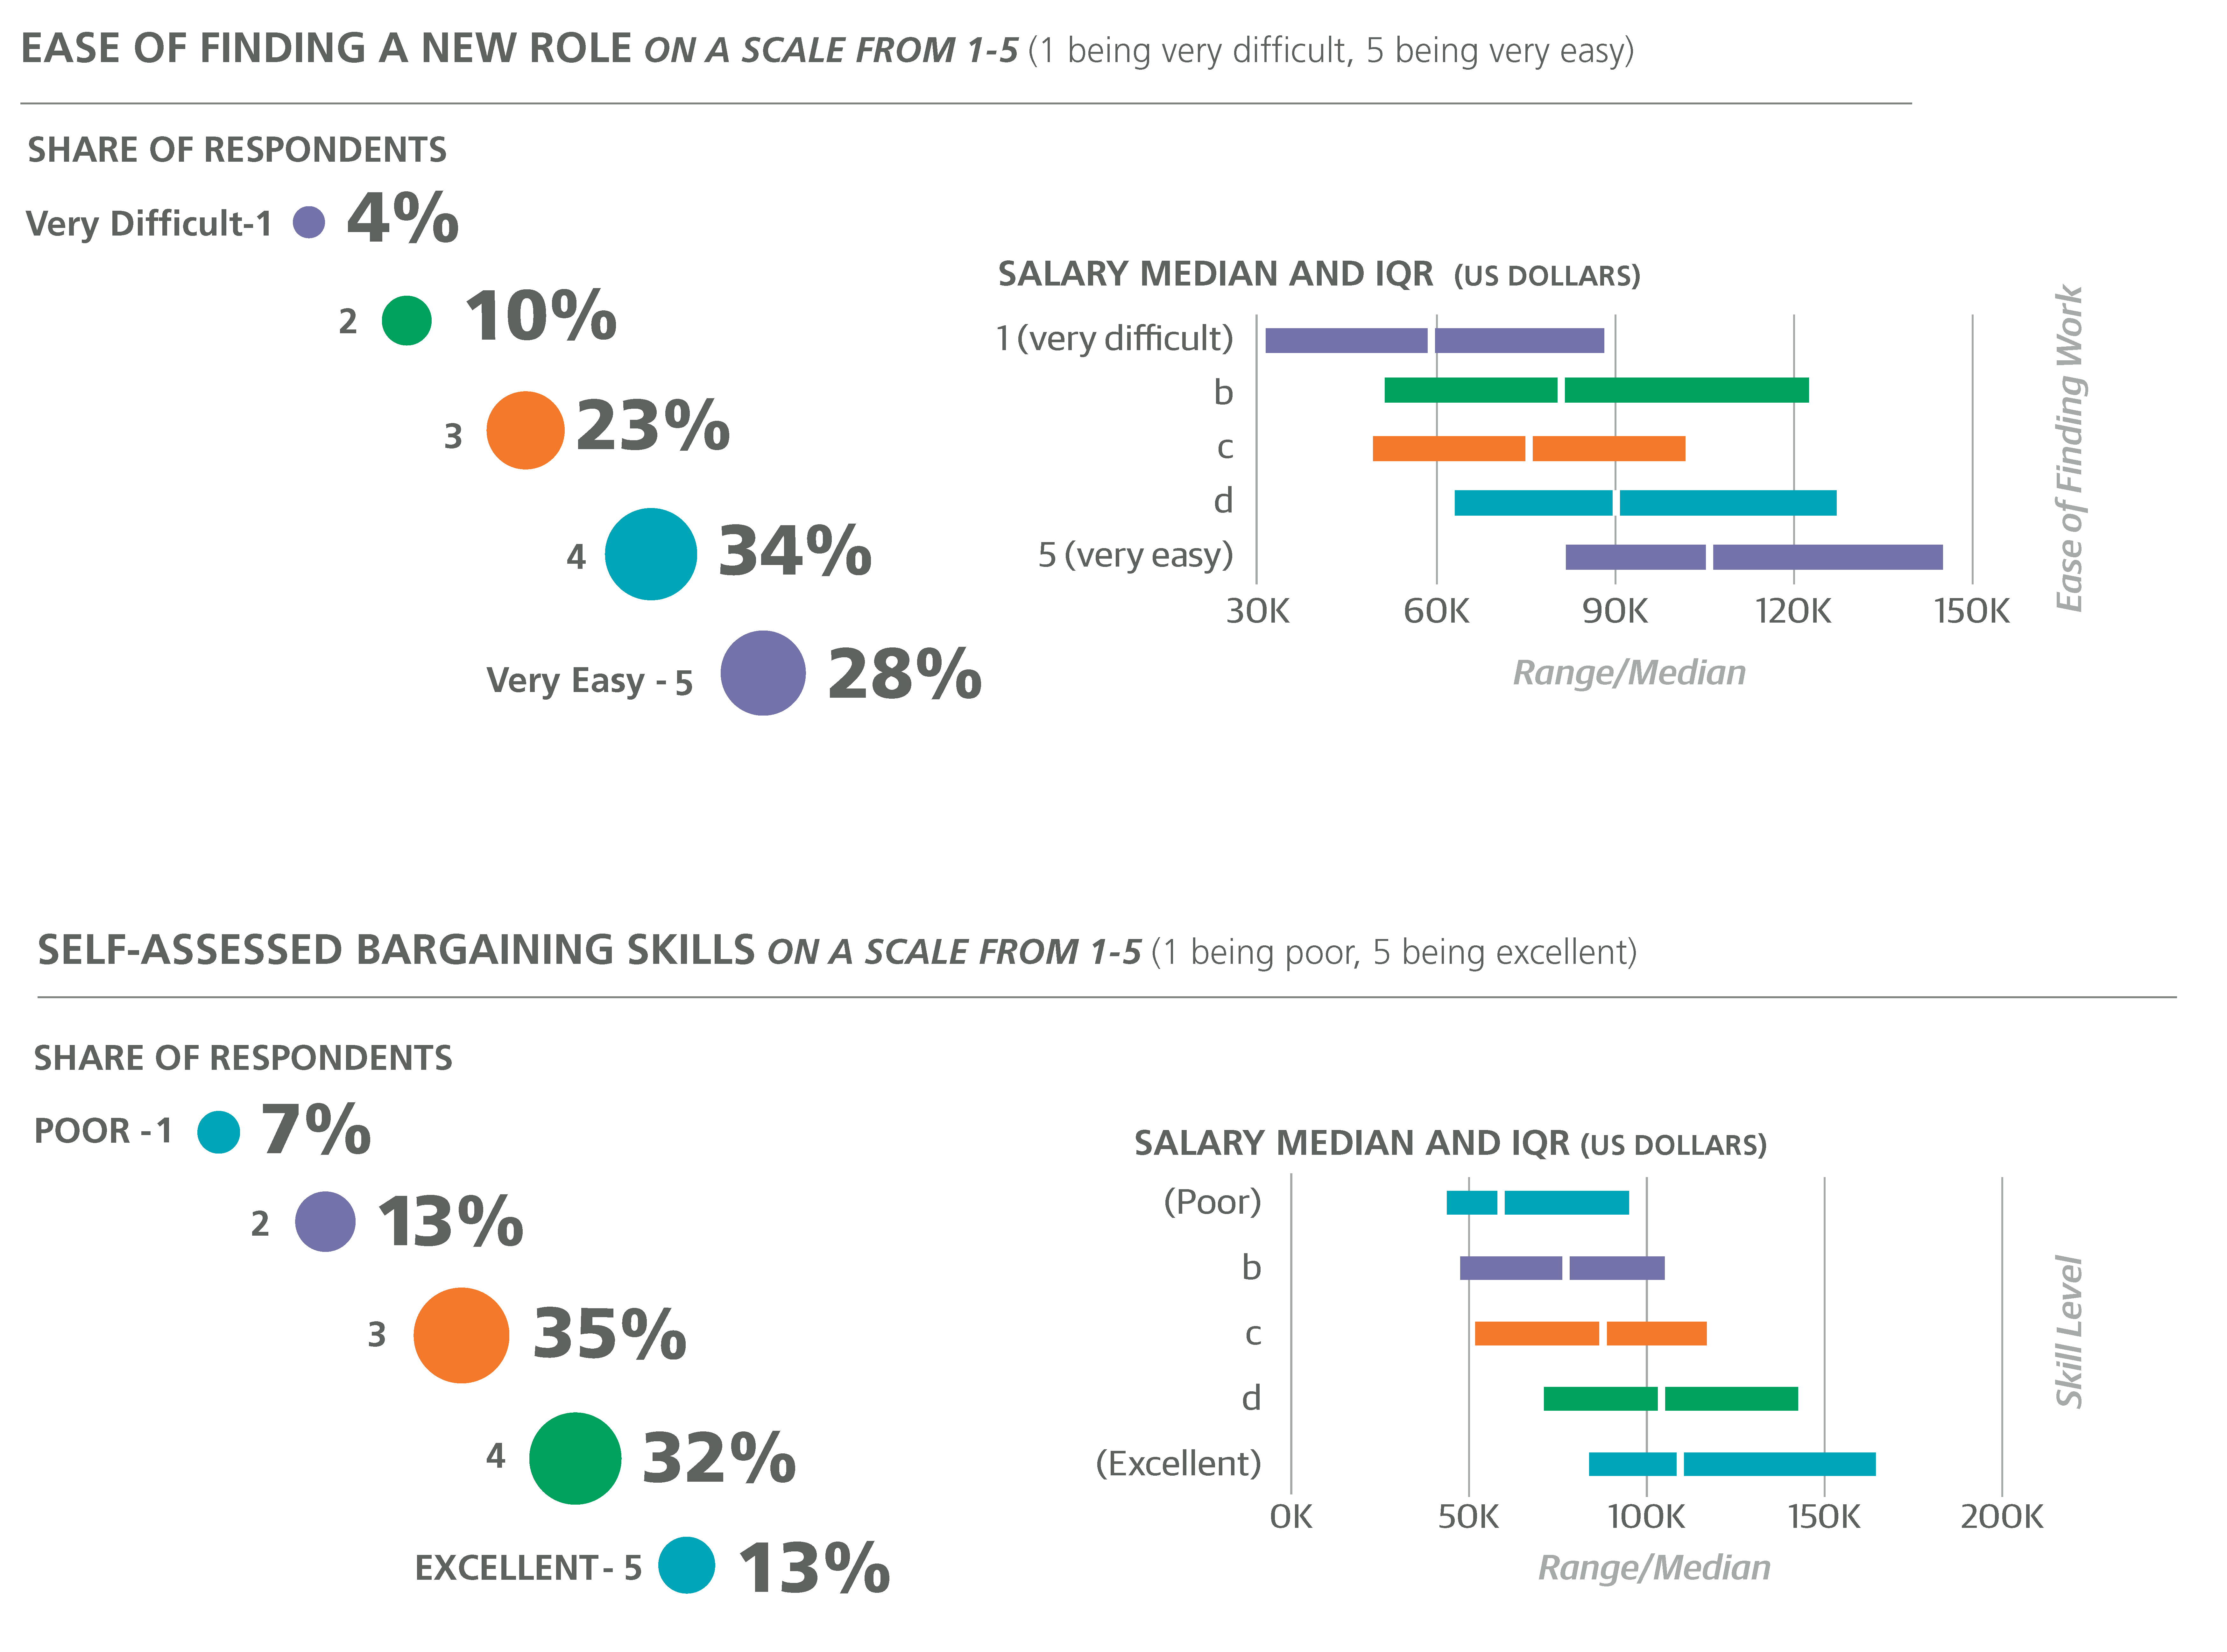
IN ADDITION TO THE DEMOGRAPHIC, company/team, tasks, and tools variables used to create the linear model, we include two additional variables: bargaining skills and employability. In both cases, respondents are prompted to self-evaluate their skill based on a 1 (poor) to 5 (excellent) scale. We know the results are likely subjective and imprecise (for example, bargaining skills are difficult to quantify and likely inconsistent) but we think the results and model would suffer if we ignore the topic. It seems fairly clear, for example, that if someone routinely accepts lowball offers without putting up any fight, they will earn less than someone who bargains more aggressively (even if they are just as talented, experienced, and hardworking as the latter). Most respondents (66%) self-reported a bargaining score of 3 or 4, with 12% reporting a score of 5. Unsurprisingly, each bargaining “point” corresponded to a higher salary.
The other question, also on a five-point scale, was the ease of finding a new position, assuming “that the new job is more or less equivalent to your current one, in terms of compensation, workload, and your interest in the work.” Again, this is highly hypothetical and subjective, but is similarly hard to ignore.
If someone knows (and crucially, if their employer knows) that they could walk out today from their at-will employment and find equivalent work elsewhere, the employer is likely to be willing to pay more. In this sense, ease of finding work is a predictor of salary, so we introduced it into the model. However, it should be noted that this variable could also be considered a dependent variable that we could try to predict with other variables (i.e., alongside salary, not “below” it).
Now, for the model.1 From the 65 questions, we extracted 202 variables (multiple-choice questions usually have almost as many variables as there are answer choices), and from the available variables, the algorithm selected the most significant. The algorithm favors a model with a smaller number of variables (to keep the model simpler) and assigns a coefficient (a positive or negative number) to each. To get your salary estimate, start with the constant ($51K), and for each variable that applies to you add (or subtract) the corresponding coefficient (or for years of experience, add the coefficient times the number of years you have worked in your field). Here is the model:
constant (everyone starts with this amount):
+$51,617

country = United States: +$12,257
world region = Europe (except UK/I): –$12,561
US region = California: +$17,390
US region = Northeast: +$2,956
gender = female: –$6,363
per 1 year of experience: +$1,292
academic speciality in mathematics, statistics or
physics: +$1,158
academic specialty in graphic design: –$5,178

title = “Graphic Designer”: –$1,848

industry = education: –$7,522
company size = 1: +$6,403
company size > 1,000: +$1,543
team size = 2: –$6,052
team size = 8 to 20: +$6,661
team size = More than 20: +$12,224
works with product managers: +$7,021
works with programmers: +$3,633
works on services: -$896
tasks: brainstorming = no involvement or minor involvement:
+$1,039
tasks: managing people = major involvement:
+$18,409
tasks: programming = I never perform this task:
–$16,682
tasks: pitching = major involvement: +$3,669
tasks: user research = no involvement: –$1,723
meetings: 9 - 20 hours / week: +$14,168
meetings: over 20 hours / week: +$15,547
work week < 30 hours / week: –$20,963
work week = 30 to 35 hours / week: –$16,834
work week > 55 hours / week: +$23,472

tools: Slack: +$6,378
tools: User Zoom: +$5,403
tools: PHP: +$5,147
tools: Alexa: +$3,661
tools: Keynote: +$3,198
tools: Dropbox: +$1,434
tools: Windows: –$3,740

bargaining skills = 1 or 2: –$1,259
bargaining skills = 4: +$3,288
bargaining skills = 5: +$4,164

ease of finding new work = 1, 2 or 3: –$5,444
This model gives us a more rigorous assessment of how much variables predict salary, allowing us to revisit some of the differences in salary between various groups of respondents. Since the model only includes a subset of the available variables, it shows us which ones are likely to have true correlations with salary and which are more likely to be insignificant (even if they might correlate with the significant ones).
The gap in salary between the US and Europe is reduced to +$25K (UK/Ireland and Canada are in between), but the coefficient for California is still quite large at +$17K. Aside from this and the +$3K value for the Northeast (from NY/NJ), no US region was significant enough to be kept in the model (so the large salaries in the Mid-Atlantic appear to have been somewhat of an accident).
The gender gap was reduced to –$6,403, although this doesn’t really make the previously observed $14K difference any better. In some ways, it makes it worse since the model is telling us that if we keep everything else constant—experience, skills, role—a woman will likely earn $6K less than a man.
One variable that is conspicuously absent is age, which seems to be completely replaced by other variables, most notably years of experience. For each year of experience, UX designers are predicted to gain $1,292: a rather modest raise, although this would be on top of expected salary changes from other variables (e.g., new tools or different tasks).
Education remained an important feature, the academic backgrounds of math/stats/physics giving a +$1,158 increase and graphic design a –$5,178 decrease. The further penalty of –$1,848 for “Graphic Designer” as a title means that if there are two people who both do graphic design, one called “Graphic Designer” and one called something else, the former will be expected to earn almost $2K less than the latter. The lack of other nonzero coefficients for title variables means that with the exception of “graphic designer,” salary is not based on what you are called but rather what you do.
For industry, company size, and team size there were few differences suggested by the model from the single-variable salary comparisons observed above. The only industry variable kept in the model is education (–$7,522); hardware/computers did not make it into the model. The boost in salary for large company employees is (only) +$1,543, while at the other end of the company size scale, self-employed respondents (i.e., company size = 1) had a large, positive coefficient of +$12,455.
The correlation between team size and salary that we noted earlier is made clear in the model: those with a team size of at least 8 earned $6,661 more than smaller teams; those with a team larger than 20 people earned an additional $5,263; and teams of only 1 or 2 people had a further penalty of –$6,052. The latter penalty also explains part of why the single-personcompany coefficient is so high: the negative effect of having a small team does not apply to them, so the negative, small-team coefficient needs to be cancelled out. Not only did larger teams predict a larger salary, but working with people in certain roles—namely, product managers and programmers— had positive effects on salary (+$7,021 and +$3,633, respectively).
As we would expect, managing people (major involvement) is accompanied with a large boost in salary: +$18,409. Almost as significant, however, is programming: those who do not program at all are expected to earn $16,682 less, according to the model. Major involvement (versus minor) does not change the salary prediction. While this does not mean that if you learn how to program you are guaranteed $16K more, the possibility that there is some causative aspect in this relationship (which seems somewhat intuitive) should be enough to motivate some UX designers to learn how to code (at least a little).
Given the huge discrepancies between median salaries of groups split by meeting hours, it is no surprise to see similarly large coefficients in the model. A ray of hope (for those of us who are not overly fond of spending half the day on the phone) might be found in the fact that while spending at least 9 hours/week in meetings bumps predicted salary up by $14,168, spending more than 20 hours/week gives only an additional $1,379. Workweek hours were also associated with large coefficients: +$23,472 for more than 55 hours; –$16,834 for less than 35 (and a further $4,129 for a workweek less than 30 hours).
None of the major design-specific tools were present in the model, although Slack is (+$6,378) and, as previously noted, it is highly correlated to Sketch. Aside from Keynote (+$3,198) and Dropbox (+$1,434), the only tools with high positive coefficients were tools each used by less than 6% of the sample: User Zoom (+$5,403), PHP (+$5,147), and Alexa (+$3,661). One tool had a negative coefficient: Windows (–$3,740).
The two self-evaluating scores gave the last coefficients. For each point (out of five) for one’s bargaining skills, predicted salary increases by about $1K. (This seems like a low estimate, but then again, it’s an average, and perhaps it doesn’t matter very much for some people in certain situations.) Those who would not rate their ease of finding new work higher than a 3 (out of 5) are penalized –$5,444.
Even after numbers are plugged in, there is still a fair amount of error in the estimation by this model. Among new data points—such as yours, if you are in the mood for a little math—half should be within $20K of the estimate, and three-quarters within $30K, but some larger outliers can be expected. Of course, there are many factors, some impossible to accurately assess in a survey, much less an anonymous one, that will undoubtedly have important effects on salary and throw off the estimate, but on average this model should be more or less correct.
1We used the Affinity Propagation algorithm in Scikit-learn toperform linear regression with cross validation and the lasso, and arrived at a model that includes 40 variables (and an intercept). The model has an R2 of .43: about 43% of the variation in salaries was explained.
Other Compensation
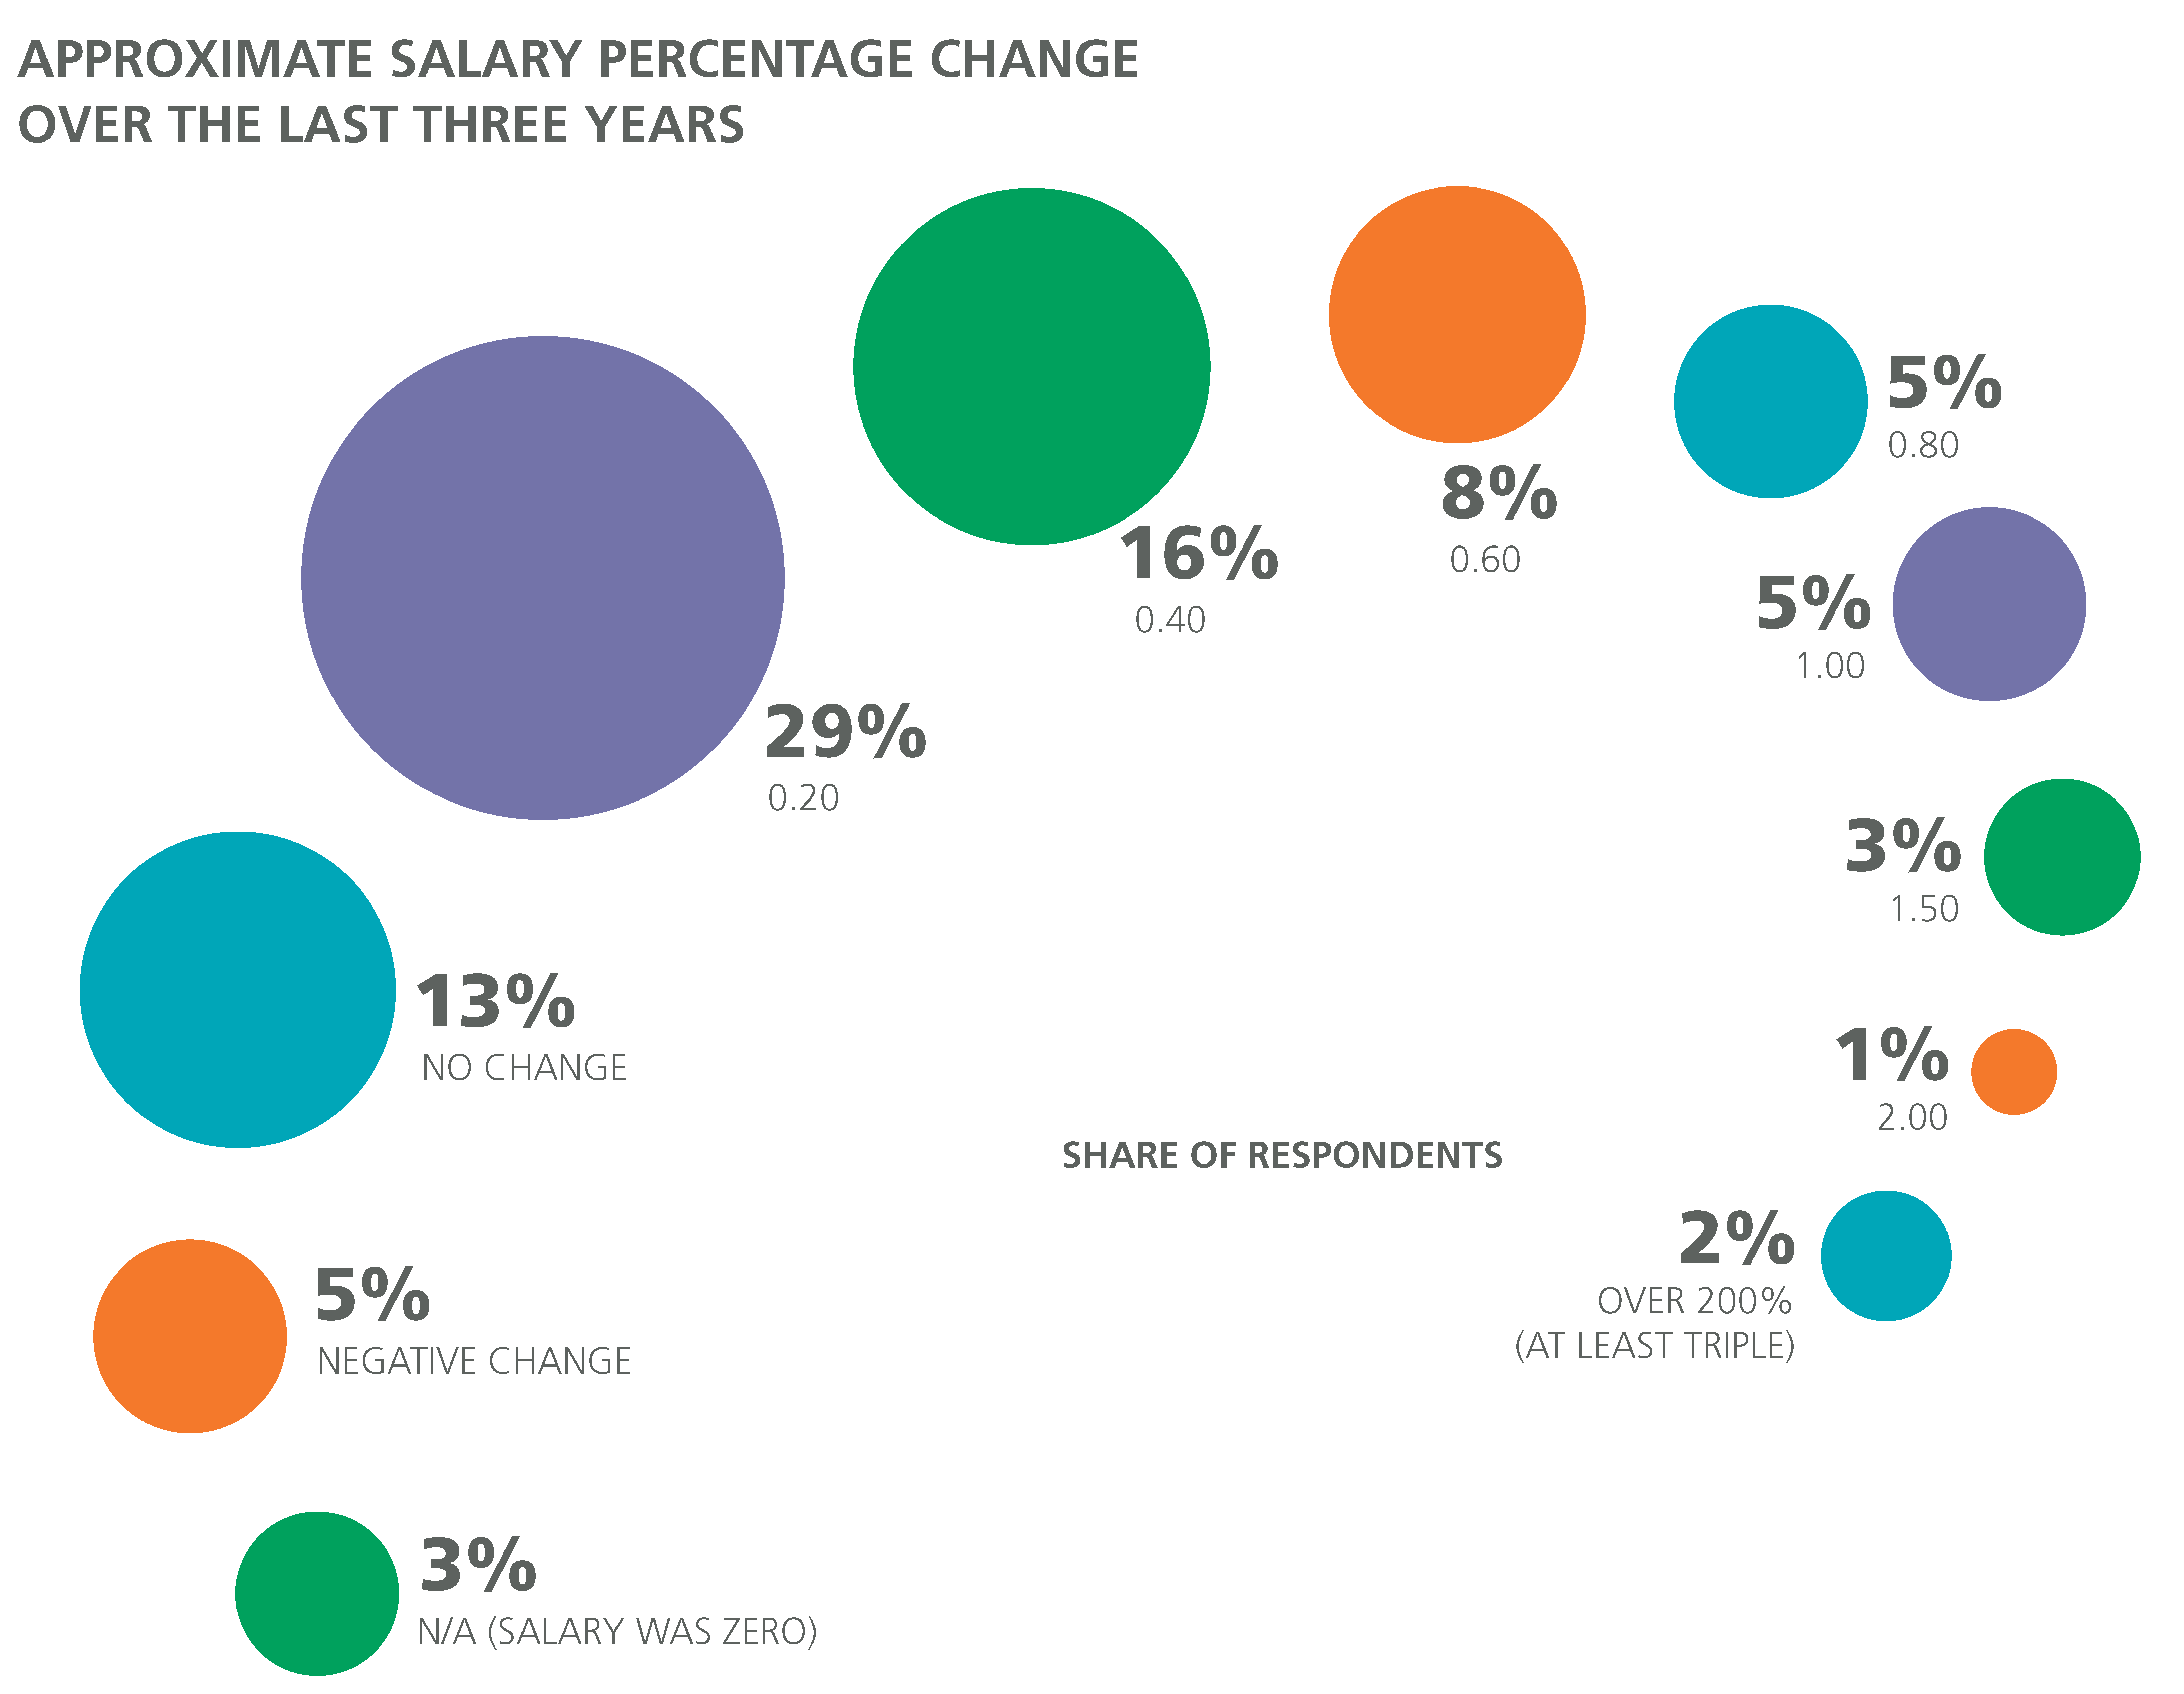
Salary is not static, nor is it the only important part of one’s compensation. Respondents were asked to report the change in their salary over the last three years: 83% reported some positive change, 49% reported a gain of at least $20K, and 9% reported a gain of at least $60K. As a percentage of salary (three years ago), the median gain was 22%. Interestingly, the same variables used to estimate salary in the regression model presented earlier did not seem to have much predictive power for either the actual or percentage salary change; the best models we found left more than 90% of the variation in salary growth unexplained.
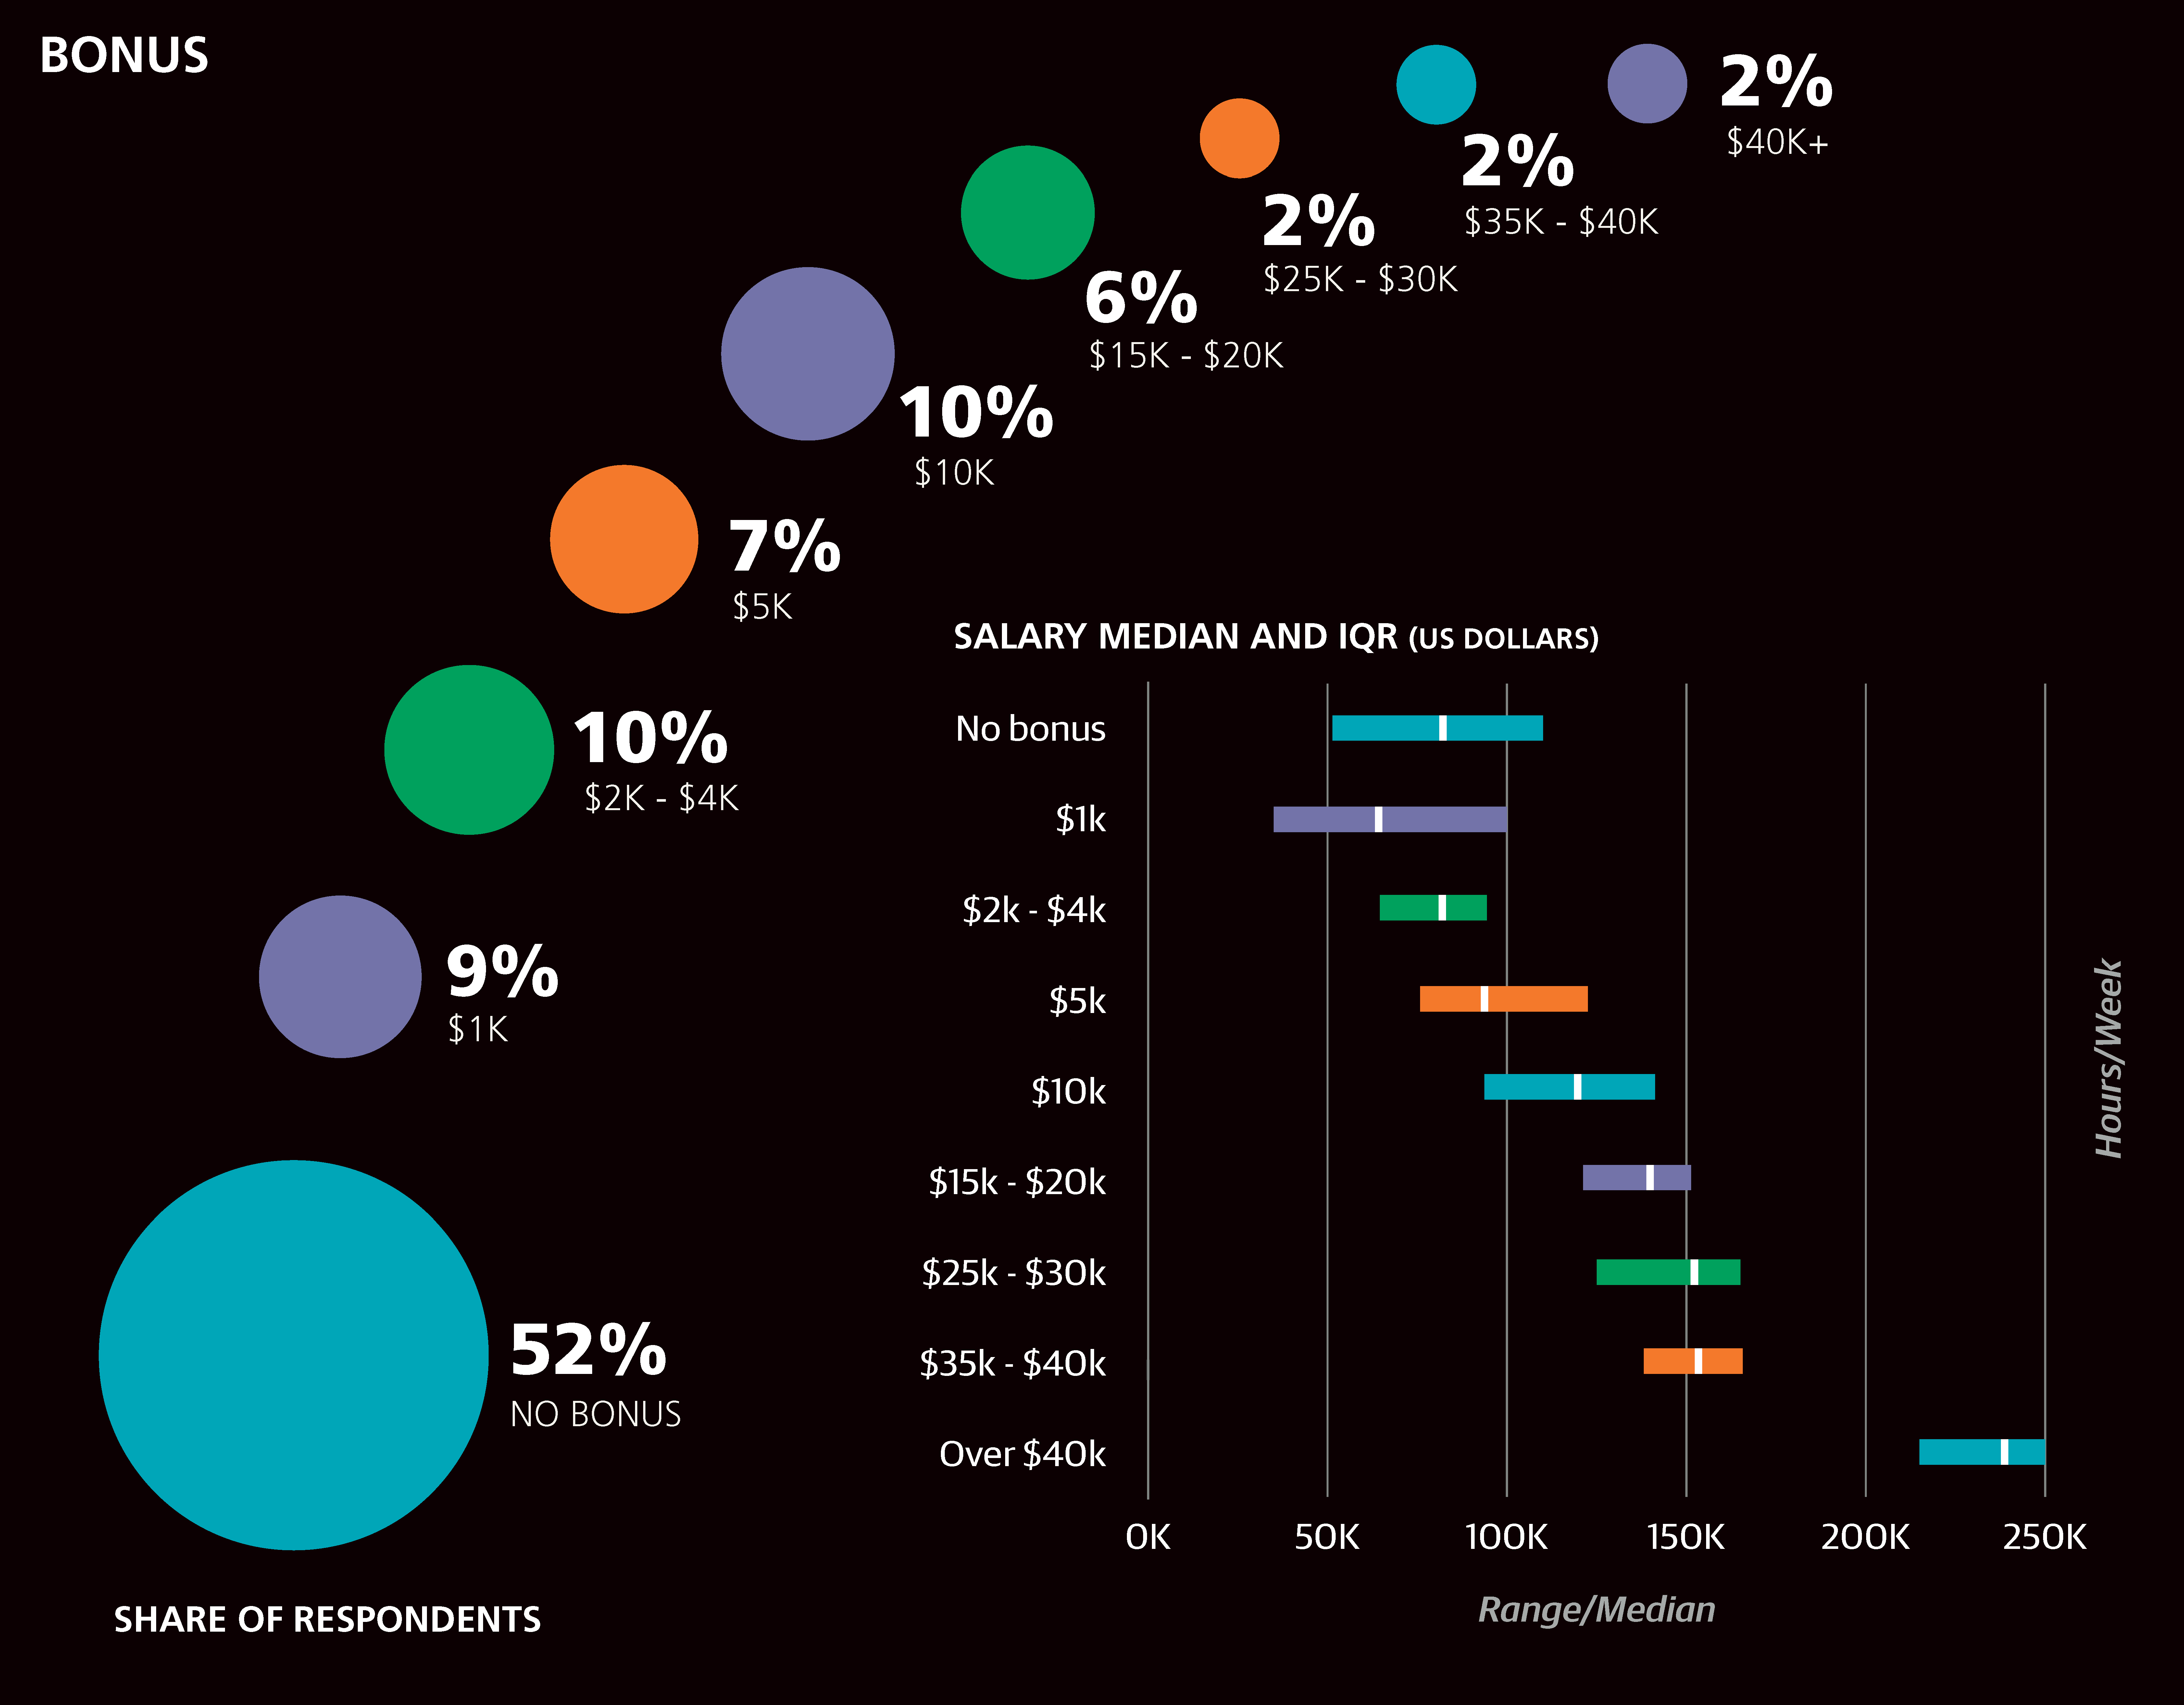
Bonuses were received in the previous 12 months by about half of the sample, with 19% receiving a bonus under $5K, 18% from $5K to $10K, and 12% more than $10K. Like salary change, the bonus data were not amenable to prediction using the rest of the survey data, aside from the trivial result that the bigger bonuses tended to be received by those with the highest salaries.
Among non-cash parts of compensation, most respondents reported that they receive health insurance (81%) and contributions to a retirement plan (64%). Smaller cohorts received stock options (30%), profit sharing (16%), and the opportunity for a sabbatical (10%). Less than three weeks of vacation were available to 24% of the sample, exactly three weeks to 38%, three or four to 26%, and the remaining 12% had six weeks or more. Of these four groups, the one with the highest median salary was the last: $100K and six weeks of vacation. Unsurprisingly, vacation was more generous in Europe than in the US: 4.6 weeks on average in Europe (both in the UK and on the continent) and 3.3 weeks on average in the US.
Conclusion
SALARY IS NOT SOMETHING WE SHOULD IGNORE, even though many of us might not want to spend too much time dwelling on money matters or worrying that we don’t make enough. The commonly accepted rule that it is not appropriate to share information about your salary with colleagues has reasonable justification—too much information could cultivate an environment of envy or perceived injustice—but no information at all about how much one should earn results in plenty of confusion and unfairness as well. Both the employer and the employee gain from knowing more or less what the latter should make.
Aside from the purpose of determining an appropriate salary offer or ask, the information in this report is also intended to help those in the design space navigate through the important career choices: which tasks might you want to spend more (or less) time on; which tools might you want to learn; and at which types of companies might you want to apply for a job. On one hand, the correlation-causation distinction means that we cannot say, for example, that “learning” Slack (it’s pretty easy) will boost your salary by $6K.
On the other hand, the fact that we cannot assume causation in the observed correlations does not mean there is none. When, based on intuition, causation seems possible, and when the rewards appear to be large and costs relatively low, it seems reasonable to act on an observed correlation even if causation is not ensured. A prime example of this is with coding: it is intuitive that being able to code, at least a little, would help a UX designer working on web, mobile, or (software-enabled) hardware; and learning how to code a little is probably not a great cost compared to the potential reward—even hypothetically— of an estimated, eventual $16K salary increase.
In conclusion, we hope that you find this report interesting, but above all useful. Design is a quickly changing field, and we hope to keep up with it by continuing this research, which cannot be possible without your participation. We encourage you to try your own data in the model, and if you can spare 10 minutes, to take the survey yourself at oreilly.com/ design/2017-design-salary-survey.
Note
We need your data.
To stay up to date on this research, your participation is critical. The survey is now open for the 2017 report, and if you can spare just 10 minutes of your time, we encourage you to take the survey. oreilly.com/design/2017-design-salary-survey.