2016 Software Development Salary Survey
Find out what pays and what doesn't for programming professionals.
 A large air-ship, aeroplane and hot-air balloons fly over a building and its grounds. (source: Wellcome Library, London. Wellcome Images)
Executive Summary
The O’Reilly Software Development Salary Survey contained 72 questions about the respondents’ roles, tools, compensation, and demographic background. Over 5,000 software engineers, developers, and other professionals involved in programming participated in the survey, providing us with the opportunity to explore the software-development world—and the careers that propel it—in great detail. Key findings include:
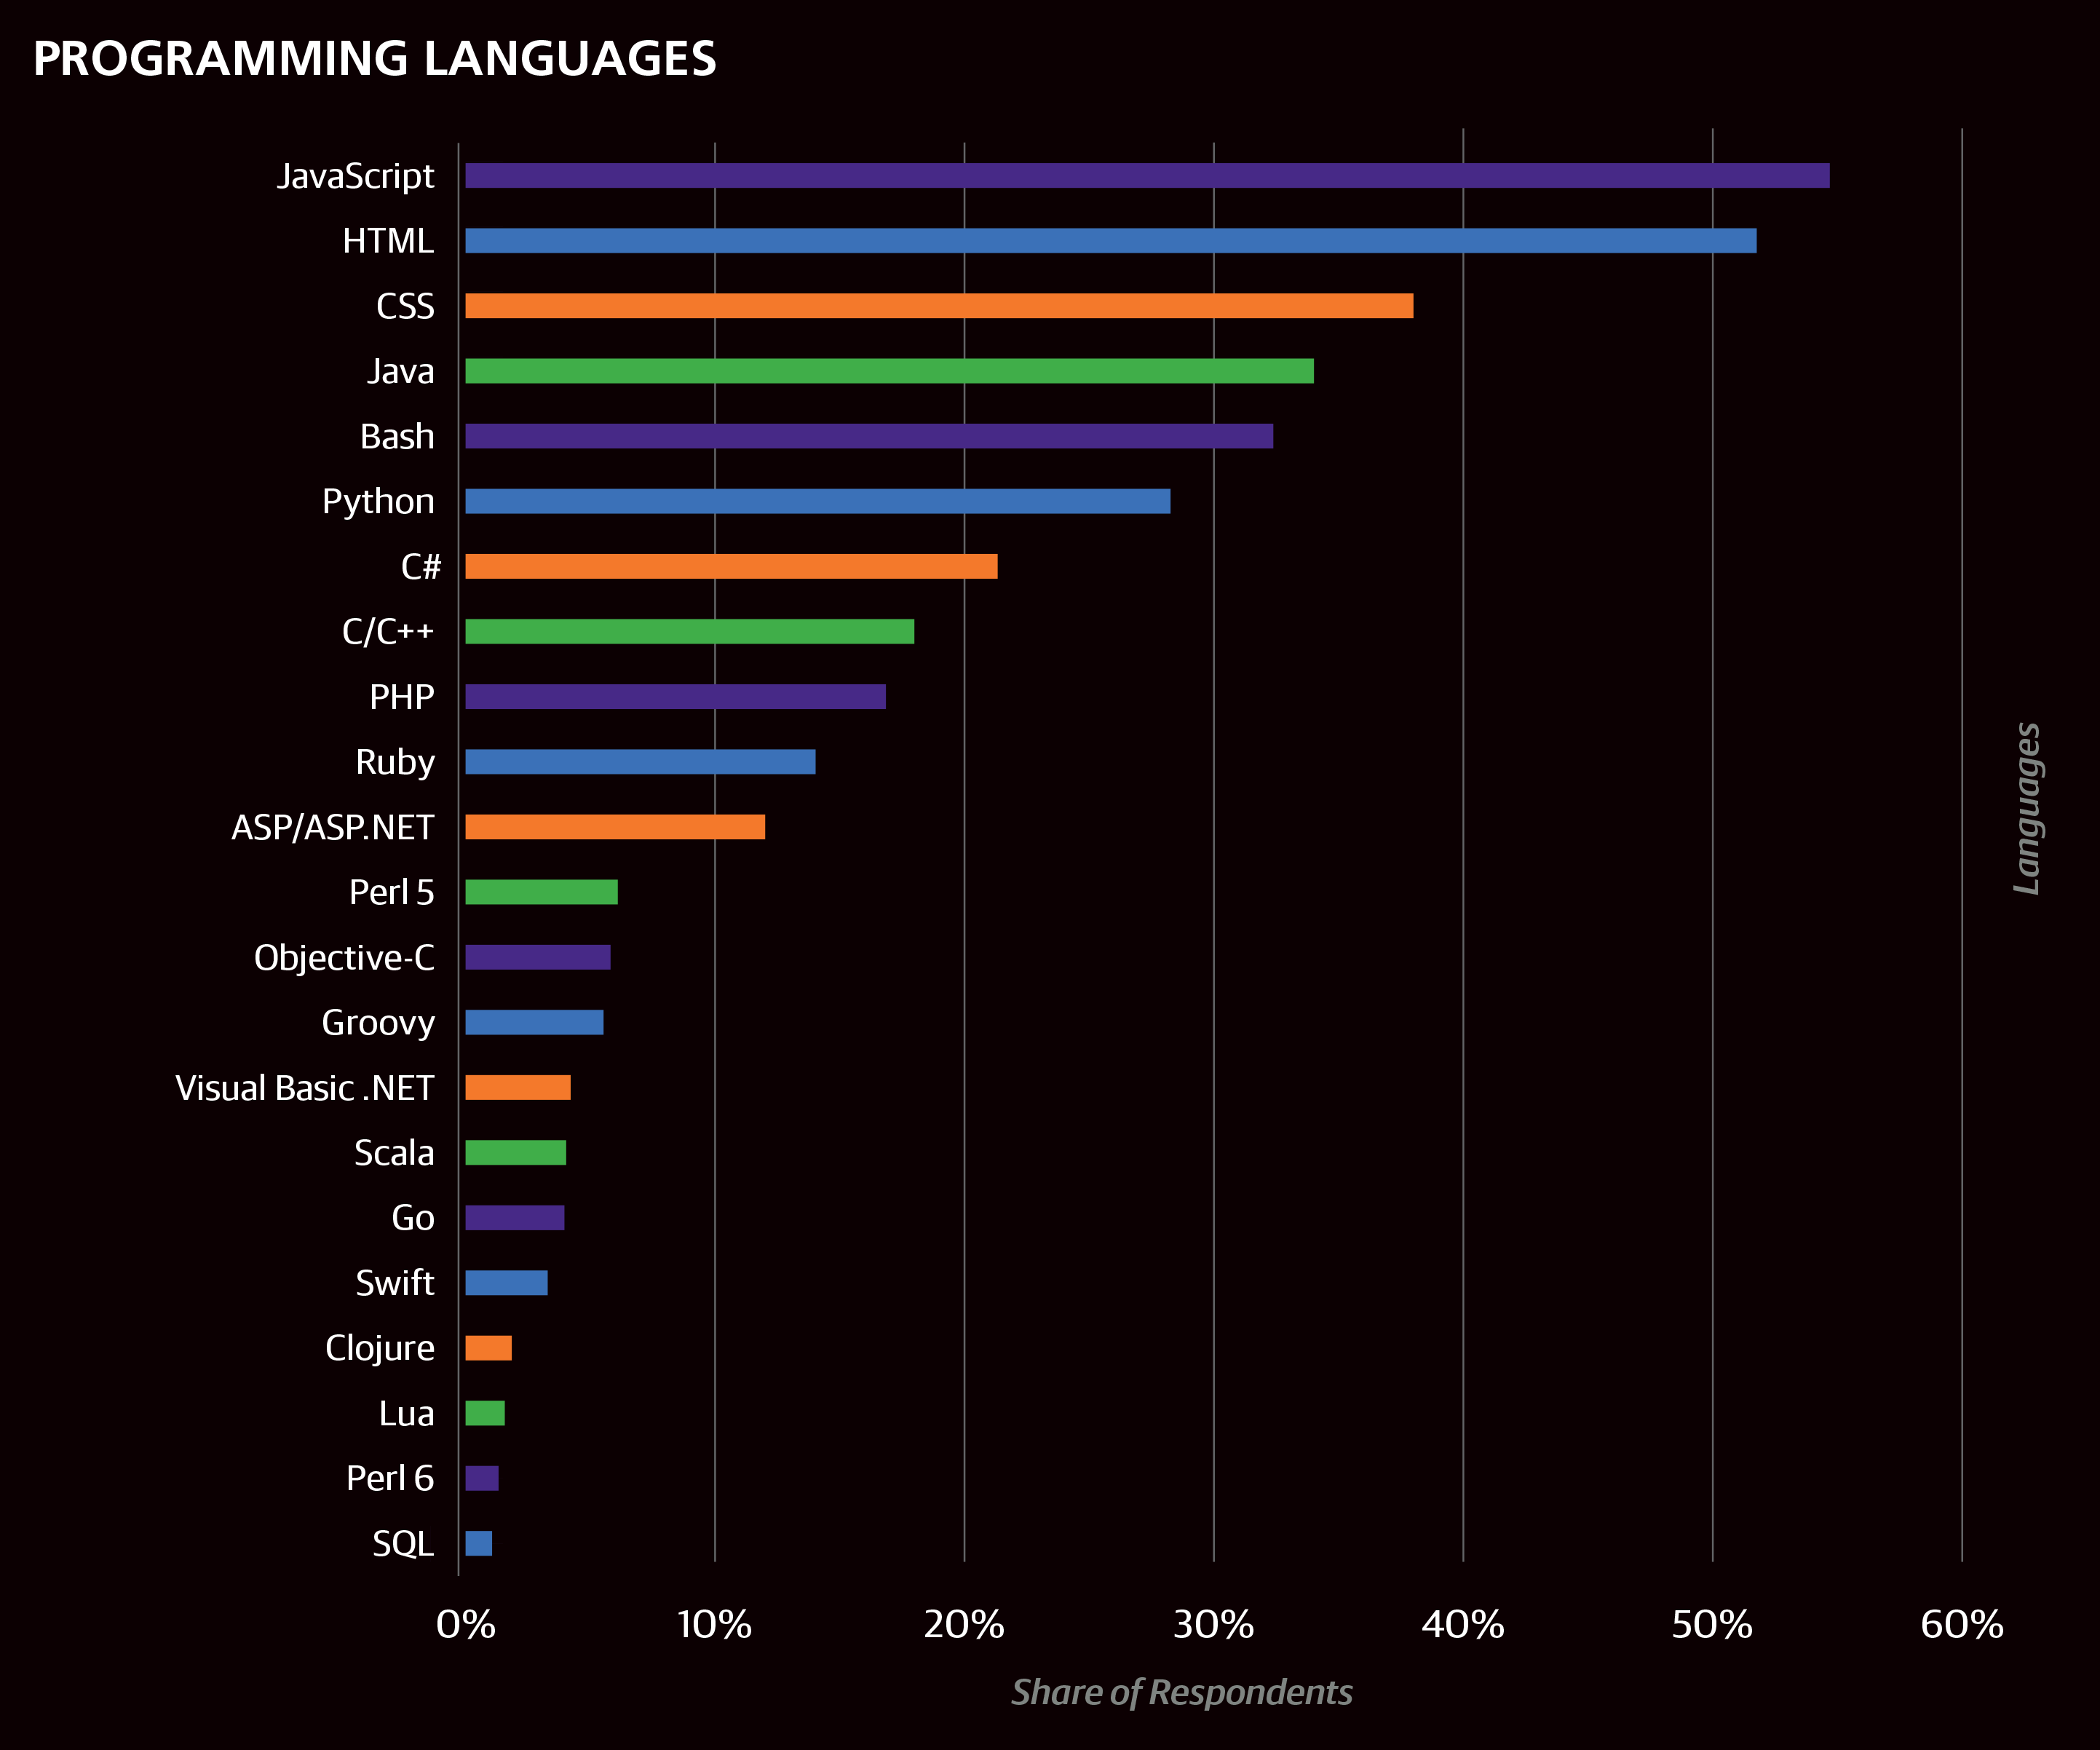
- Top languages currently used professionally in the sample: JavaScript, HTML, CSS, Java, Bash, Python
- Respondents reported using an average of 3.75 languages
- The highest salaries are in the US (especially CA, OR, WA), Switzerland, Japan, Australia, and the UK
- Software development is a social endeavor: those on tiny teams and who don’t attend meetings tend to earn much less
- The most common languages that respondents used in the past but no longer use were C/C++, Java, PHP
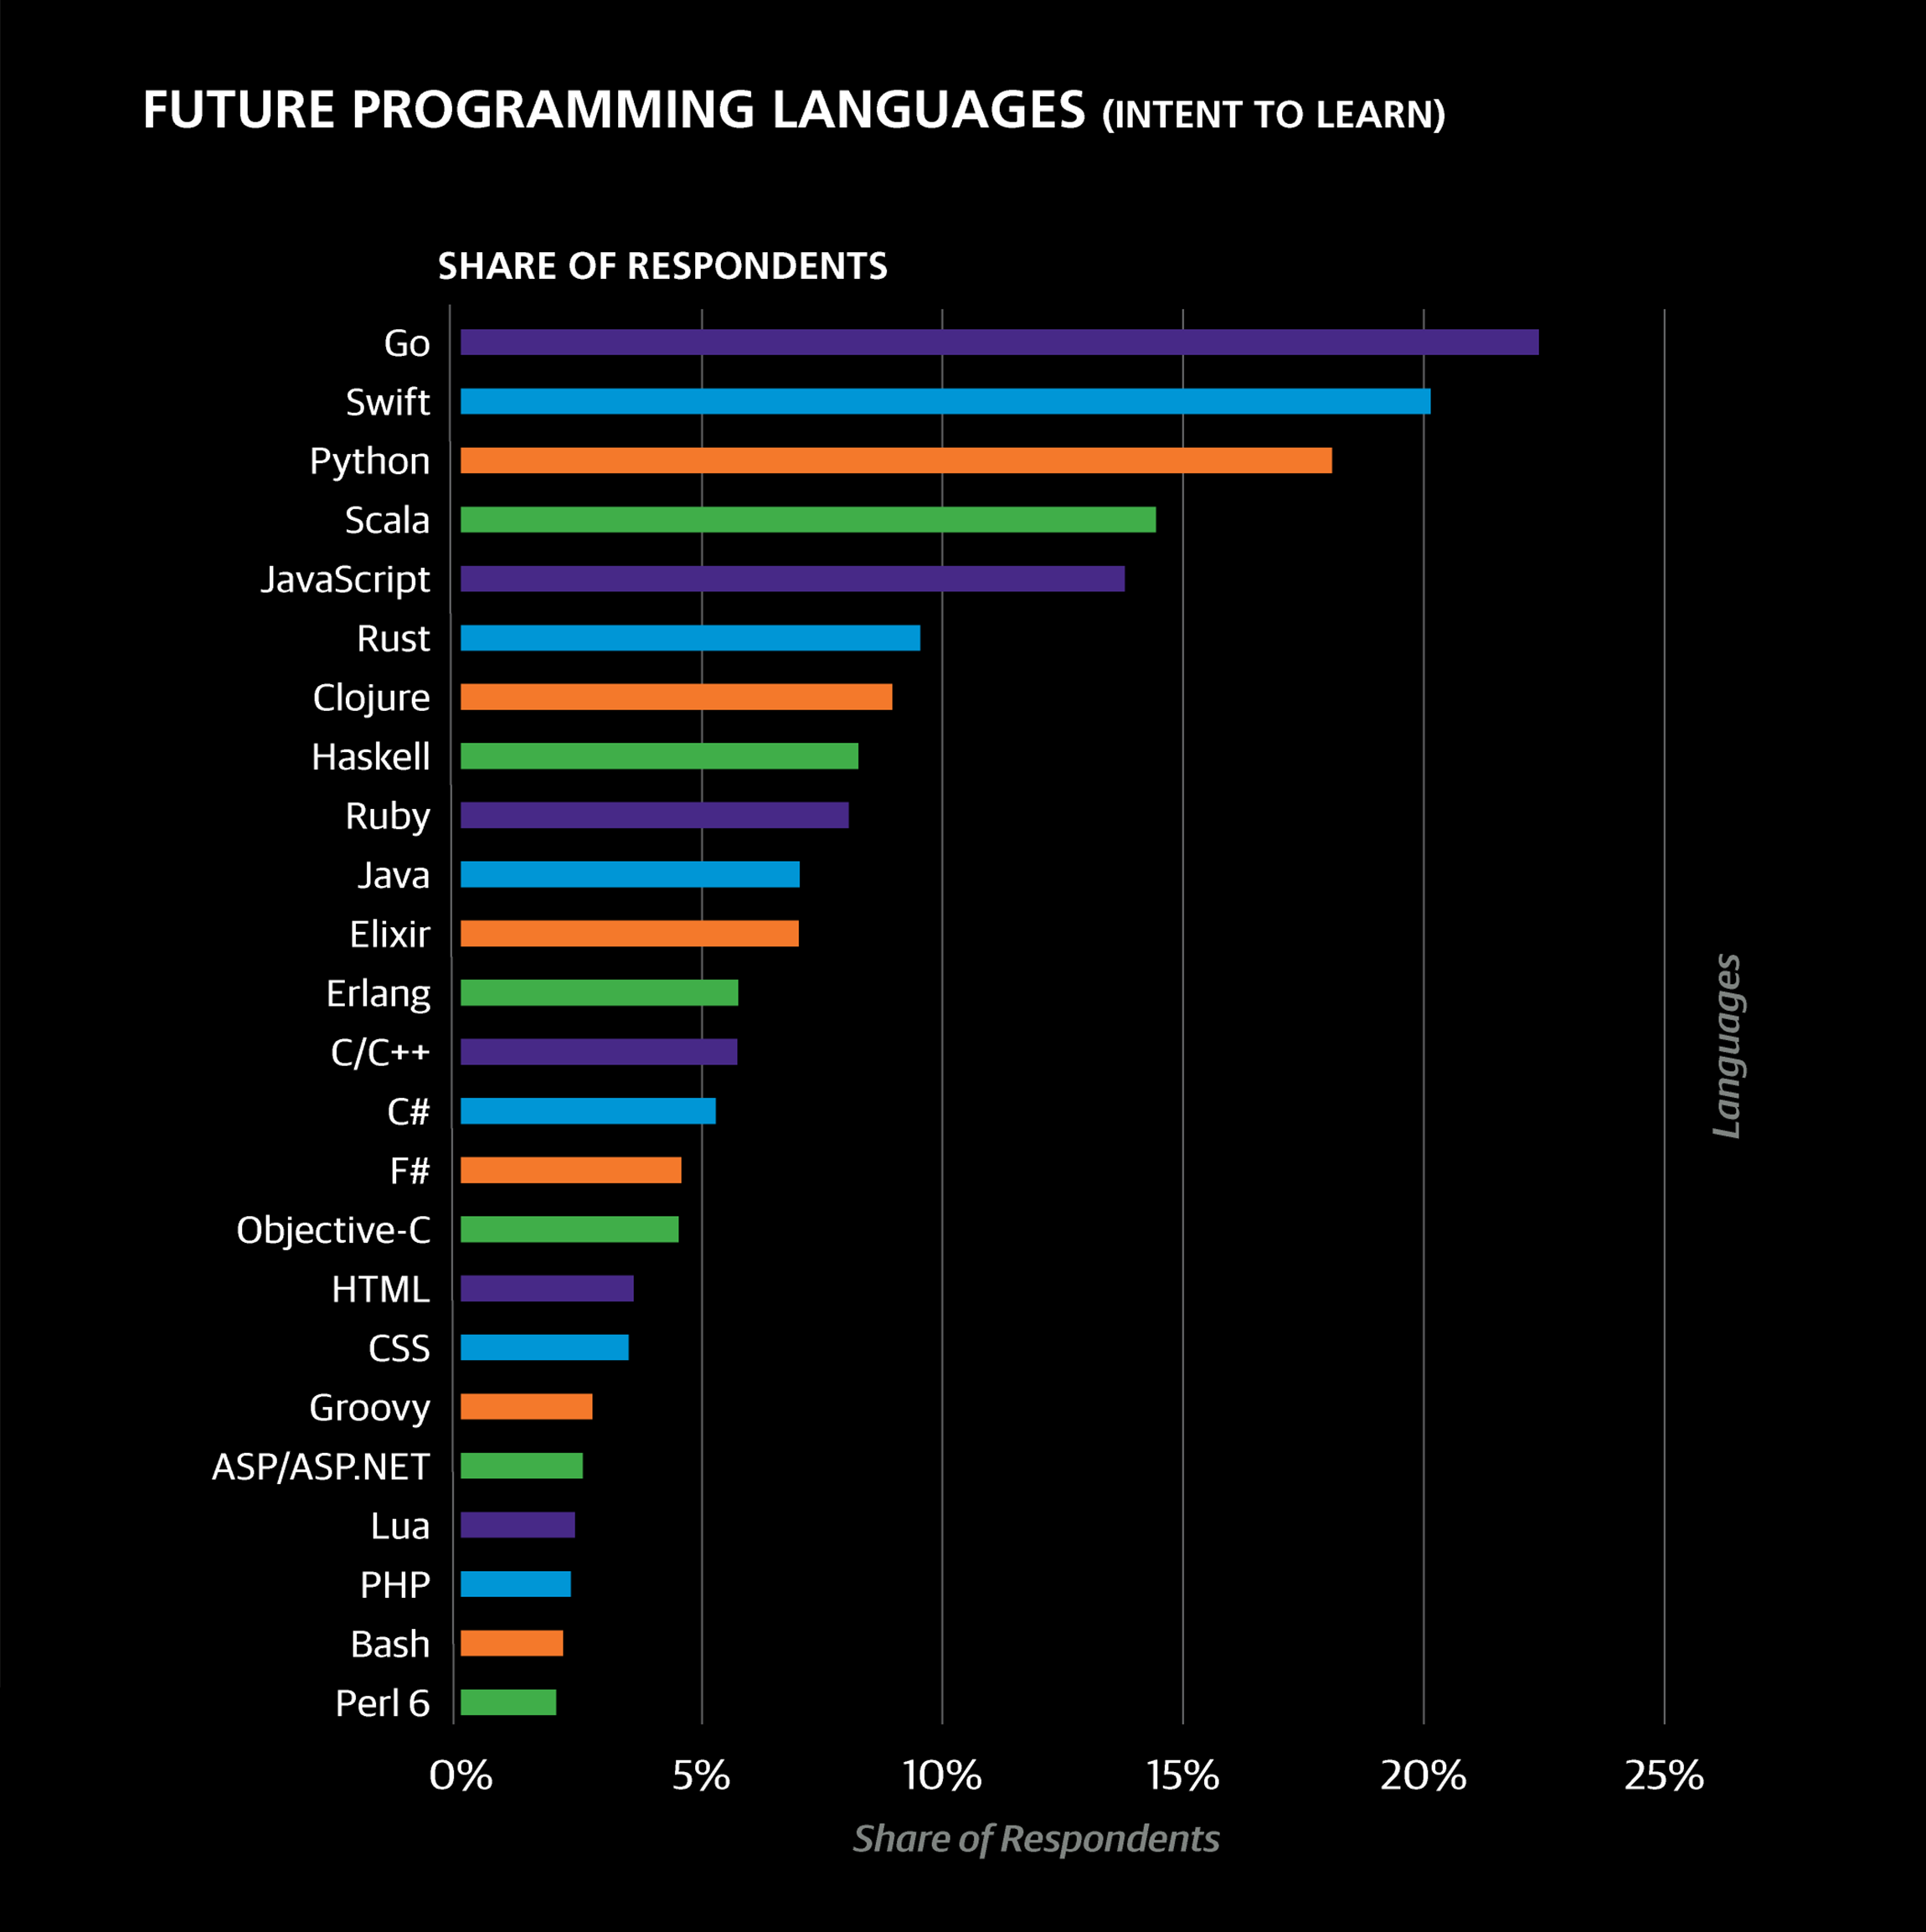
- The most common languages that respondents stated they intend to learn in the next 1–2 years were Go, Swift, Python, and Scala
Salary estimates can be obtained from a model based on the survey data whose coefficients are mentioned throughout the report and repeated in full at the end. We hope you will learn something new (and useful!) from this report, and we encourage you to try plugging your own data points into the model.

Learn faster. Dig deeper. See farther.
You can take next year’s survey here.
Introduction
The first O’Reilly Software Development Salary Survey was conducted online using Google Forms. Between January and February 2016, 5,081 respondents submitted responses, from 51 countries and all 50 US states, from companies both large and small, and from a wide variety of industries. Respondents were mostly software developers, but other professionals who program also participated.
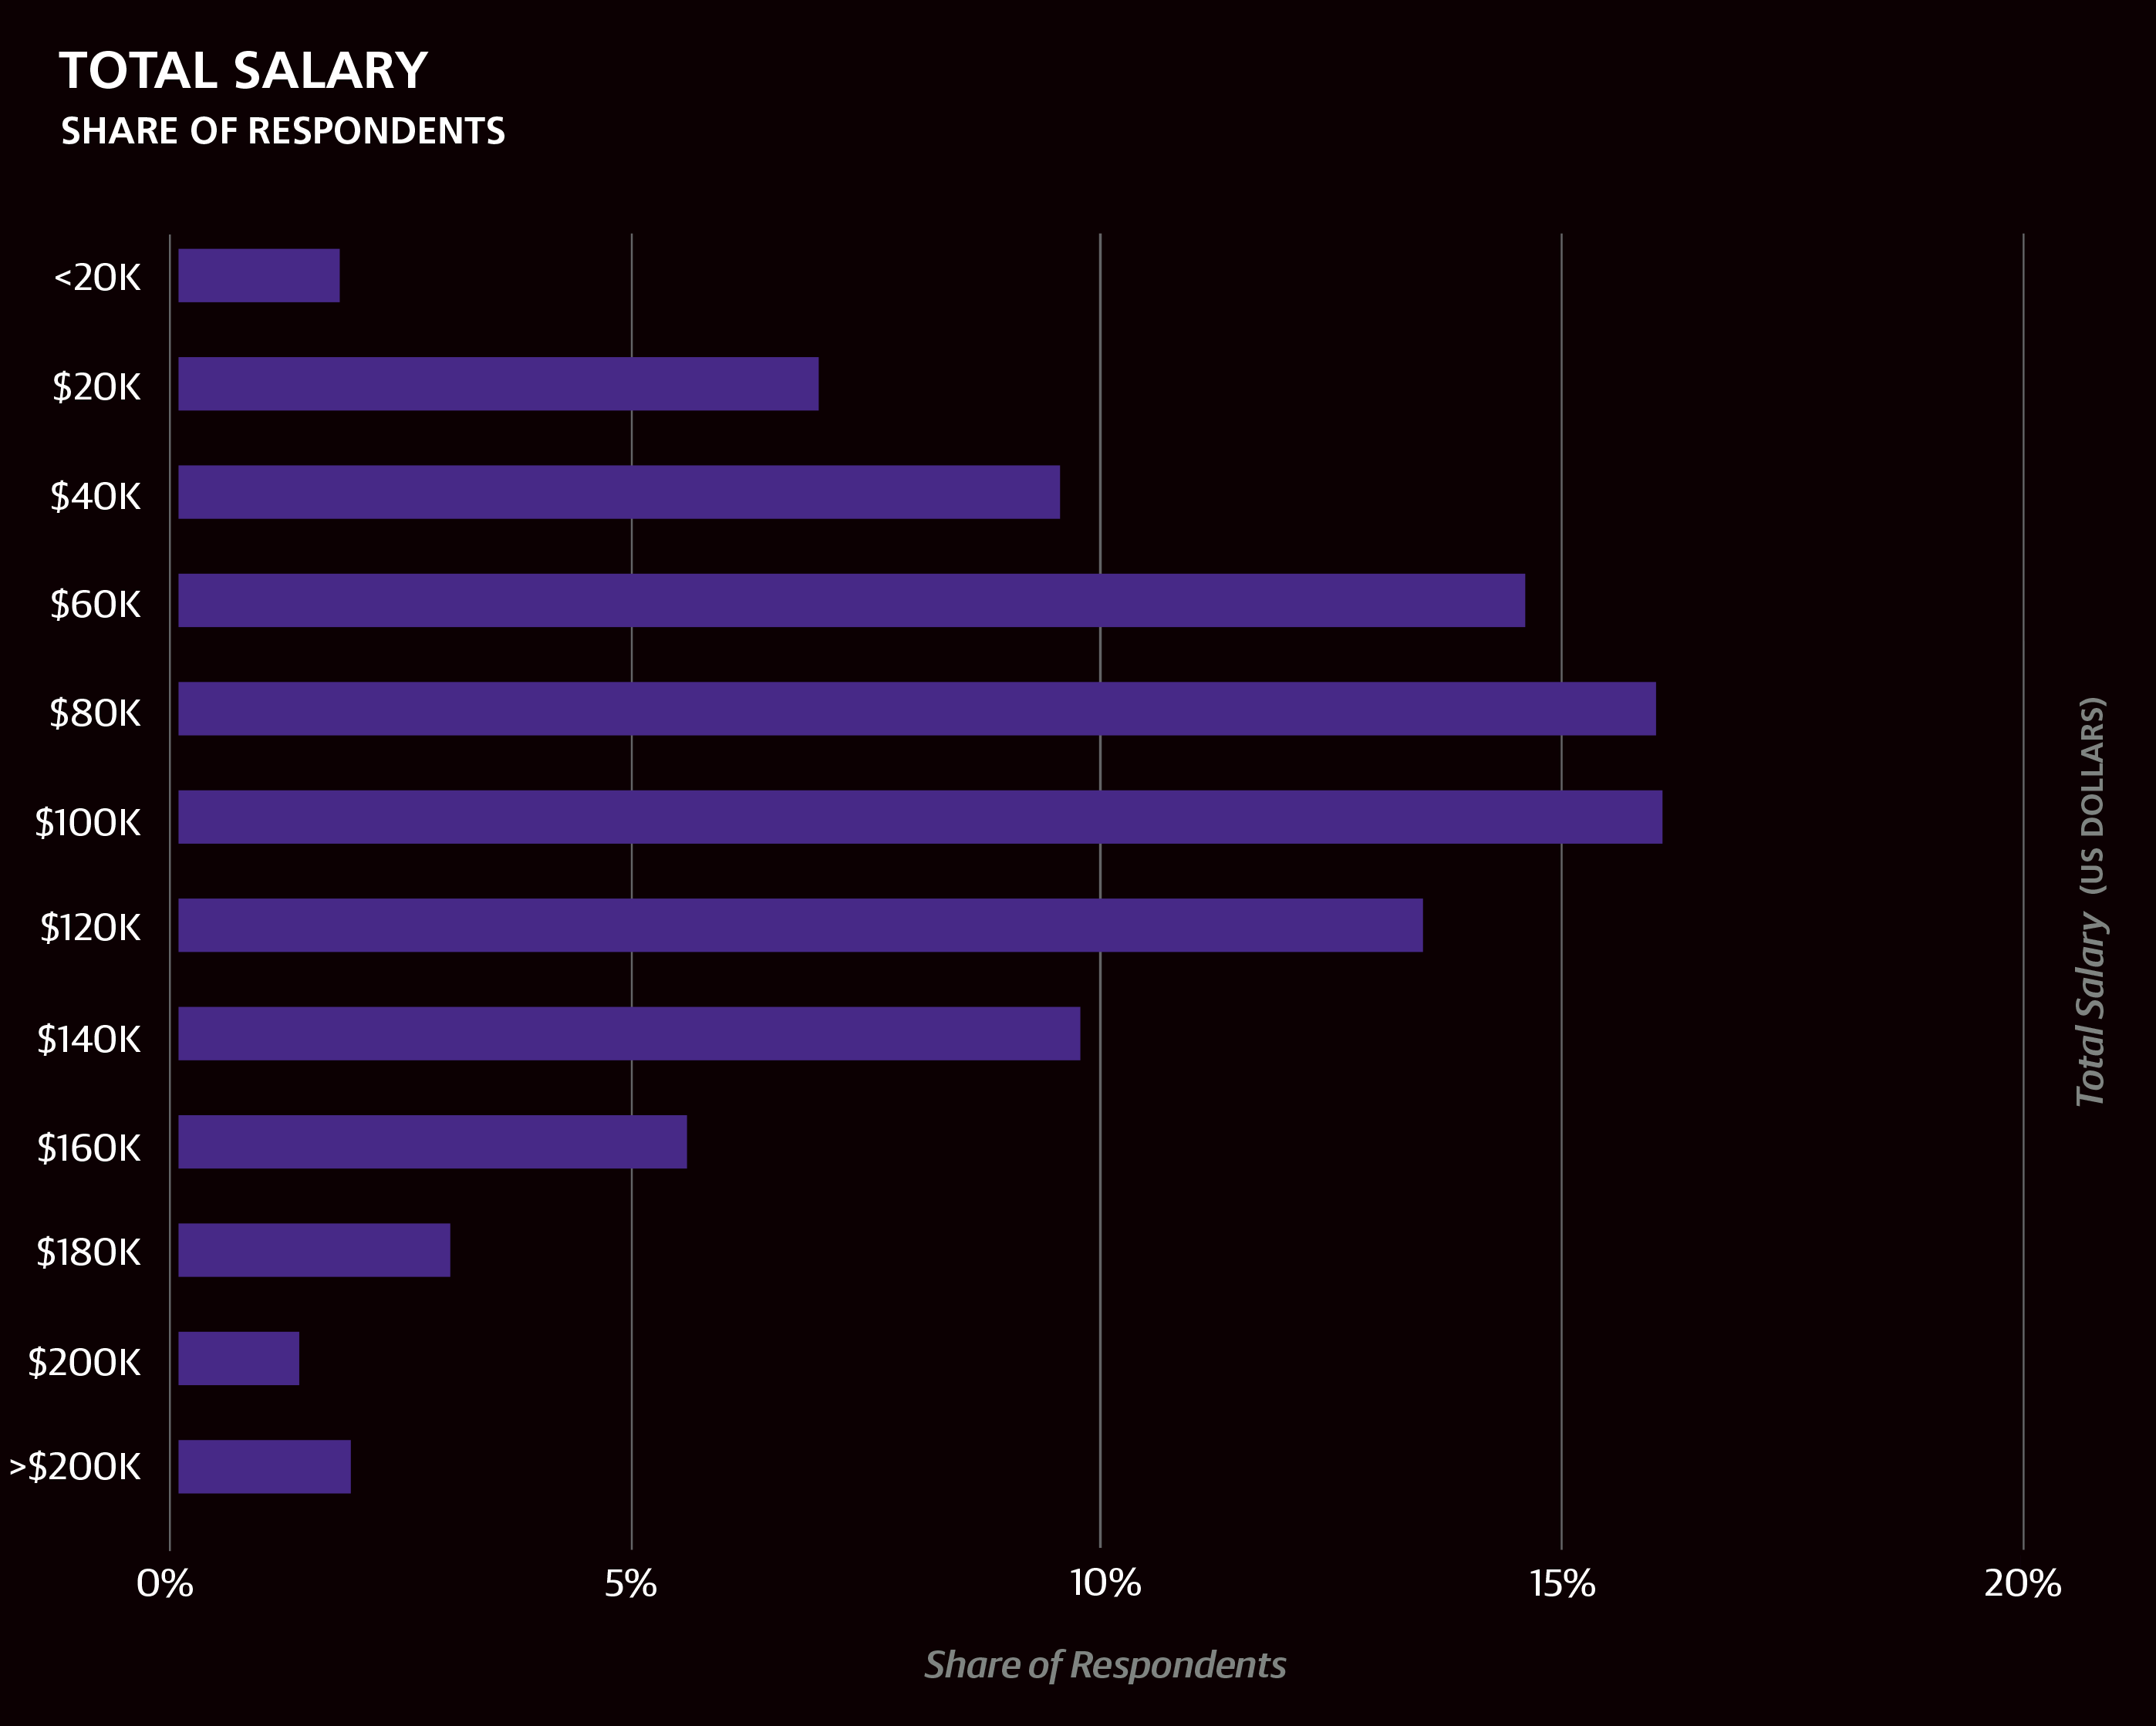
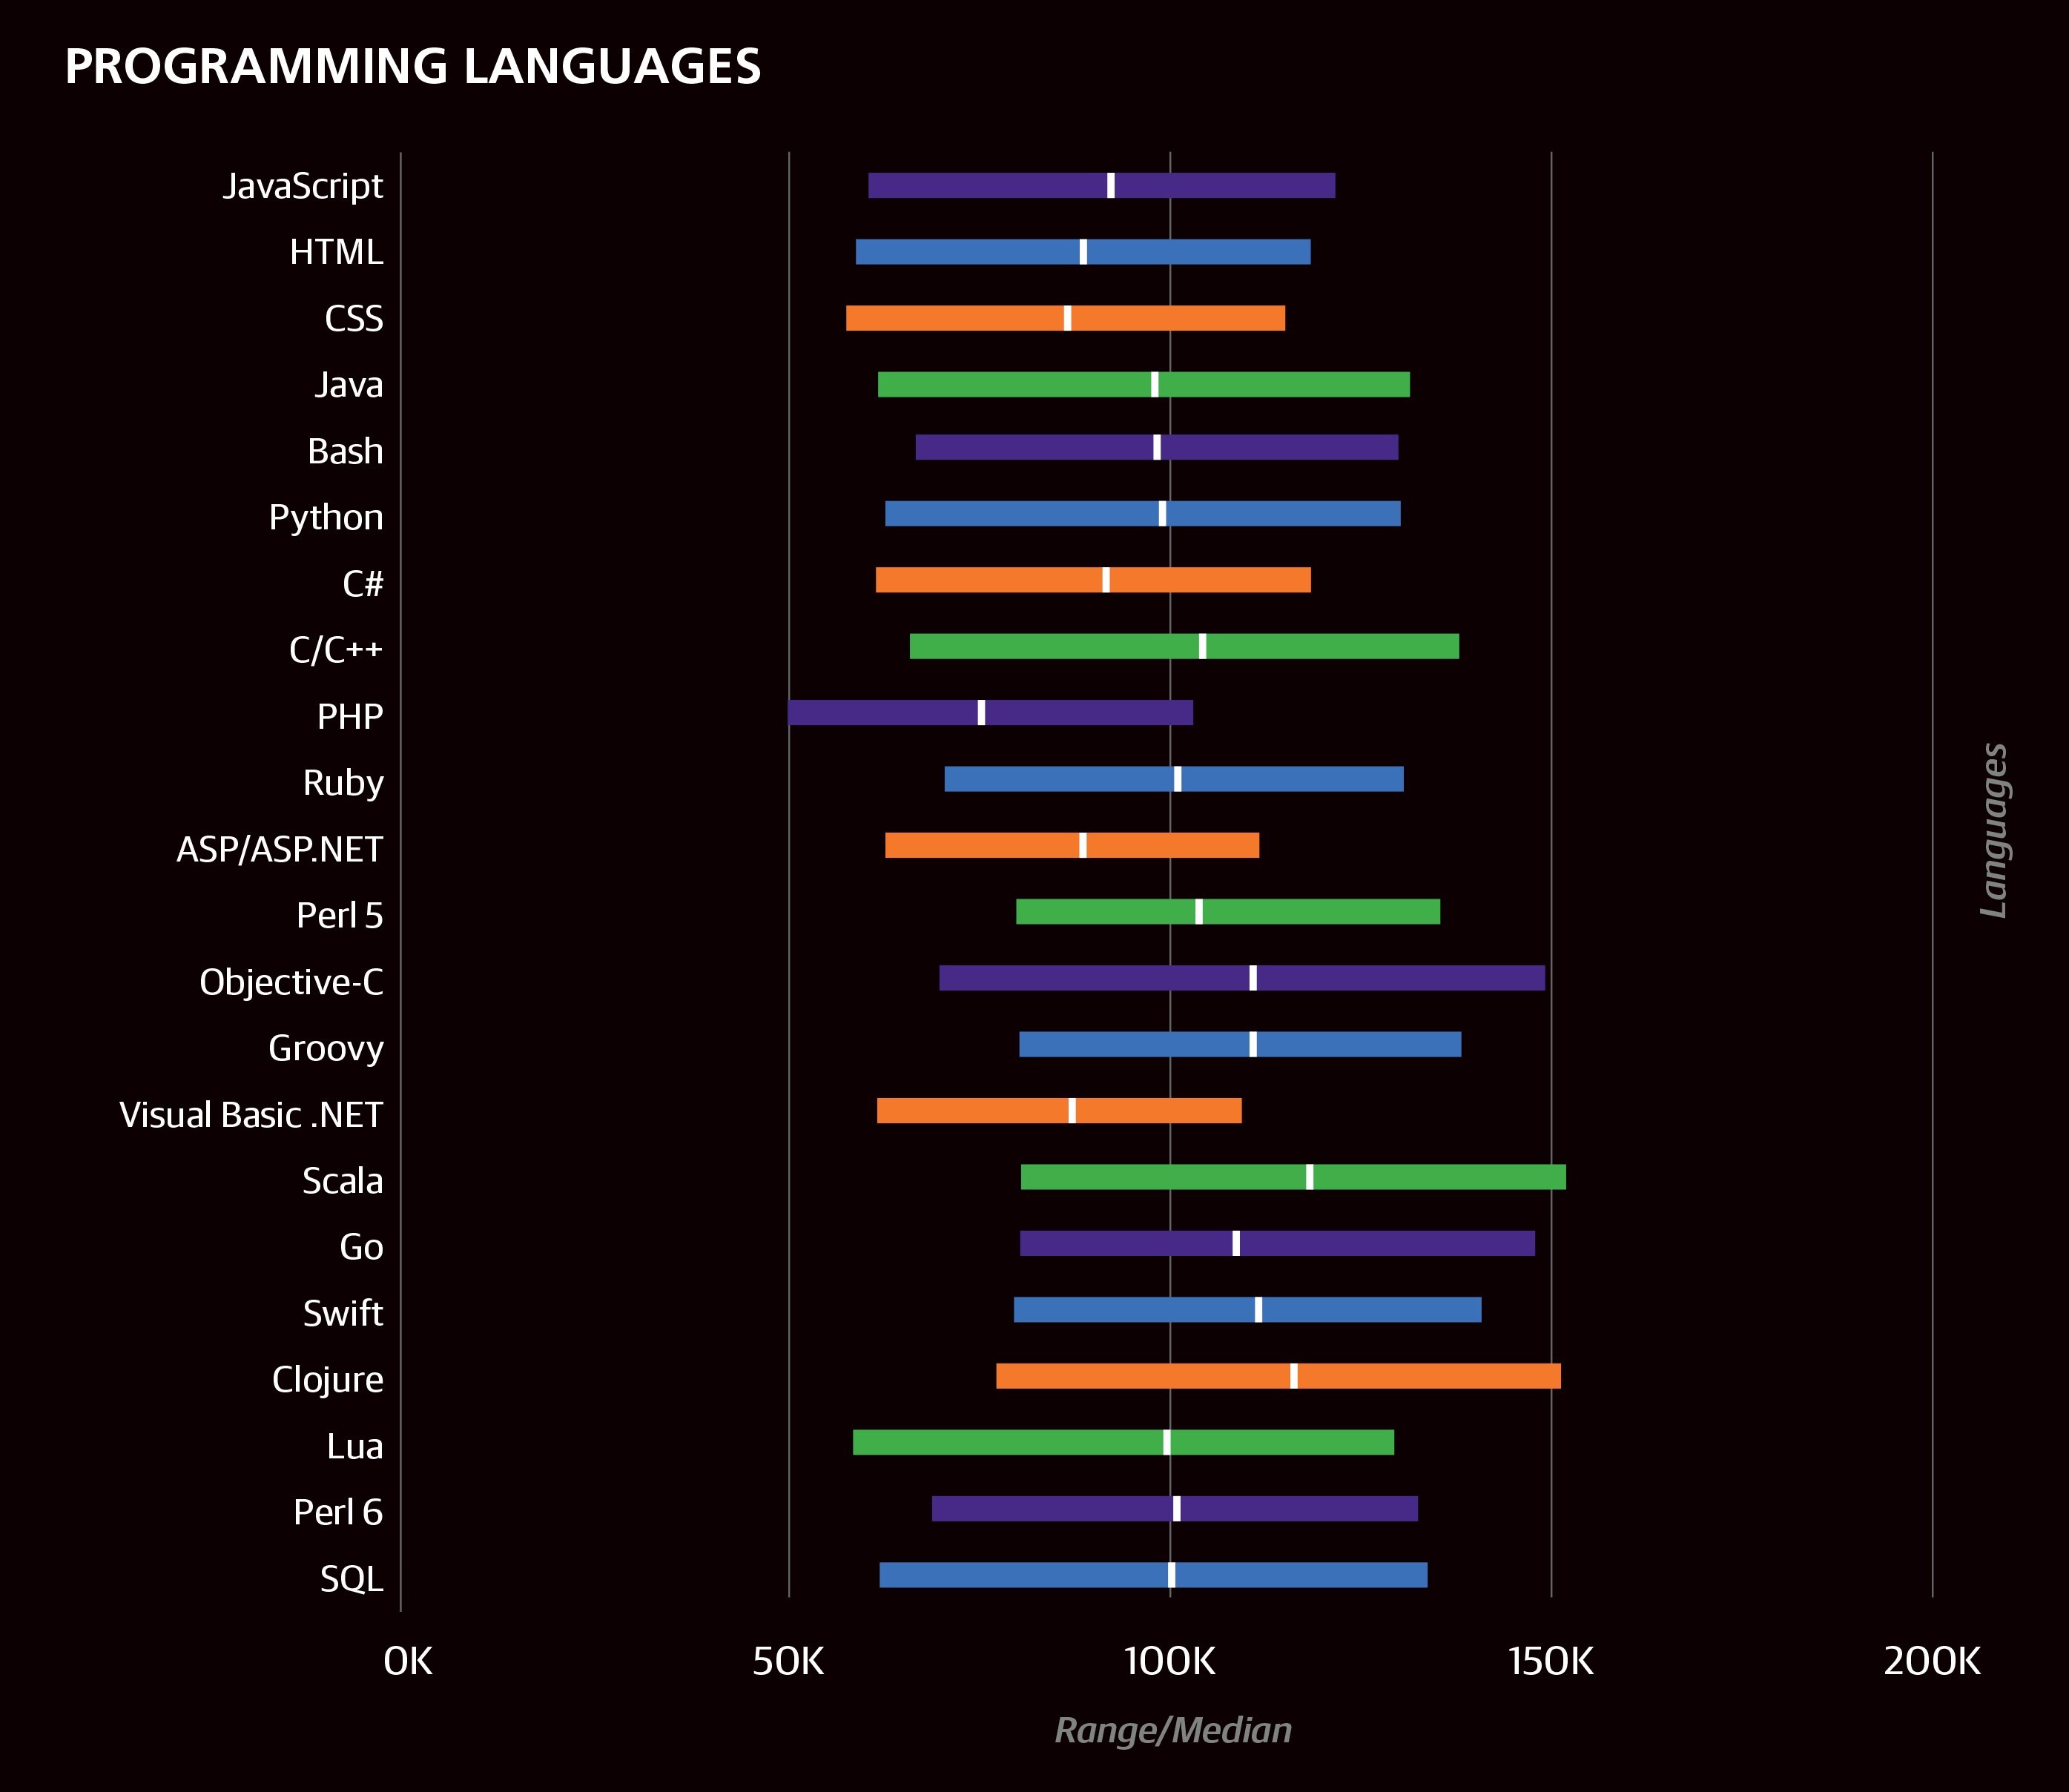
The median salary of the entire sample was $90,000 ($110,000 for US respondents only), with the middle half of all respondents earning between $60K and $125K. (The latter statistic is called the interquartile range (IQR)—the middle 50%—and is used to describe the salaries of particular subsets of the sample in the text below and in the accompanying graphs. The IQR is useful for showing the middle of the salary range without the distortion of outliers in the lowest and highest quartiles). Much of the variation in salary can be described using other variables gathered via the survey.
In addition to simply reporting the salaries of specific groups of respondents, such as those from a certain industry or who use a certain language, we also present coefficients corresponding to these groups from a simple, linear model based on the survey data. The coefficients are contribution components: by summing the coefficients corresponding to variables that apply to someone working in software development, we obtain an estimate for their salary. Note that not all variables get included in the model, since the method used to generate the model penalizes complexity to avoid overfitting and thus deems many variables insignificant. In each section we mention the relevant, significant coefficients, and at the end of the report we repeat those coefficients when we show the full model.
Note
In the horizontal bar charts throughout this report, we include the interquartile range (IQR) to show the middle 50% of respondents’ answers to questions such as salary. One quarter of the respondents has a salary below the displayed range, and one quarter has a salary above the displayed range.
A primary motivation for constructing a linear model is to clarify the relationship between salary and demographic/role-related variables when two variables are highly correlated. For example, Asian respondents tend to have less experience than other groups and also have a low median salary: $31K, about $80K less than US-based respondents. However, the model isolates the “effects” of the different variables—when the model takes experience into account, the discrepancy between US and Asia salaries is halved.
We deliberately highlight “effects” with quotation marks to highlight a key point to keep in mind when interpreting these results: correlation does not imply causation. A classic example involves meetings: just because salary clearly rises with the weekly number of hours spent in meetings, don’t expect to get a raise just by maneuvering to add meetings to your schedule! Keep in mind that the survey methodology does not support what may, intuitively, seem like reasonable assumptions of causation from even the strongest correlations—testing for causation is a difficult process at best.
We excluded managers and students from the model altogether as many of the features we think might help determine salary, such as language use, likely work differently, if at all, with these groups. We also exclude those working fewer than 30 hours per week.
Geography
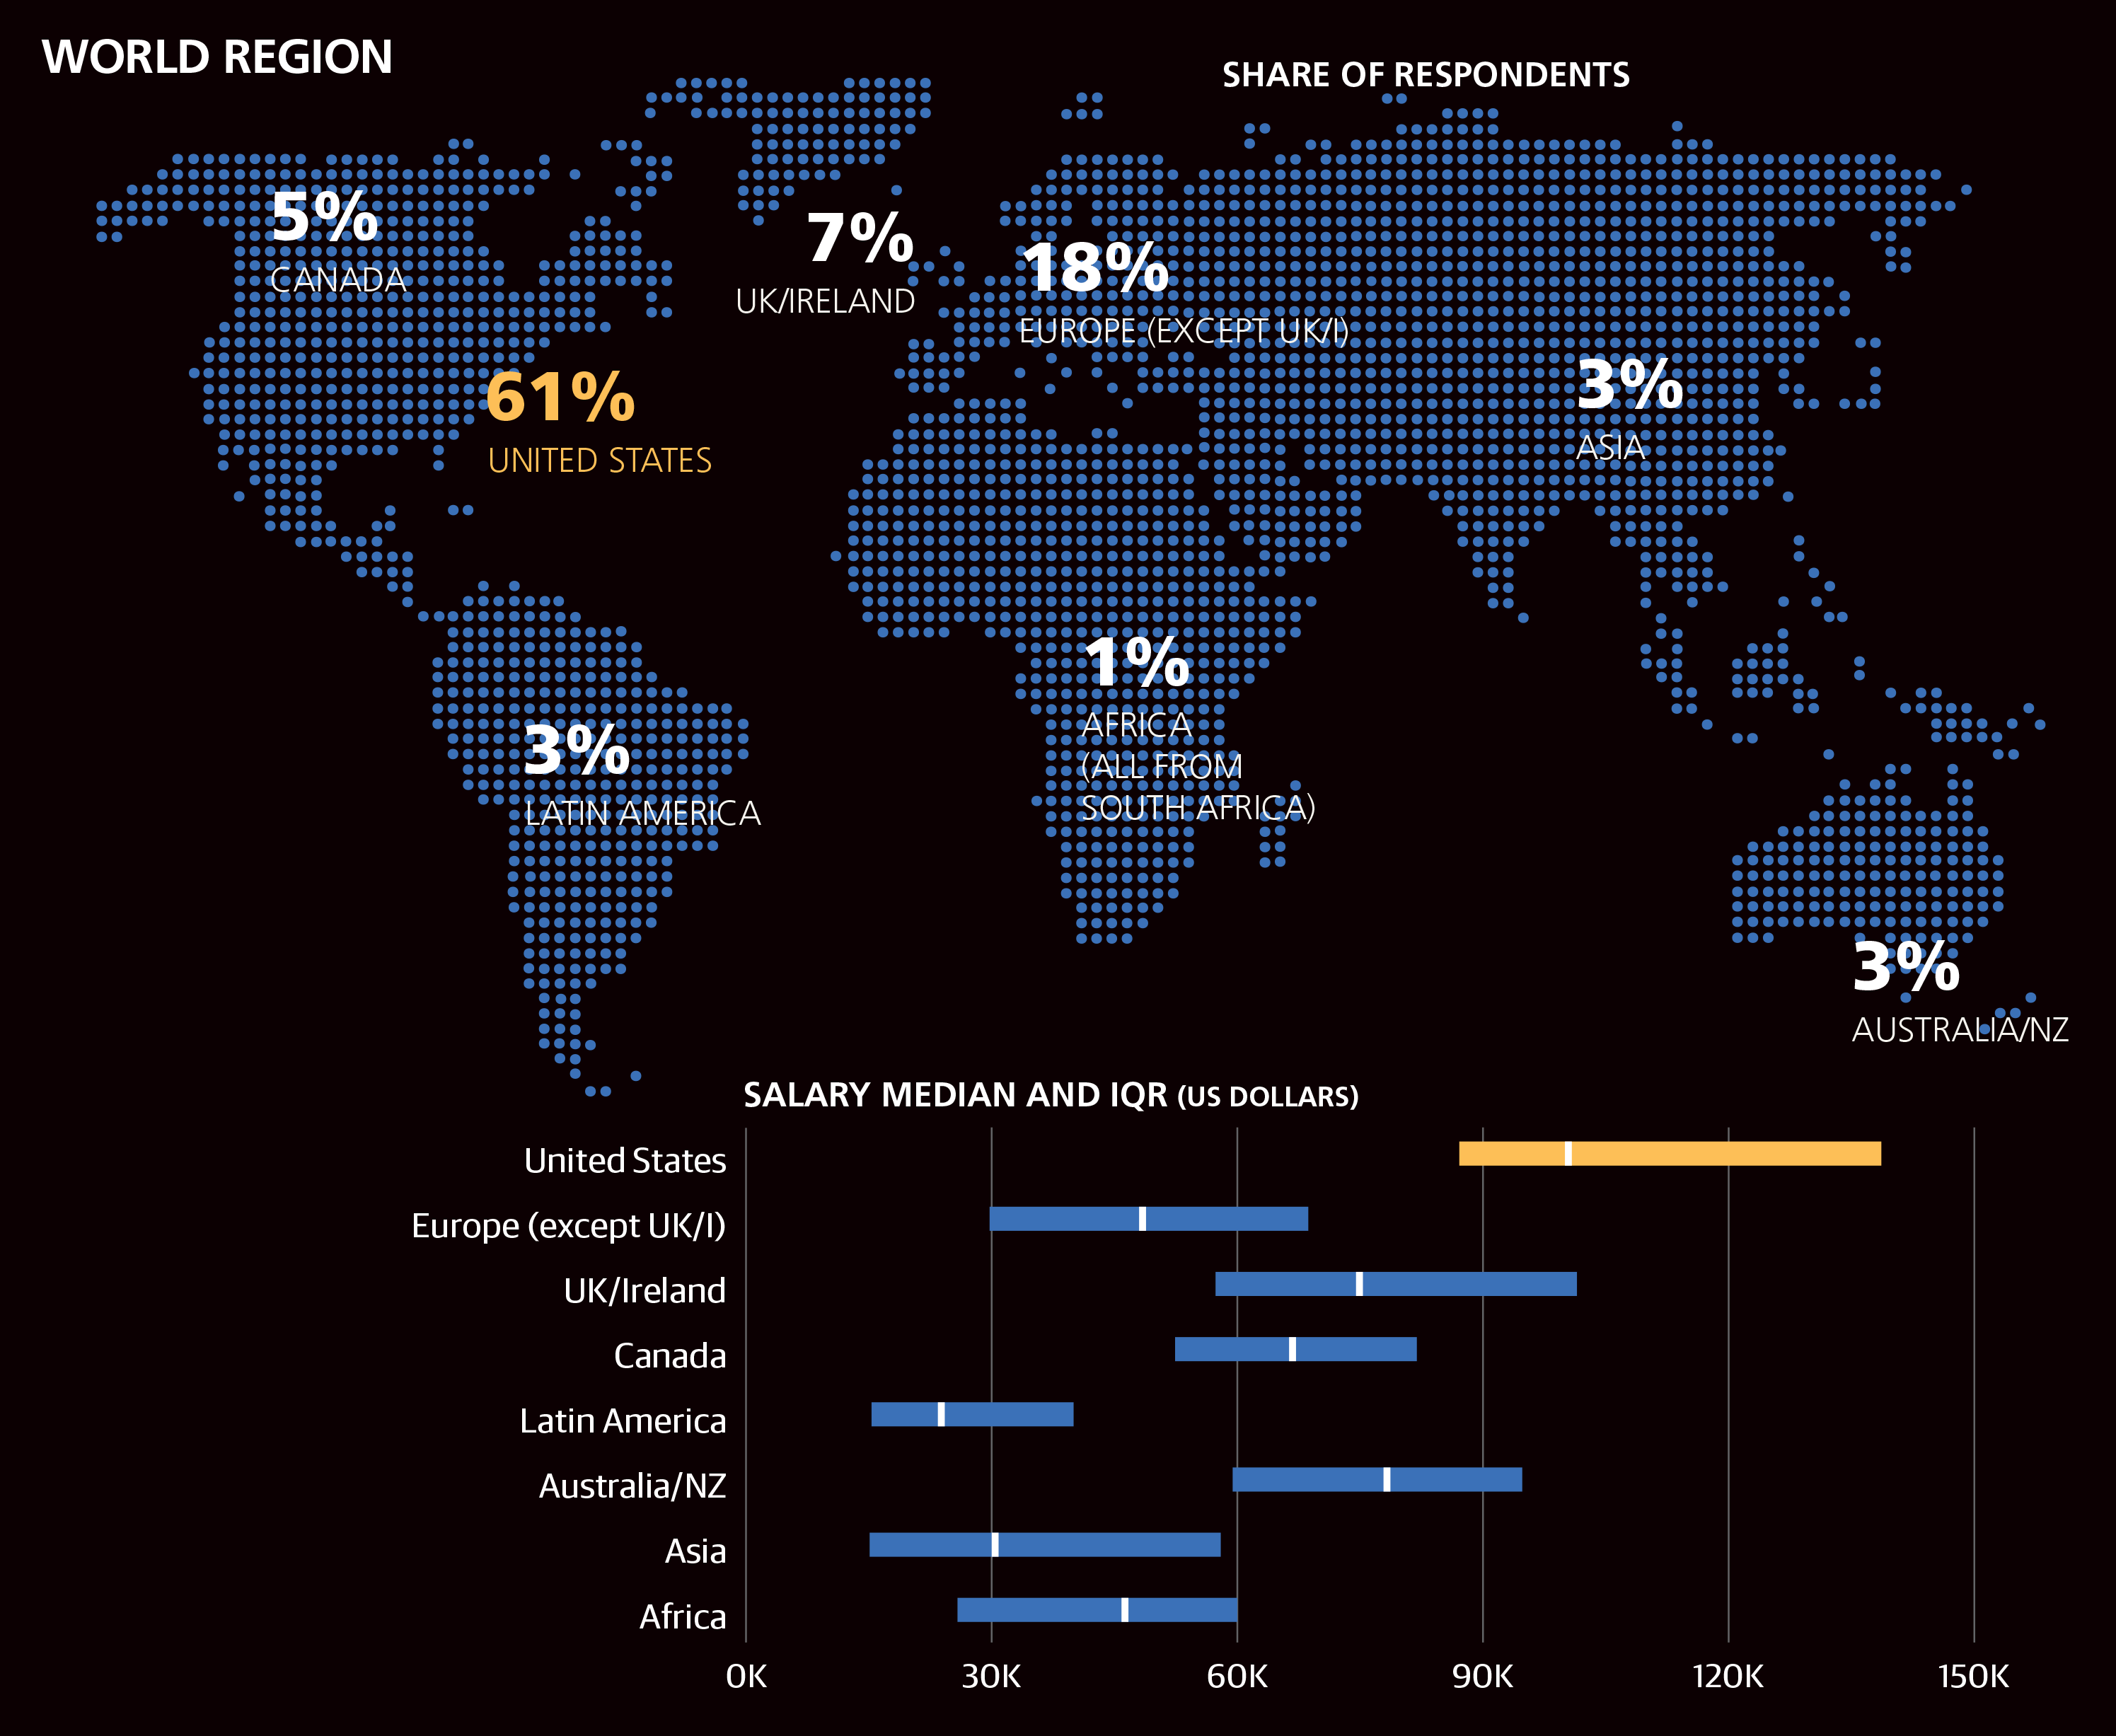
One of the most basic pieces of information that has a strong effect on salary is geography. Most respondents were based in the US (61%), UK (7%), Canada (5%), Germany (4%), or Australia (2%); 26% were based in Europe. Thirty countries had at least 20 respondents in the sample, allowing for a more detailed view of salary by region. We should note that, even so, not every country is assigned a separate coefficient: coefficients are chosen for world regions (usually continents) or for countries where salaries vary greatly from those in other countries in the region. We also note that the positive and negative USD dollar amounts quoted as coefficients are only the beginning of a salary estimate: more coefficients will be added later on.
Salaries in Europe were particularly uneven, and the model assigned numerous coefficients to Europe. Northern/Western Europe tended to have higher salaries (+$17,443), while salaries in Switzerland (+$53,983) and the United Kingdom (+$25,782) were high enough to be given coefficients of their own. Developer salaries fall as we head into France (+$2,017), and further south into Spain, Portugal, Italy, Greece, and Turkey (–$5,163). Eastern Europe had a coefficient of –$14,804.
Japan ranked highly in worldwide developer salaries (+$36,076), far above India (–$22,064), Taiwan (–$13,285), the Philippines (–$13,621), and the rest of Asia (+$17,443). Other coefficients are absent, even though we know salaries in Asia should vary greatly, due to limited respondents from other Asian countries. After India, Japan, and the Philippines, Asian countries with the most respondents were Singapore, UAE, Malaysia, and Indonesia.
After the US, Switzerland, and Japan, the highest geographical coefficient was Australia’s, at +$29,636. New Zealand and Canada were lower (+$17,433 each), while Latin America (chiefly Brazil, Mexico, Argentina, and Colombia) had a coefficient of –$9,057, below Asia but above Eastern Europe. South Africa (the only African country represented in the sample) had a relatively high median salary—$46K (compared to $31K for Asia)—but the South African respondents also tended to be among the most experienced in the sample, so their coefficient was only –$3,766. This is likely just a quirk of the sample and is another good example of why the linear-model coefficients are a better lens to compare features than median salary.
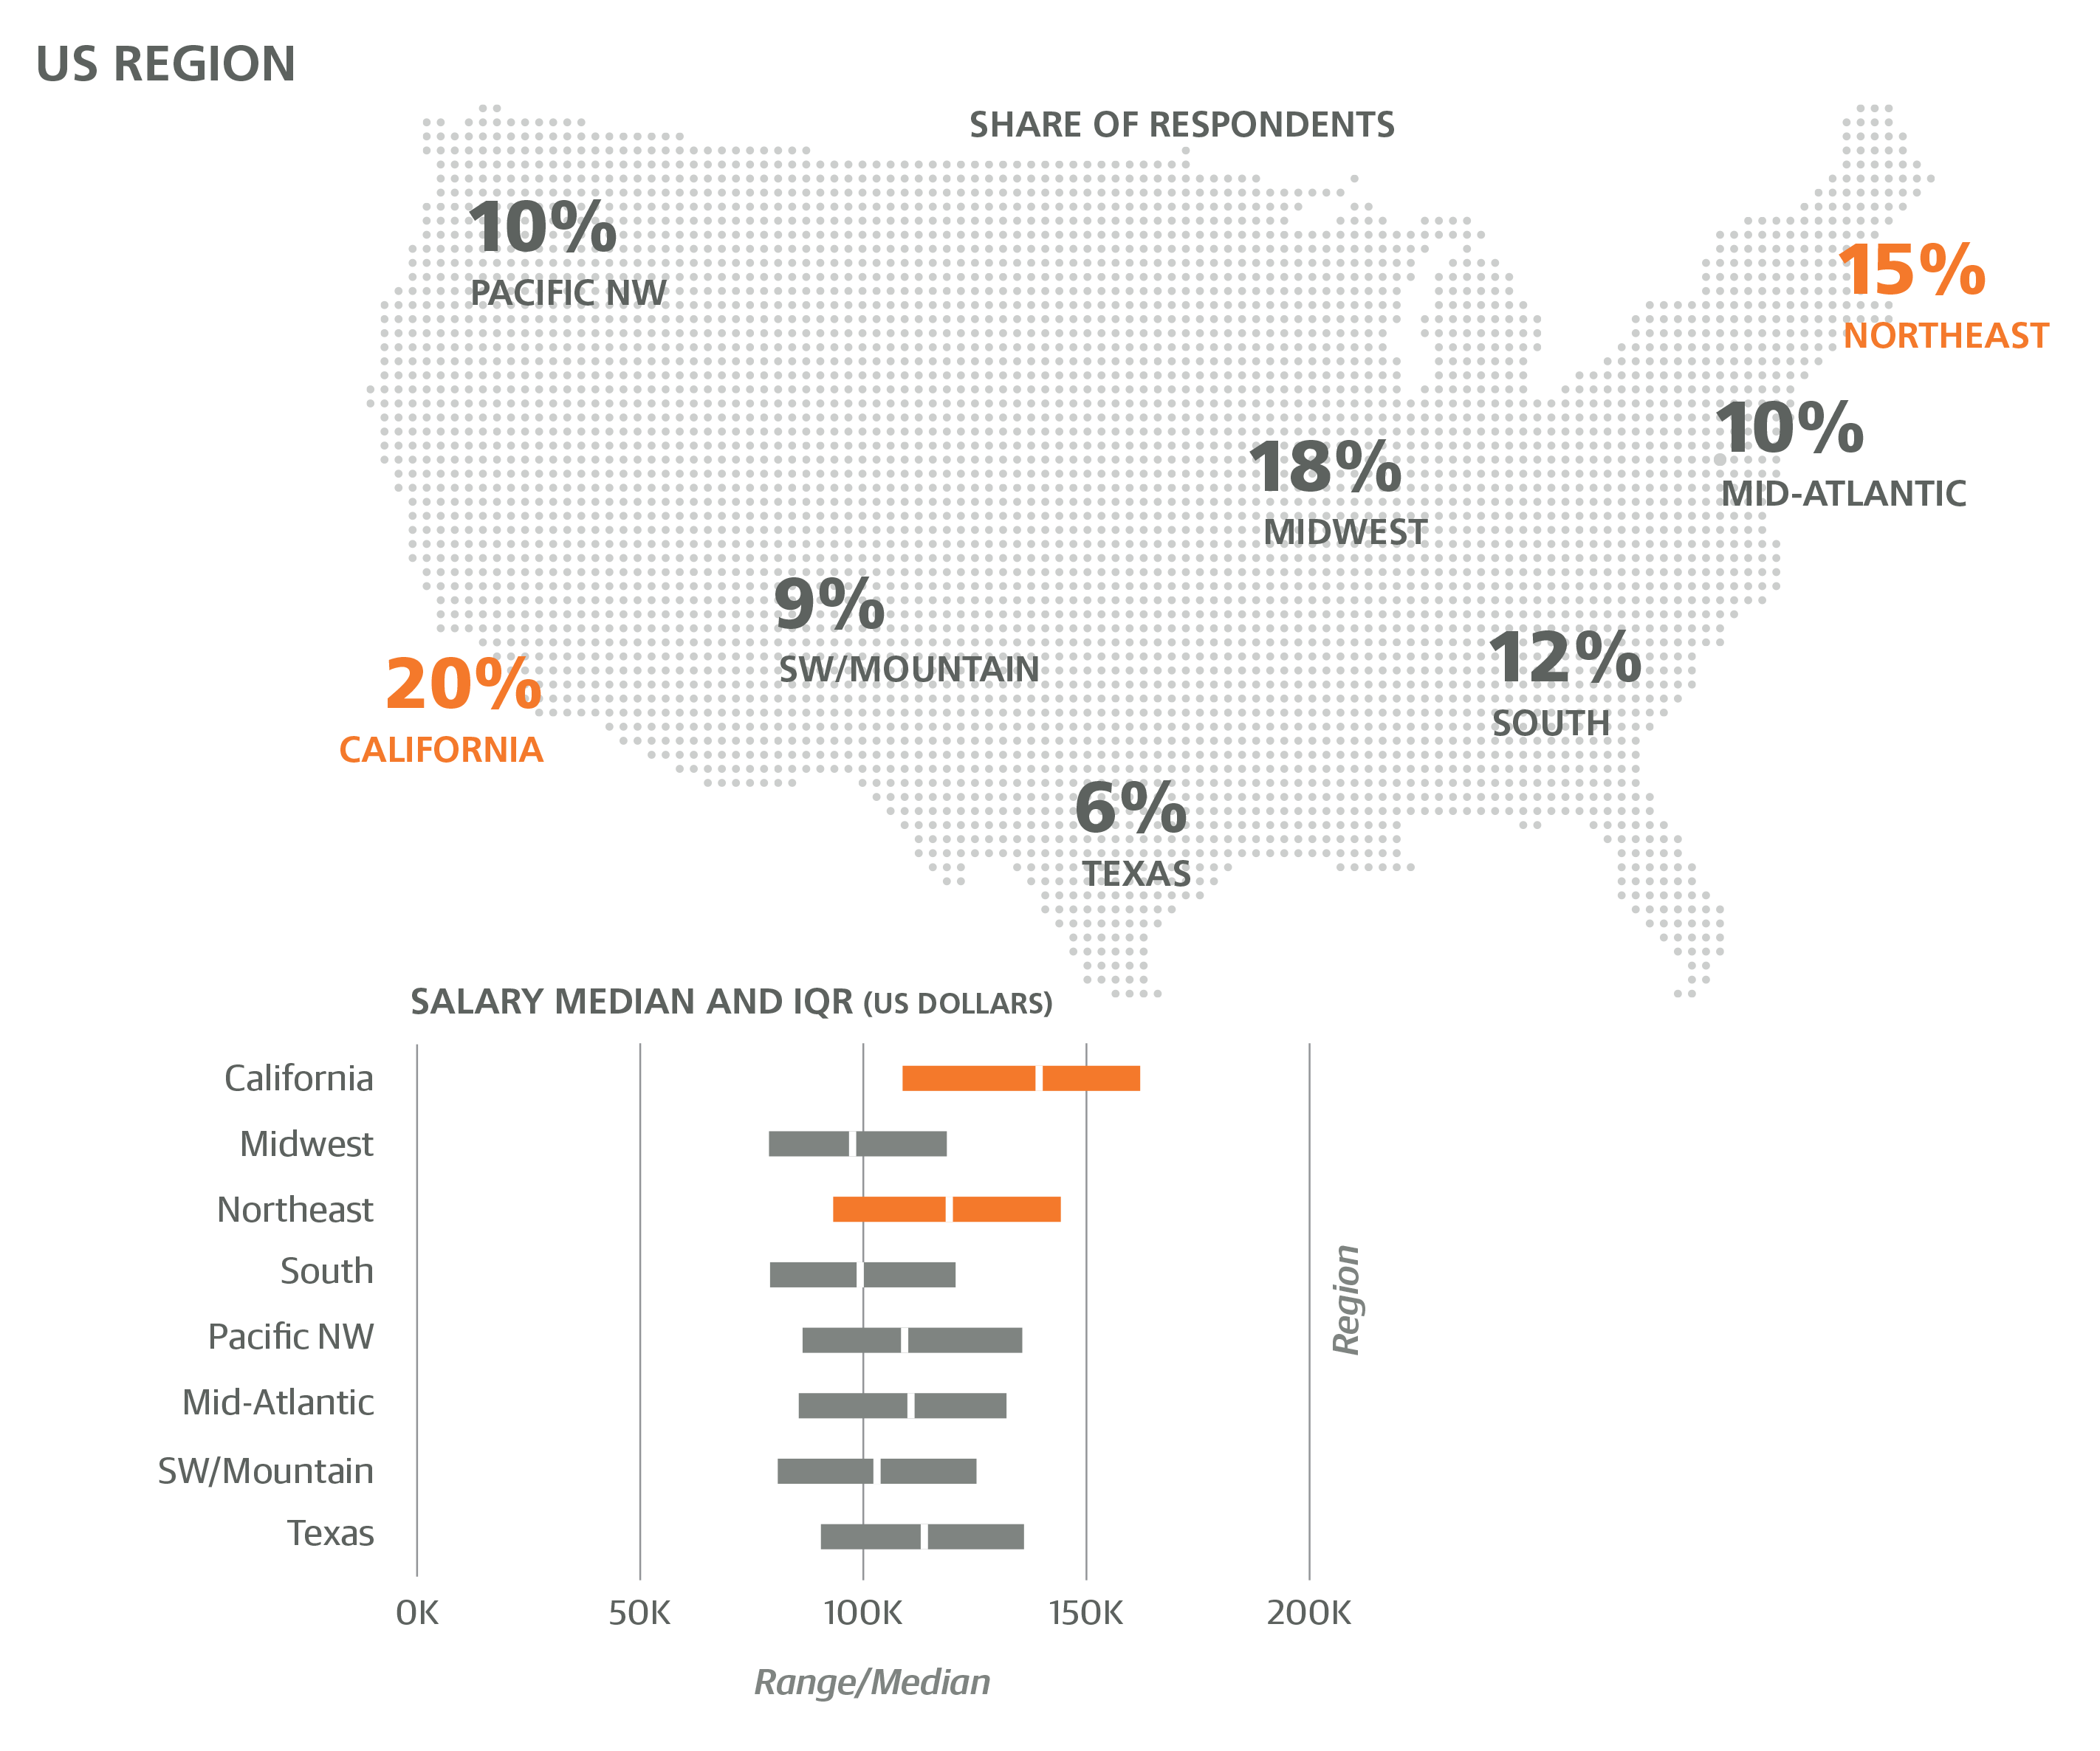
Within the US, a disproportionate number of respondents came from the West, in particular from California, Oregon, and Washington: these three states made up 30% of all US respondents, even though they account for only 16% of the US population. They also had among the highest salaries (+$76,671 for CA, +$57,838 for OR/WA). Salaries in the Northeast US were higher (+$60,453) and in the Midwest lower (+$48,060) than the default US coefficient (+$52,778) that applies to the rest of the country.
A few differences in language use by country or region are worth pointing out. Many involve languages developed by Microsoft: ASP/ASP.NET, Visual Basic, and C#. Washington state had higher rates than average for C# (33%)—unsurprising, since this is where Microsoft is based—but so did the Midwest (28%), Florida (35%), and the UK (28%). Midwest respondents were also more likely to be ASP/ASP.NET users (17%) and Visual Basic users (8%). C#/ASP.NET/Visual Basic users were sparser among respondents from California (13%/6%/2%), the Northeast US (15%/8%/4%), and Germany (11%/3%/1%).
Aside from its lower rates of Microsoft developed languages, California stood out for its high usage of Python (35% vs. the sample-wide average of 28%), Objective-C (9% vs. 6%), and Go (7% vs. 4%)—interestingly, the original developers of all three languages are based in California. PHP was used relatively little by the CA cohort (13%), compared to, for example, 21% among respondents from Continental Europe. In contrast, Ruby was much more common among US respondents (16%) than non-US DS respondents (11%).
Company Types
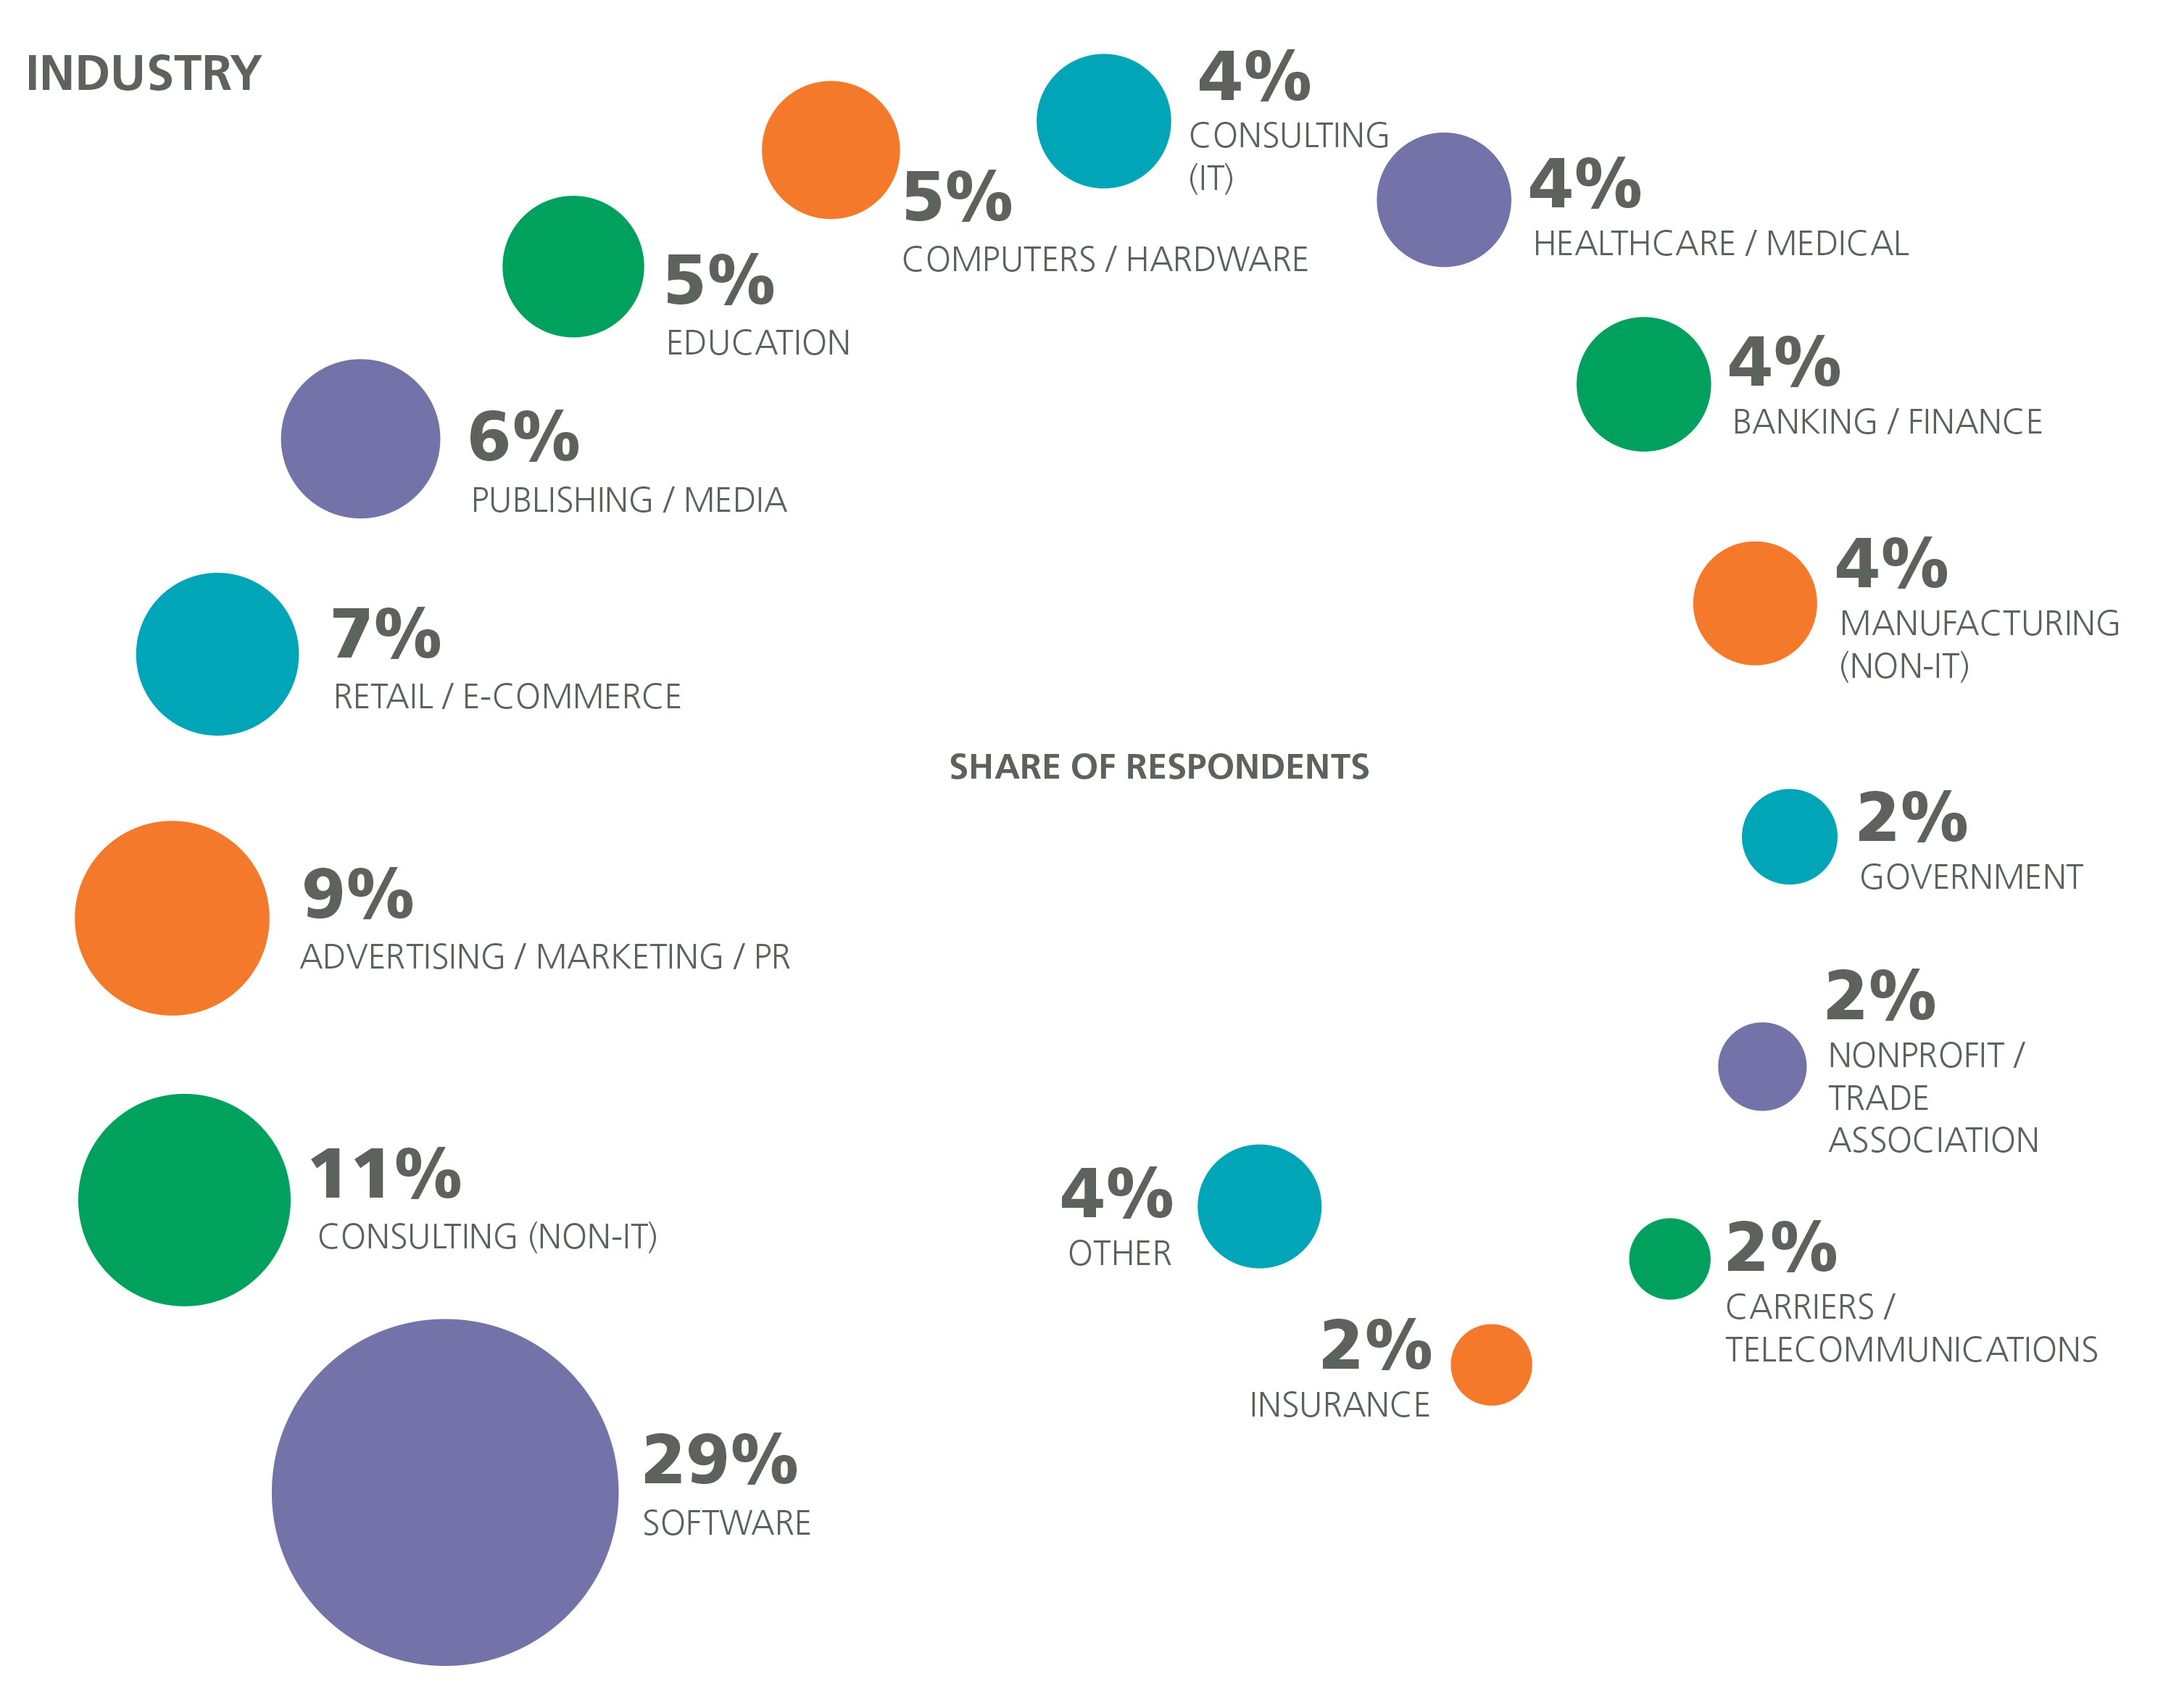
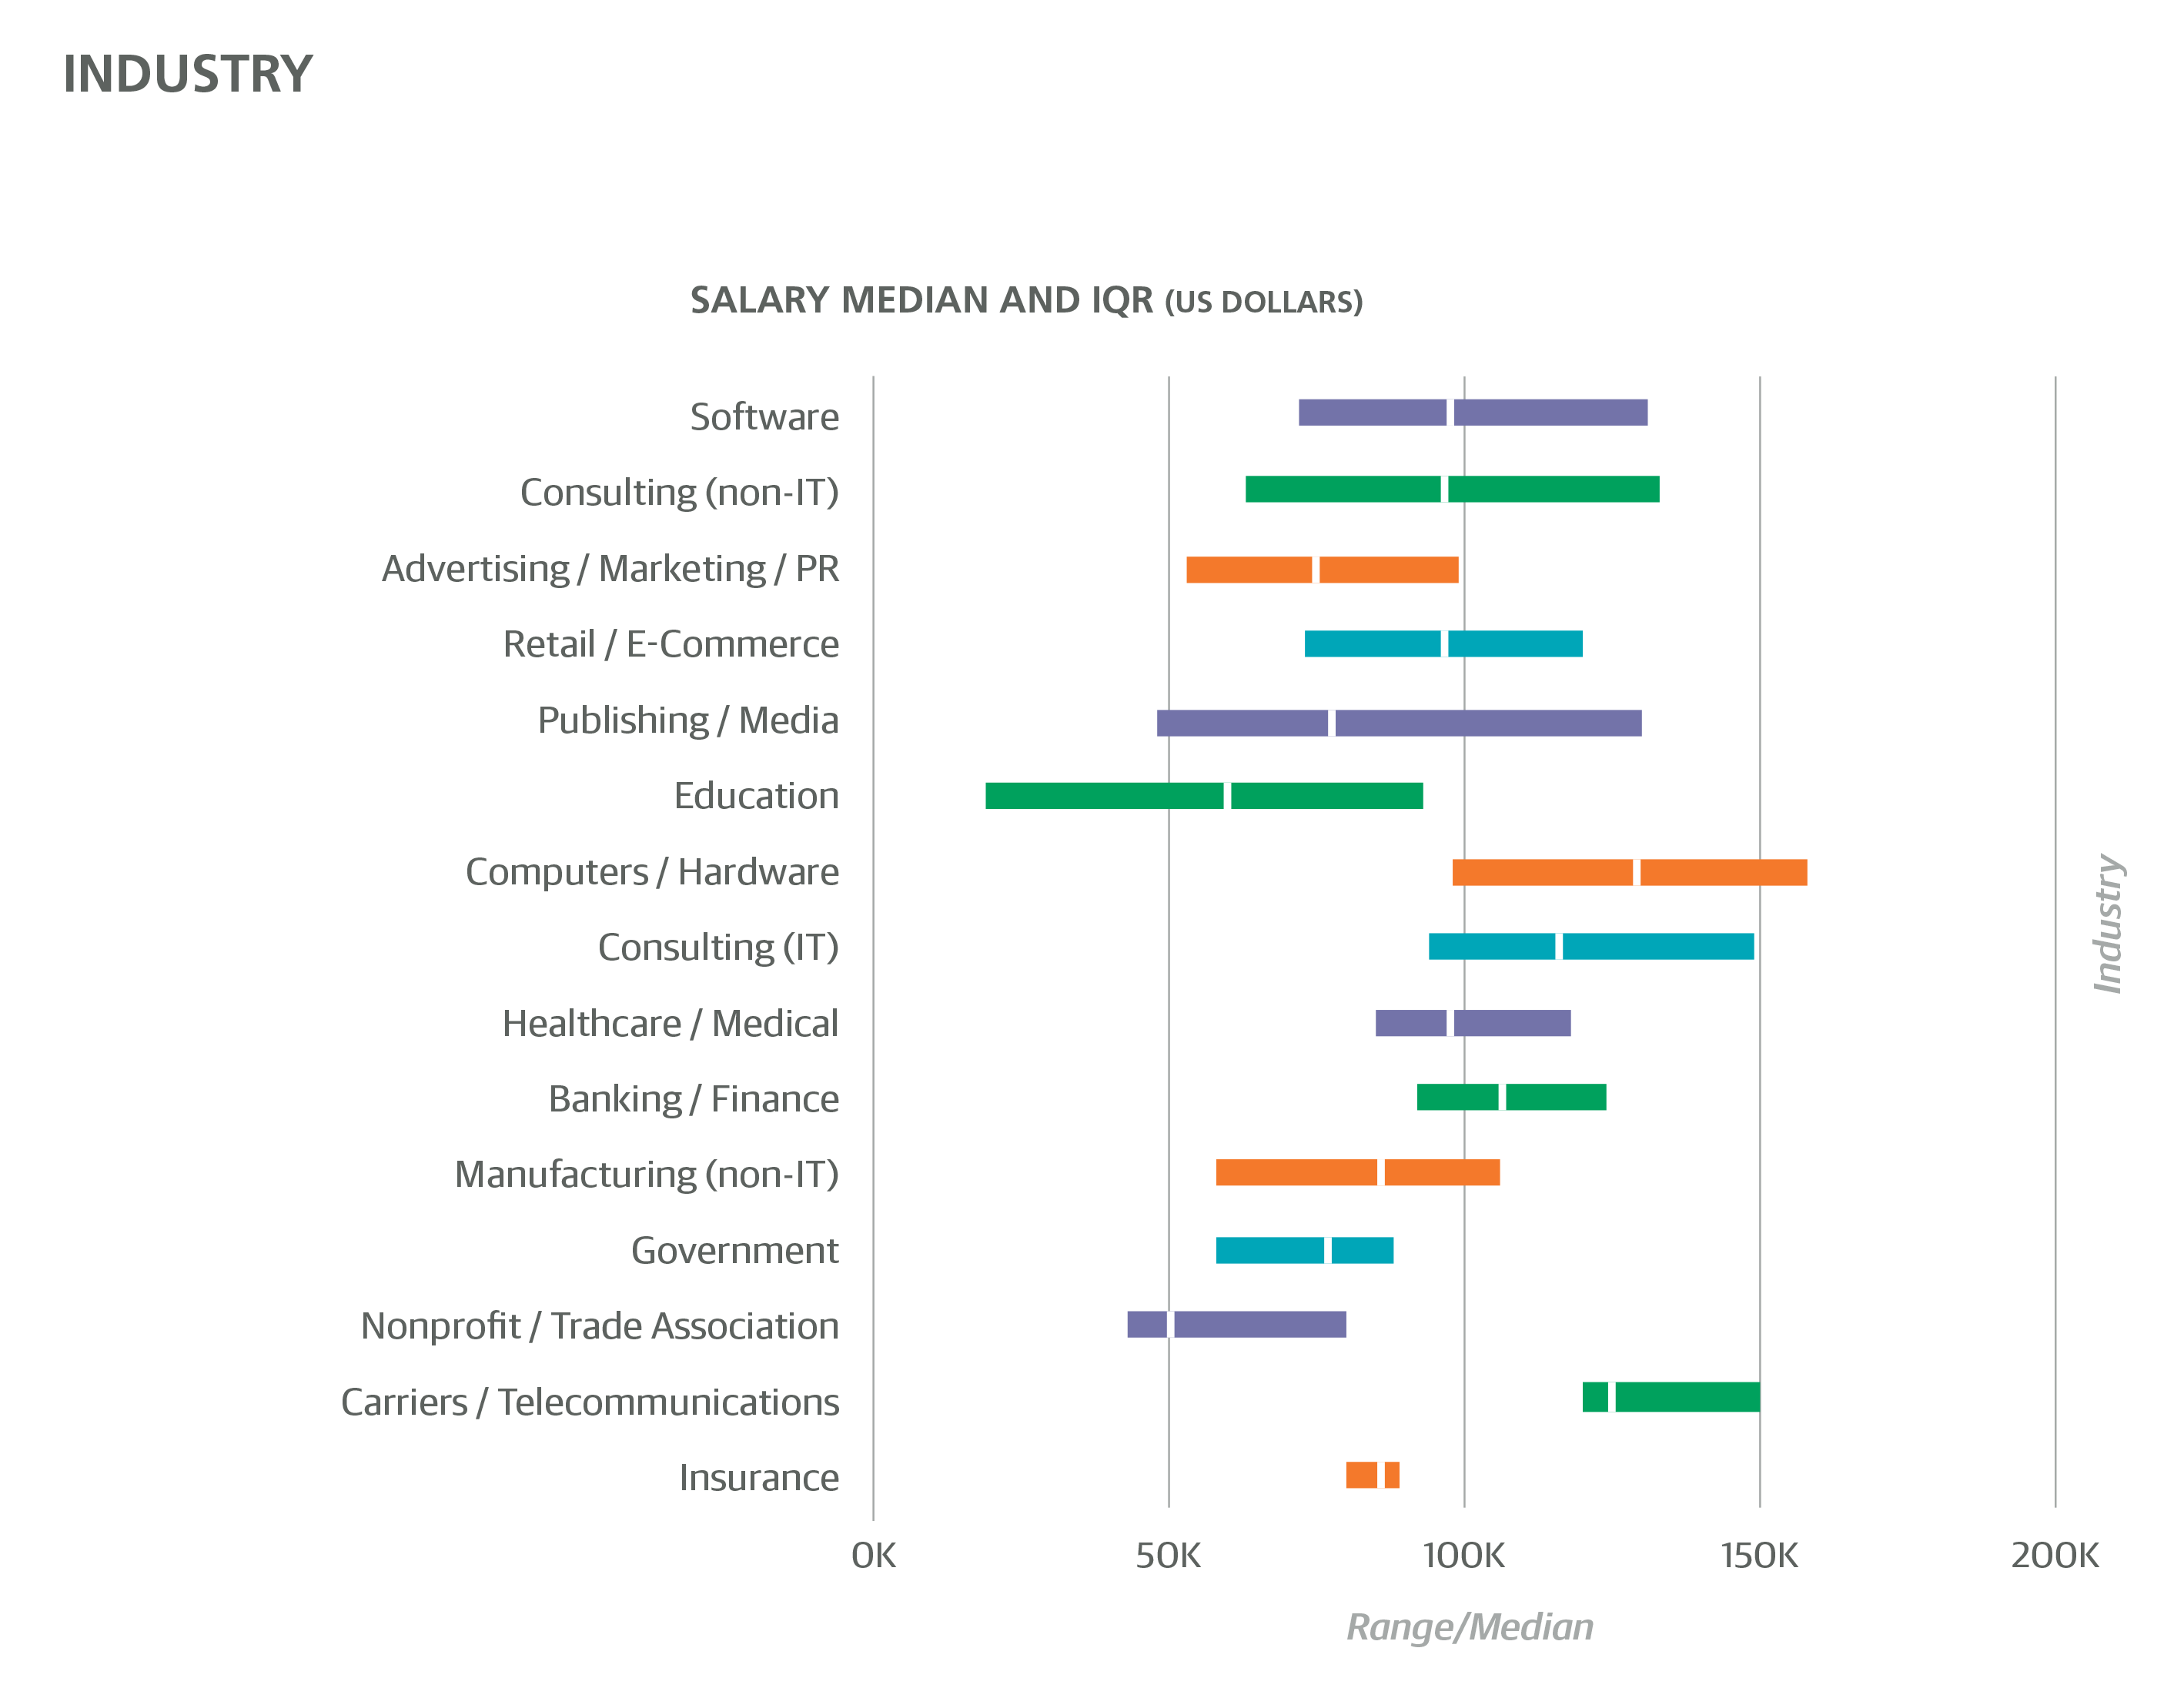
The Salary Survey included questions on industry, company size, and company age. Software was the most well-represented industry (32%; 38% when including Cloud Services, Security, and Search/Social Networking), followed by consulting (10%) and Banking/Finance (6%). Banking/Finance respondents had a median salary of $105K (and a model coefficient of +$11,367). The only industries with a higher median salary were Computers/Hardware ($115K), Cloud Services ($108K), Security ($115K), and Search/Social Networking ($125K), although among these only Search/Social Networking had a model coefficient (+$10,891). The other industries with high median salaries do not have coefficients because other features do a better job explaining the high salaries; for example, a high percentage of Computer/Hardware respondents came from California (27%). The only industry with a negative coefficient was Education (–$11,812).
IT Consulting (but not non-IT consulting) had a positive coefficient (+$4,528), and combined with the +$13,822 coefficient for self-employment (i.e., company size equals one) paints a favorable picture of solo consulting (1% of the sample were self-employed consultants), although it should be noted that these coefficients may simply be offsetting further coefficients such as the one for team size, which favors larger teams.
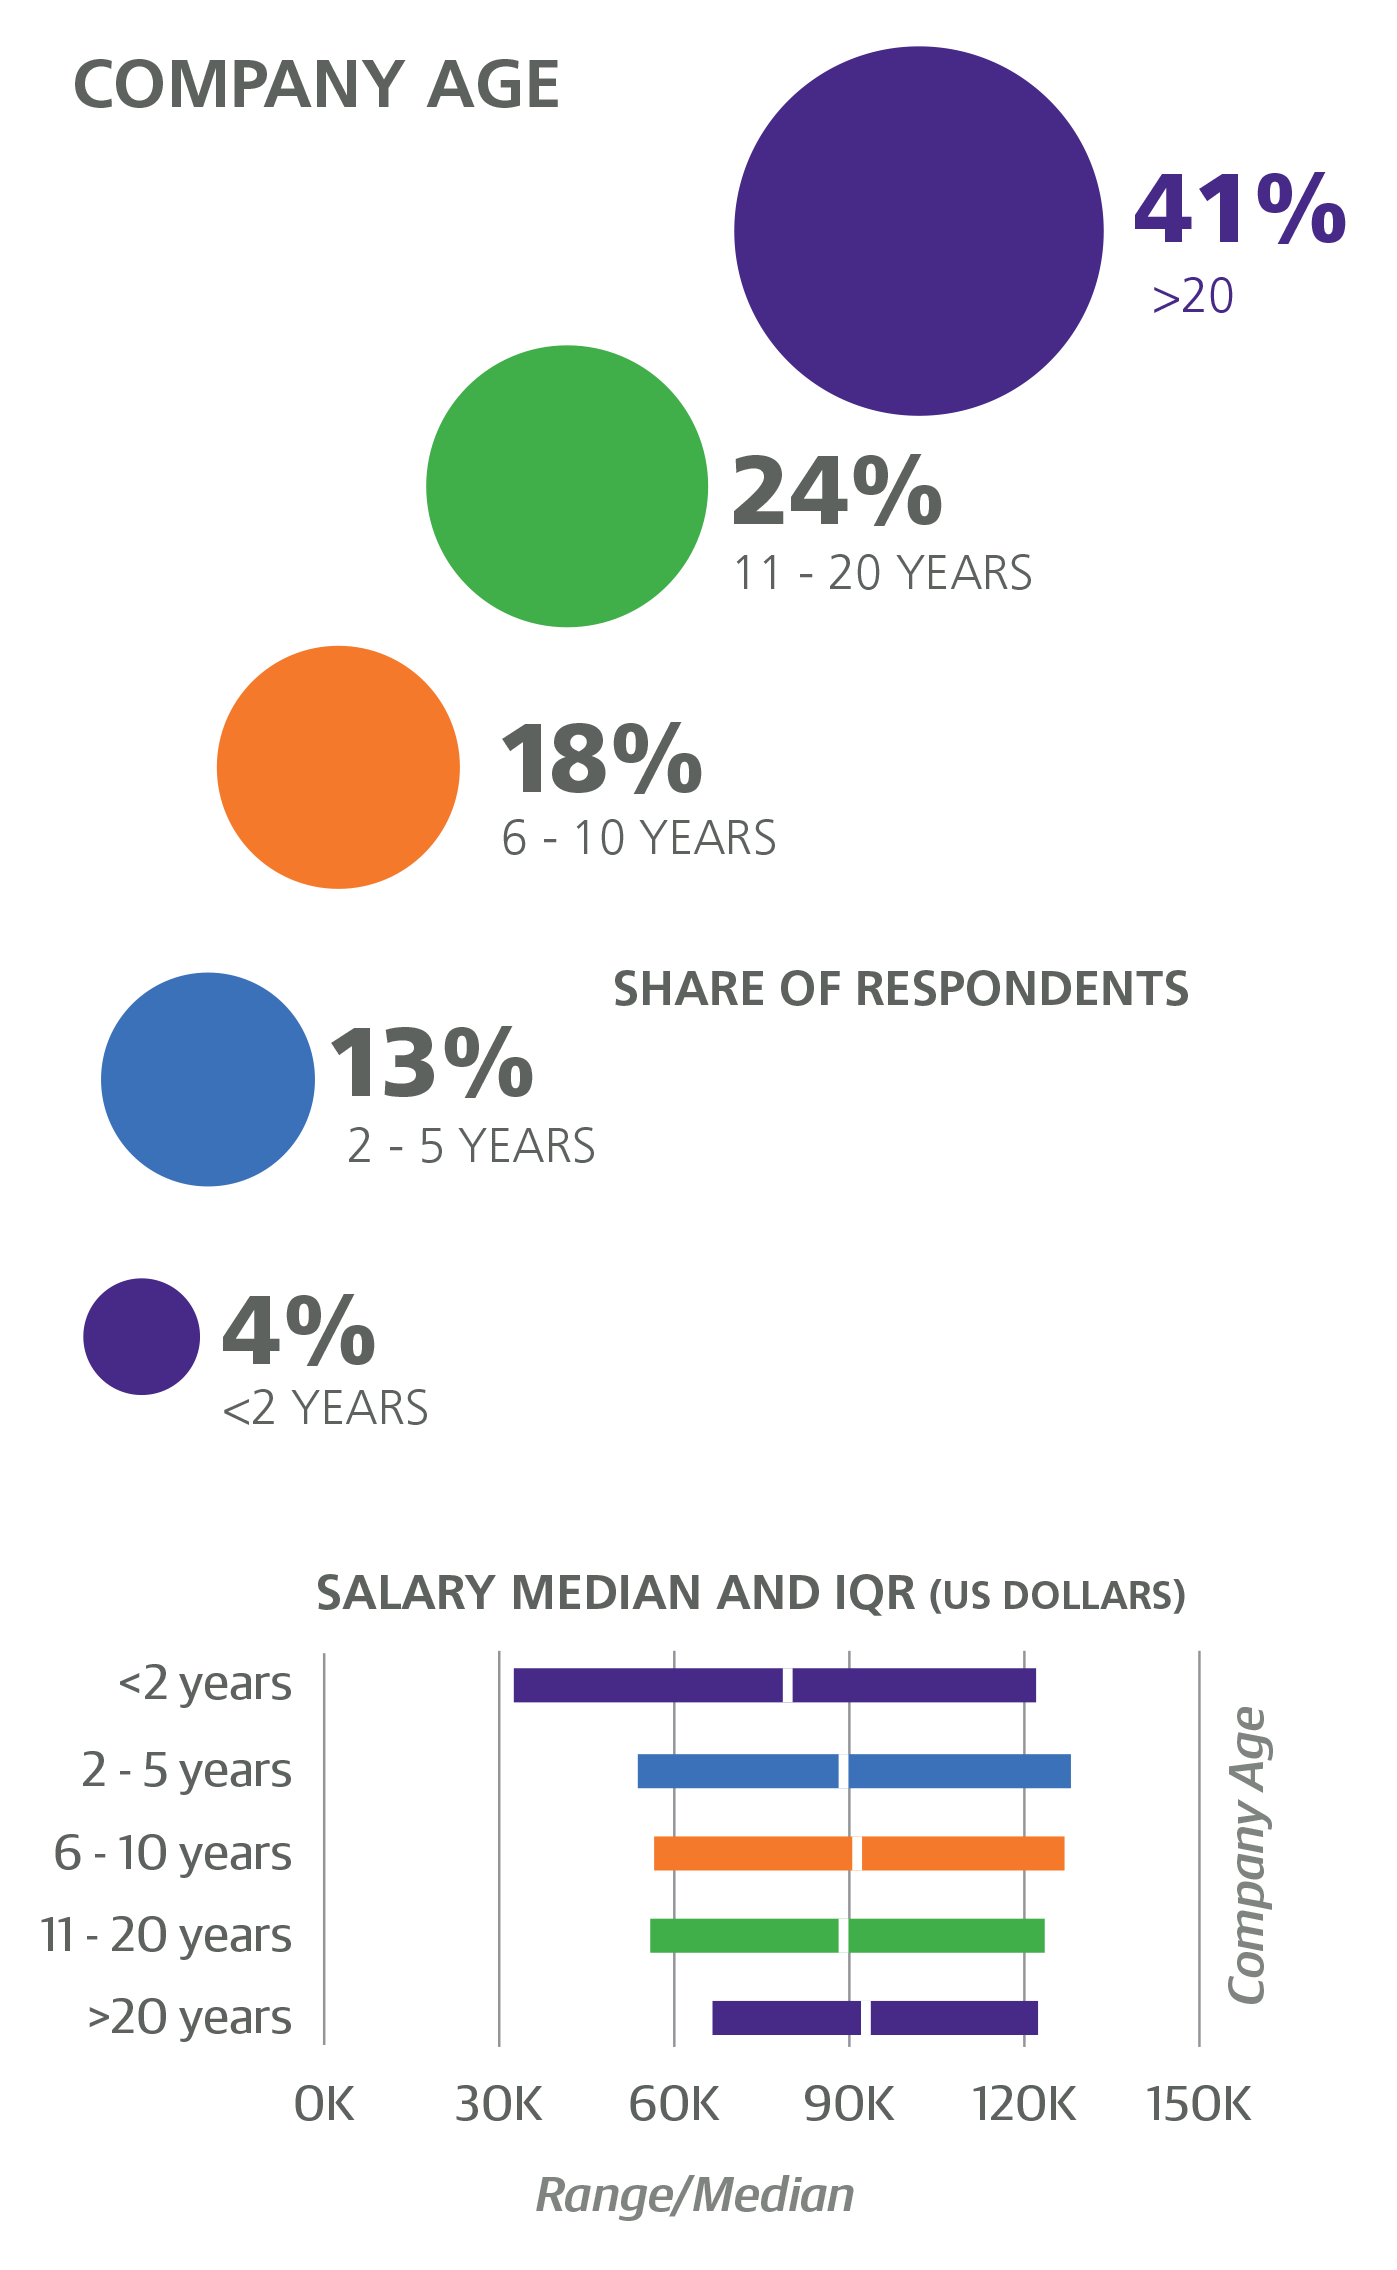
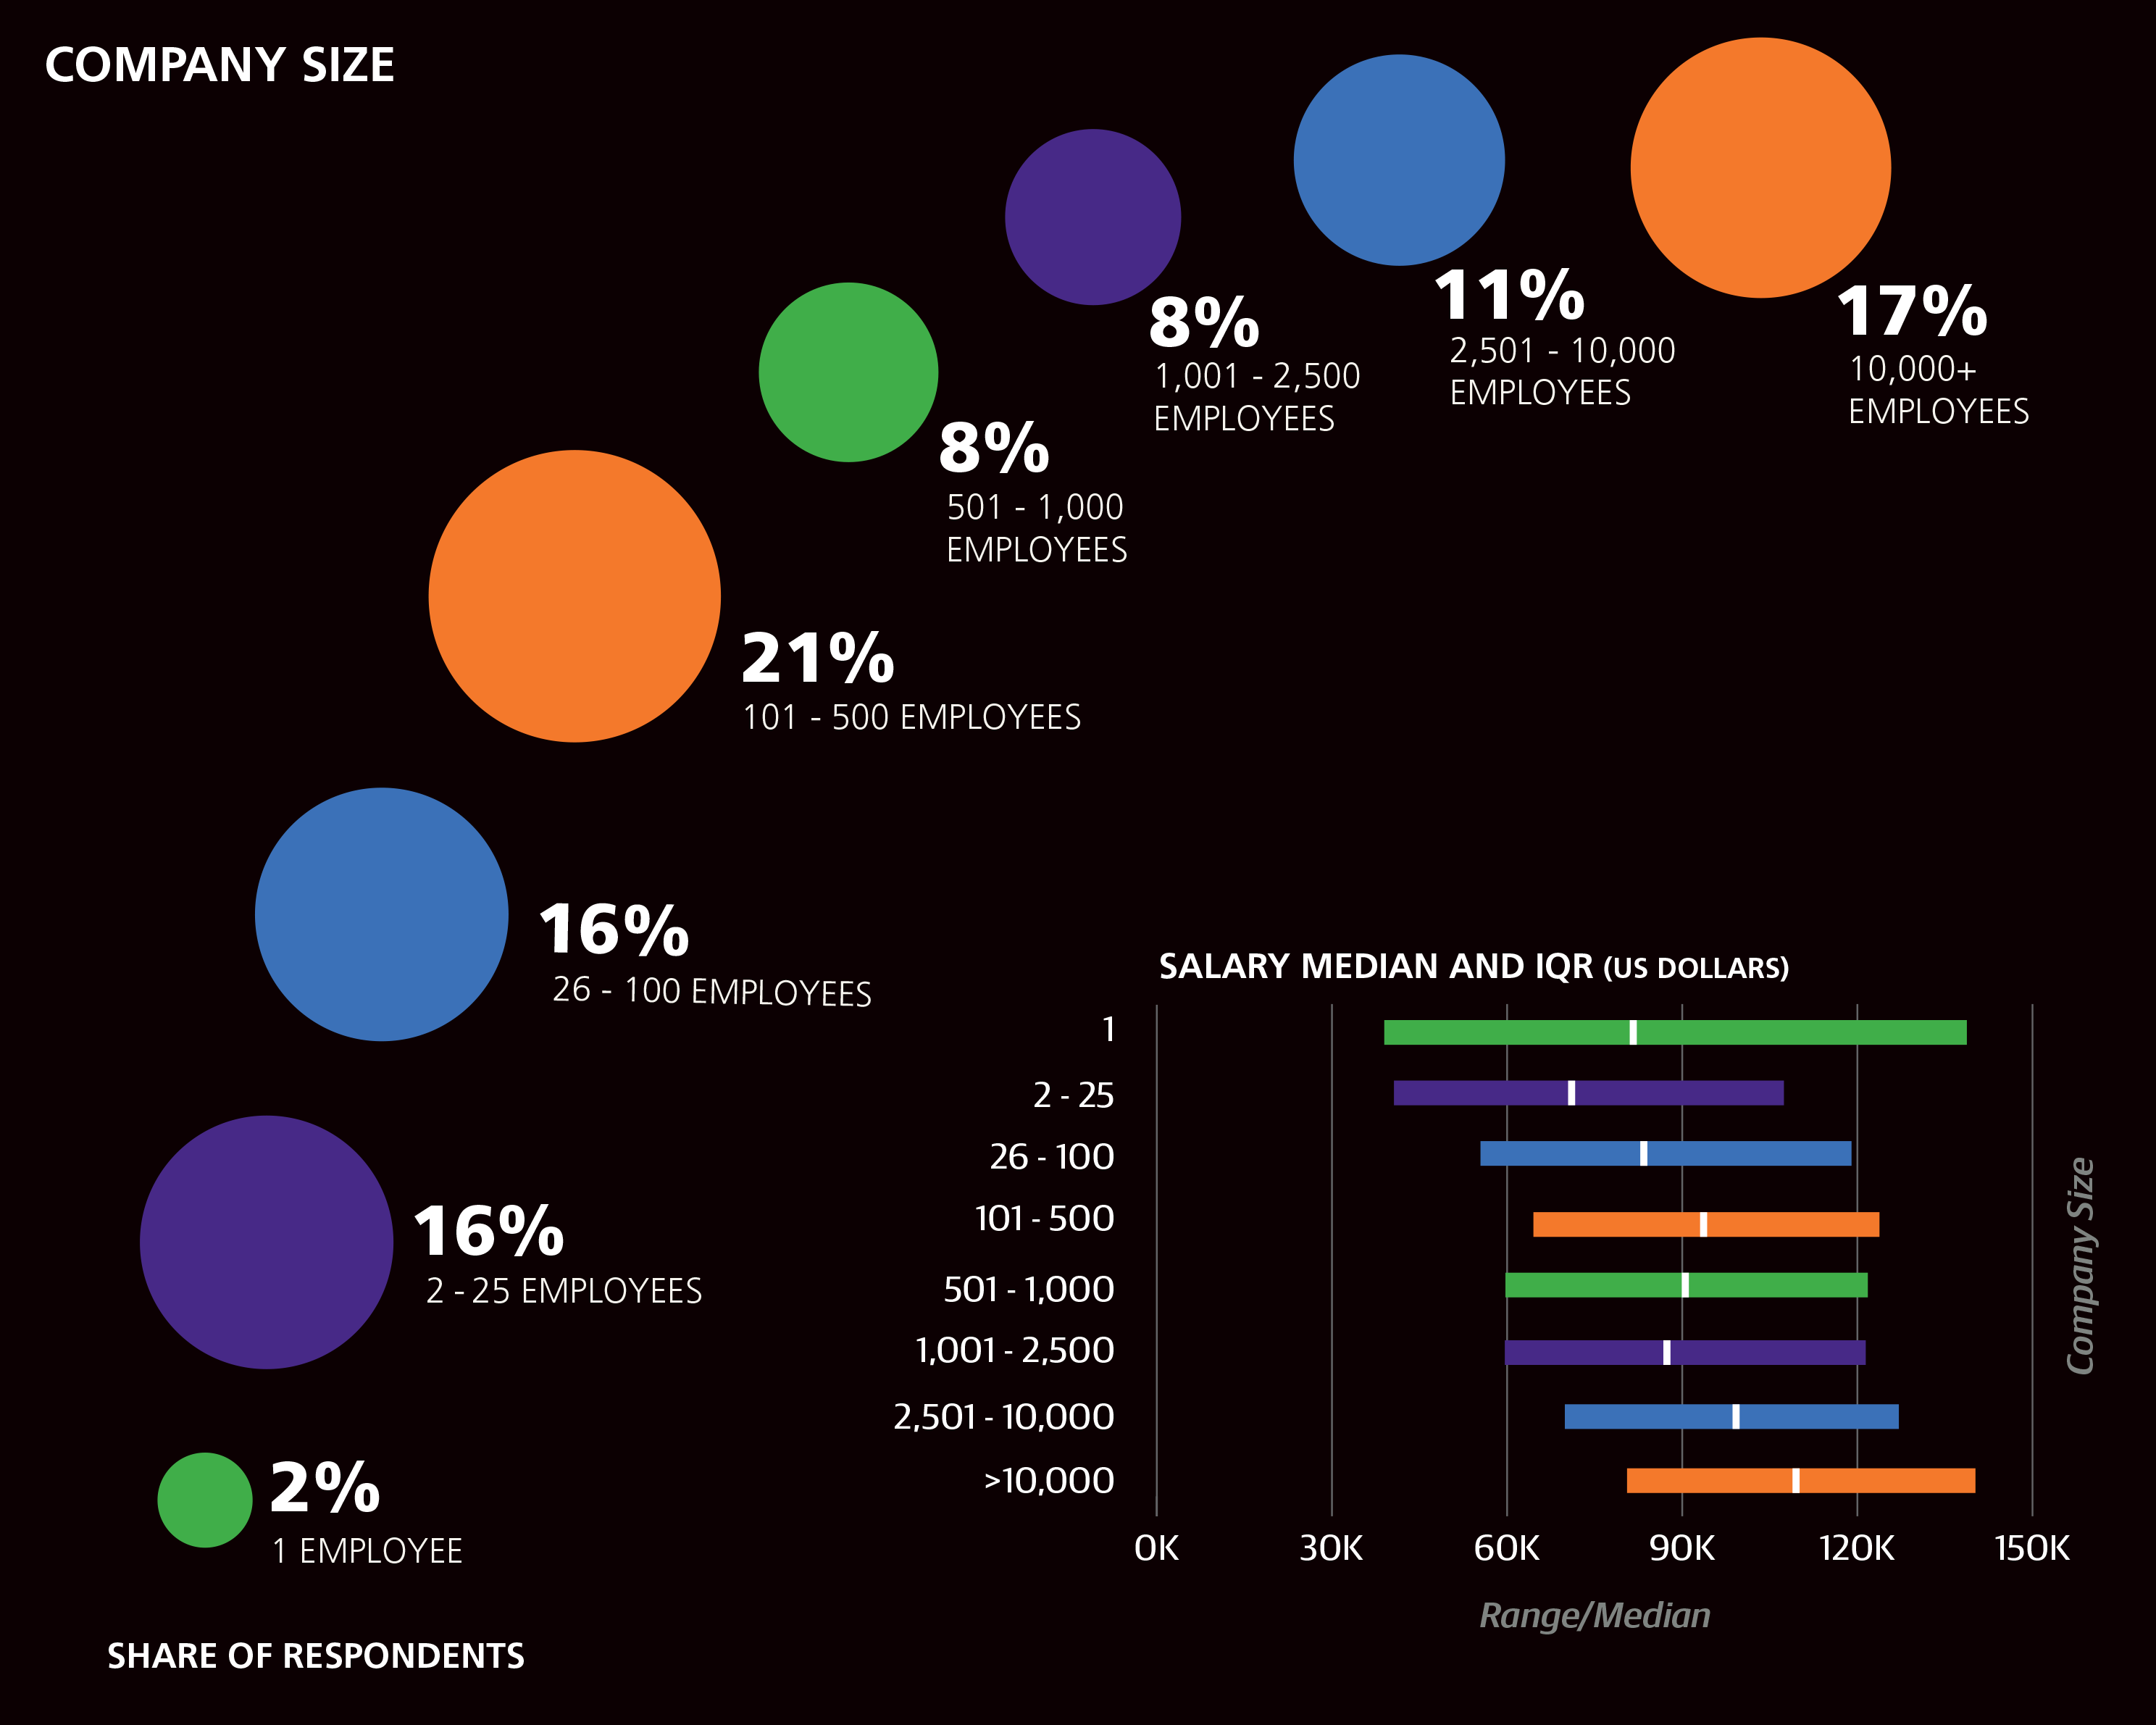
Very large companies (over 10,000 employees) made up 17% of the sample and had median salary of $108K and a coefficient of +$6,801. Old companies (over 20 years old) made up 41% of the sample, and although respondents from these companies had a higher median salary ($93K) than respondents from younger companies, company age over 20 years had a negative coefficient (–$6,279). While company size and age correlate (larger companies tend to be older), the exceptions to this pattern highlight why the above coefficients were chosen: respondents from large, young companies had a median salary of $114K (2% of the sample), while respondents from small, old companies had a median salary of $86K (26% of the sample). Further salary distinctions among companies by age (e.g., early vs. mature startups) were subtle enough to be ignored by the model. One hypothesis to test is whether large, young companies in the sample are more software driven than older companies, and, therefore, willing to pay a premium for developer resources.
Some language differences were present with company size and age. Respondents from large companies (>10K employees) had higher usage rates of Perl 5 (10% vs. 5% among respondents of smaller companies), Java (45% vs. 32%), and C/C++ (23% vs. 17%). In contrast, respondents from very small companies (2–25 employees) had higher rates of Objective-C (8% vs. 5% at larger companies), JavaScript (63% vs. 54%), HTML (60% vs. 50%), and PHP (26% vs. 15%). Respondents from startups (company age less than 2 years) were more likely to use Clojure (5% vs. 2%), and respondents from old companies were more likely to use ASP/ASP.NET (14% for companies over 10 years old vs. 6% for companies younger than 6 years).
Team Structure
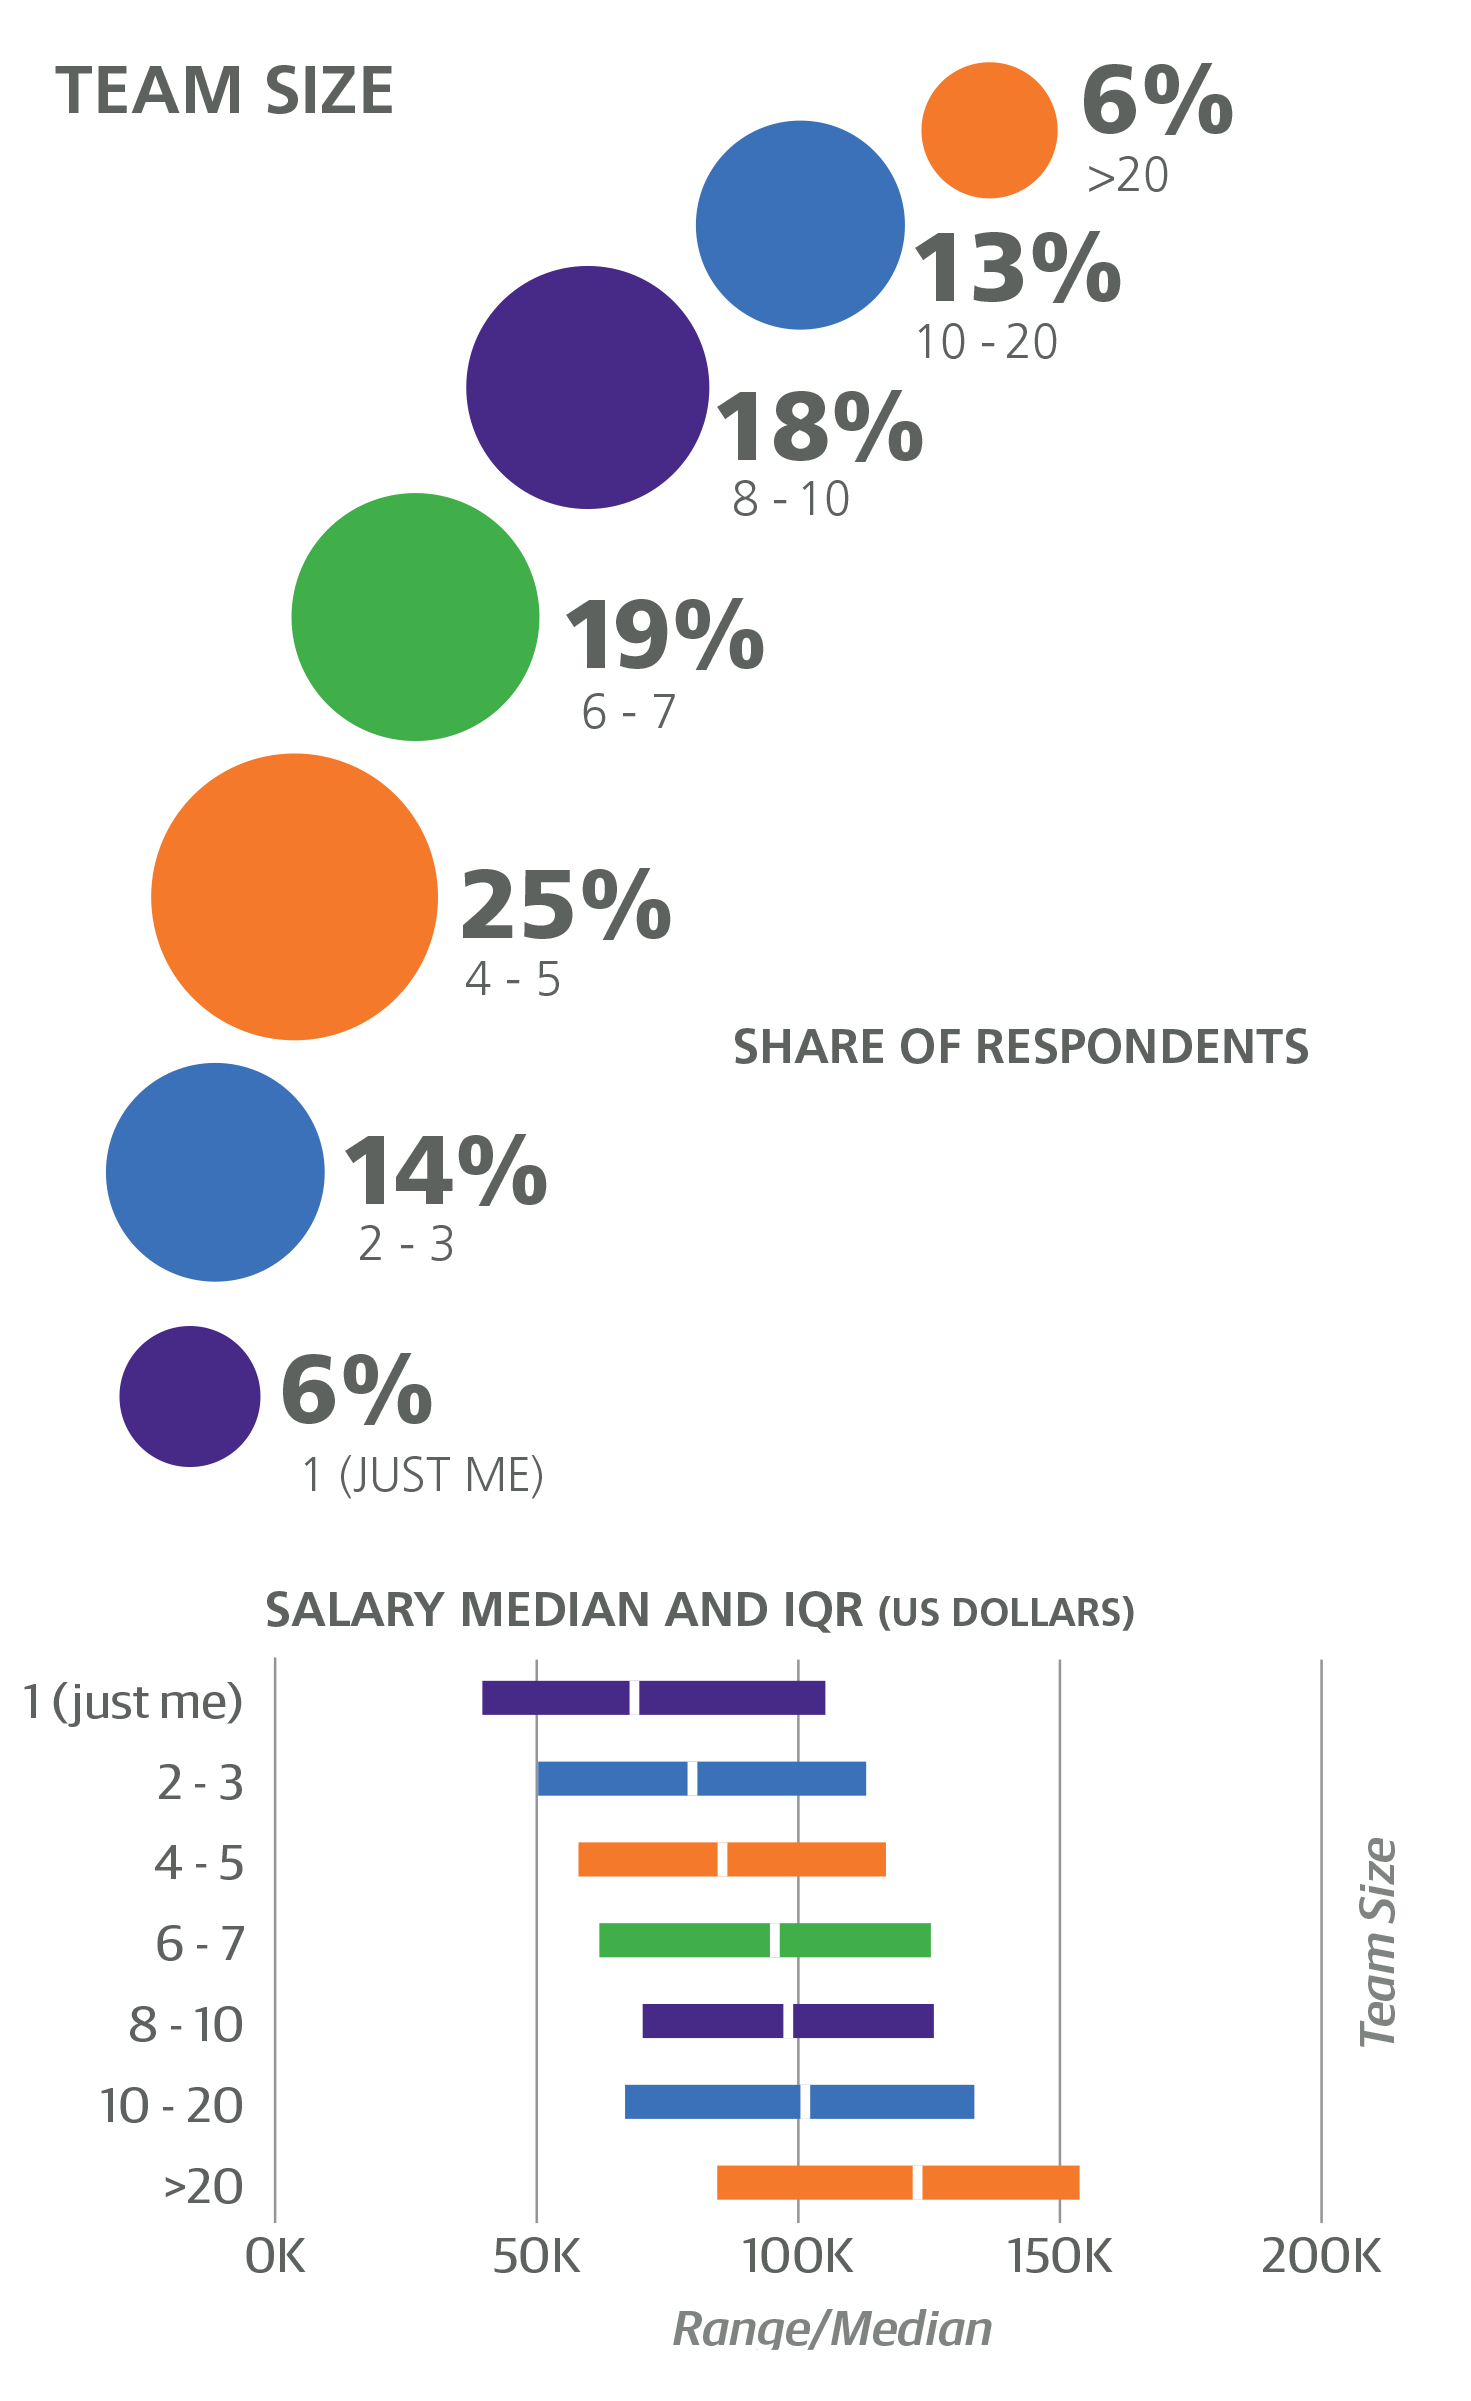
Several questions on the survey focused on the team structure, the most basic of which was how many people work on the respondent’s team. Salary appears to steadily increase with team size, and with this variable the coefficient is not binary but multiplicative, equal to +$445 times the number of team members. Since team size correlates with company size,1 this further accentuates the expected salary boost for large-company employees, but, as with company age, it is instructive to look at the exceptions to this pattern. Two subsamples suffice as an illustration: the 437 respondents at companies with more than 500 employees and on teams with fewer than 5 members had a median salary of $87K; in contrast, the 119 respondents at companies with fewer than 500 employees and on teams with at least 15 members had a median salary of $119K.
A slightly different team metric is the size of a team for a typical coding project. The median project team size was 4, with 29% of the sample reporting their typical project team size to be over 5 people. No variables based on answers to this question were significant in the model.
Another question about team structure was whether the respondent worked with people in various roles. Most respondents reported that they work with (other) programmers (88%), product managers (74%), and designers (61%), while 33% said they work with salespeople. The only variable from this question with a positive coefficient was data scientists/analysts: the 34% of the sample who worked with data scientists/analysts earned a median salary of $101K, motivating a coefficient of +$2,365. The small share of respondents (4%) who did not work with people in any of the above roles had a median salary of $68K, and this also is expressed in a coefficient, of –$6,995. In other words, people in roles that require less communication, and particularly interdisciplinary communication, are expected to earn significantly less.
Individual Background: Gender, Age, Education
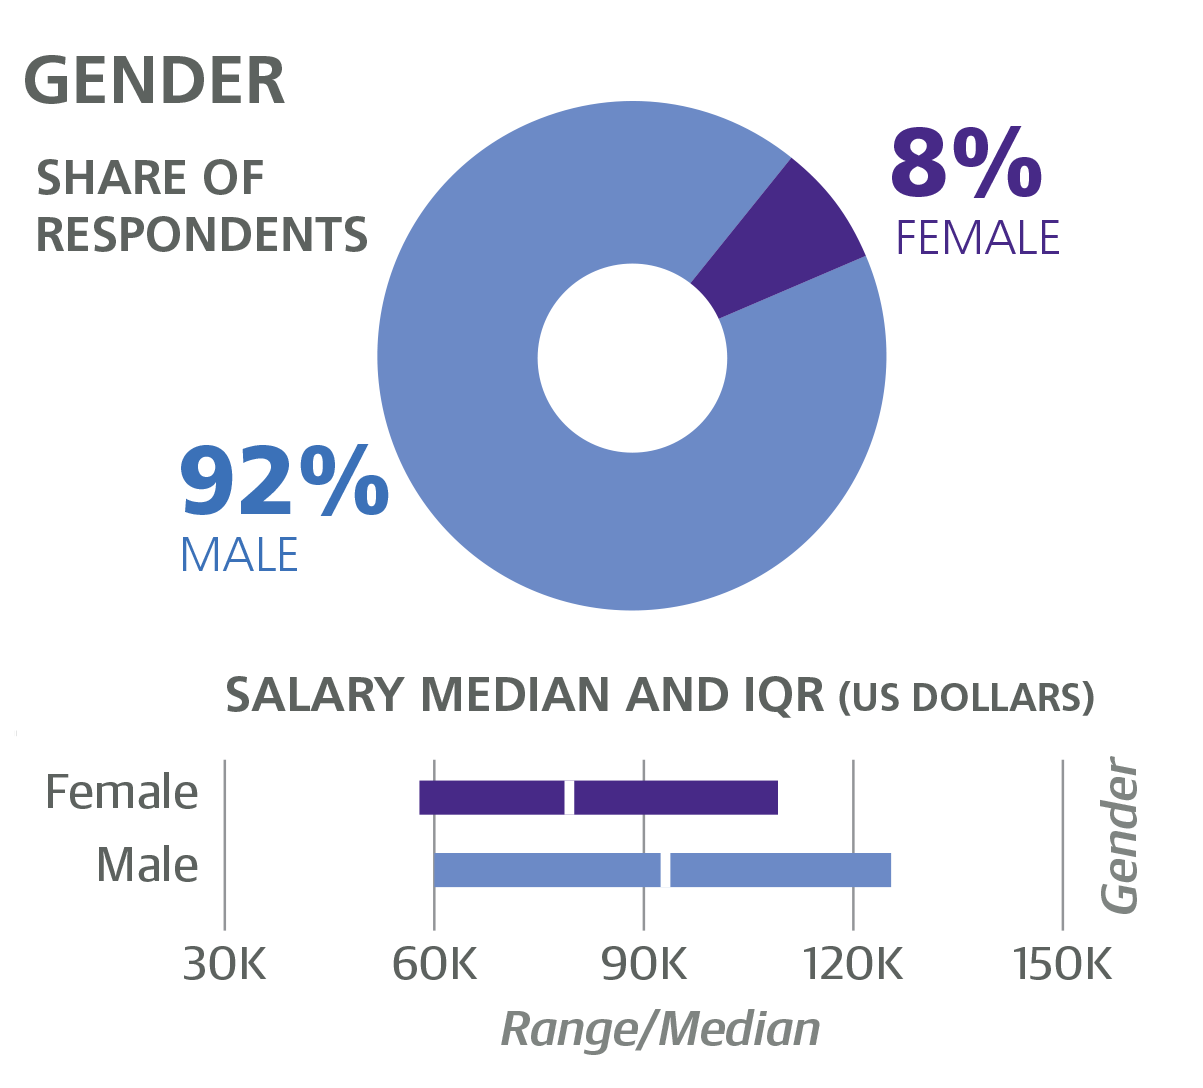
We now move on to details about individual respondents. The sample was overwhelmingly male (91%), and women in the sample earned less than men: women had a median salary of $80K, compared to $93K for men. The fact that the $13K gap is reduced to a coefficient of –$5,256K is not necessarily an improvement. The coefficient means that, all else held equal (role, location, experience), women earn approximately $5K less than men. The rest of the difference (about $8K) is at least partly attributable to the women in the sample tending to have fewer favorable variables associated with them: for example, only 10% of female respondents were “Senior” engineers or developers (17% of male respondents were). The difference in pay between men and women in this survey sample is similar to what we have seen in other salary surveys.
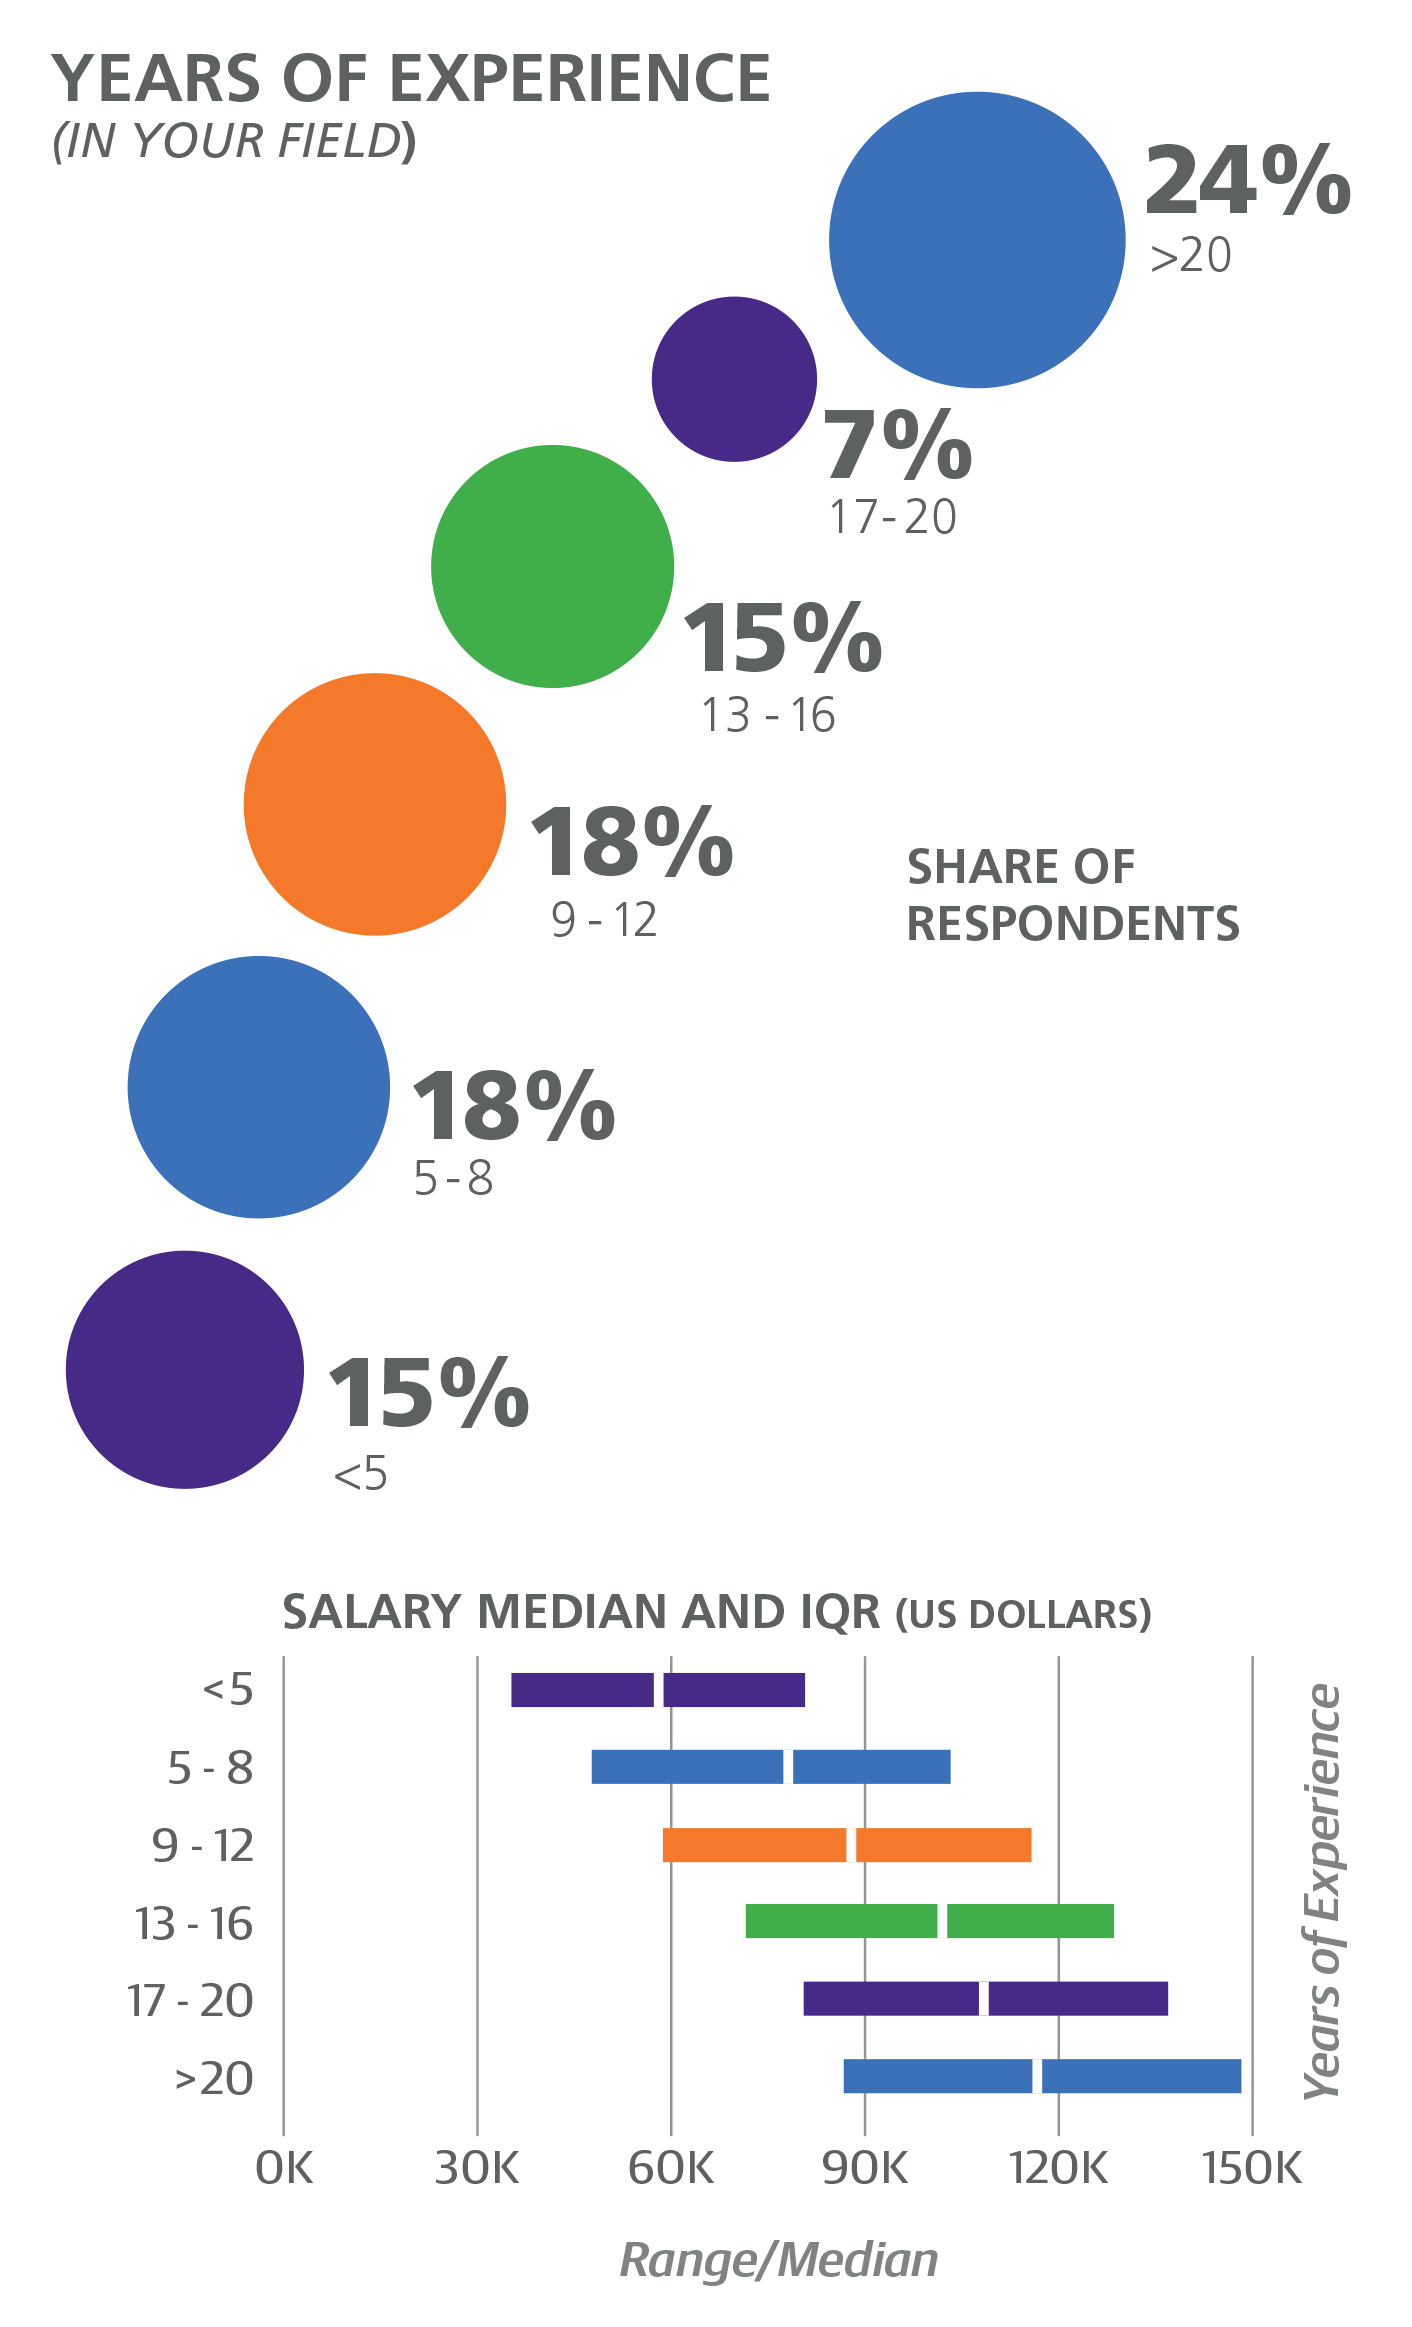
Over 60% of the sample was under 40, and salary did increase with age—the most well-paid demographic being the 46–50 cohort, earning a median of $112K (followed closely by those aged 56–60, who earned $111K). However, we asked about years of experience as well, and this appeared to be the actual predictor of salary: given a certain level of experience, age is no longer a factor and thus did not have any associated coefficients. According to the model, developers can expect an additional +$1,194 of pay per year, independent of title, role, and tasks—factors that the model shows affecting salary in different ways (see below).
As for education, a majority of respondents (52%) had an academic specialization in computer science, and 13% had a background in mathematics, statistics, or physics, but no particular specialization was significant in the model. Having a Master’s degree (of any discipline, but we assume most were in computer science or something technical) gives an estimated +$3,101 boost, and a PhD adds +$9,041 (which is potentially in addition to the Master’s coefficient). Respondents with a PhD were more likely to use Python (48% vs. 27% among non-PhD holders) and C/C++ (34% vs. 17%).

Title, Role, Tasks
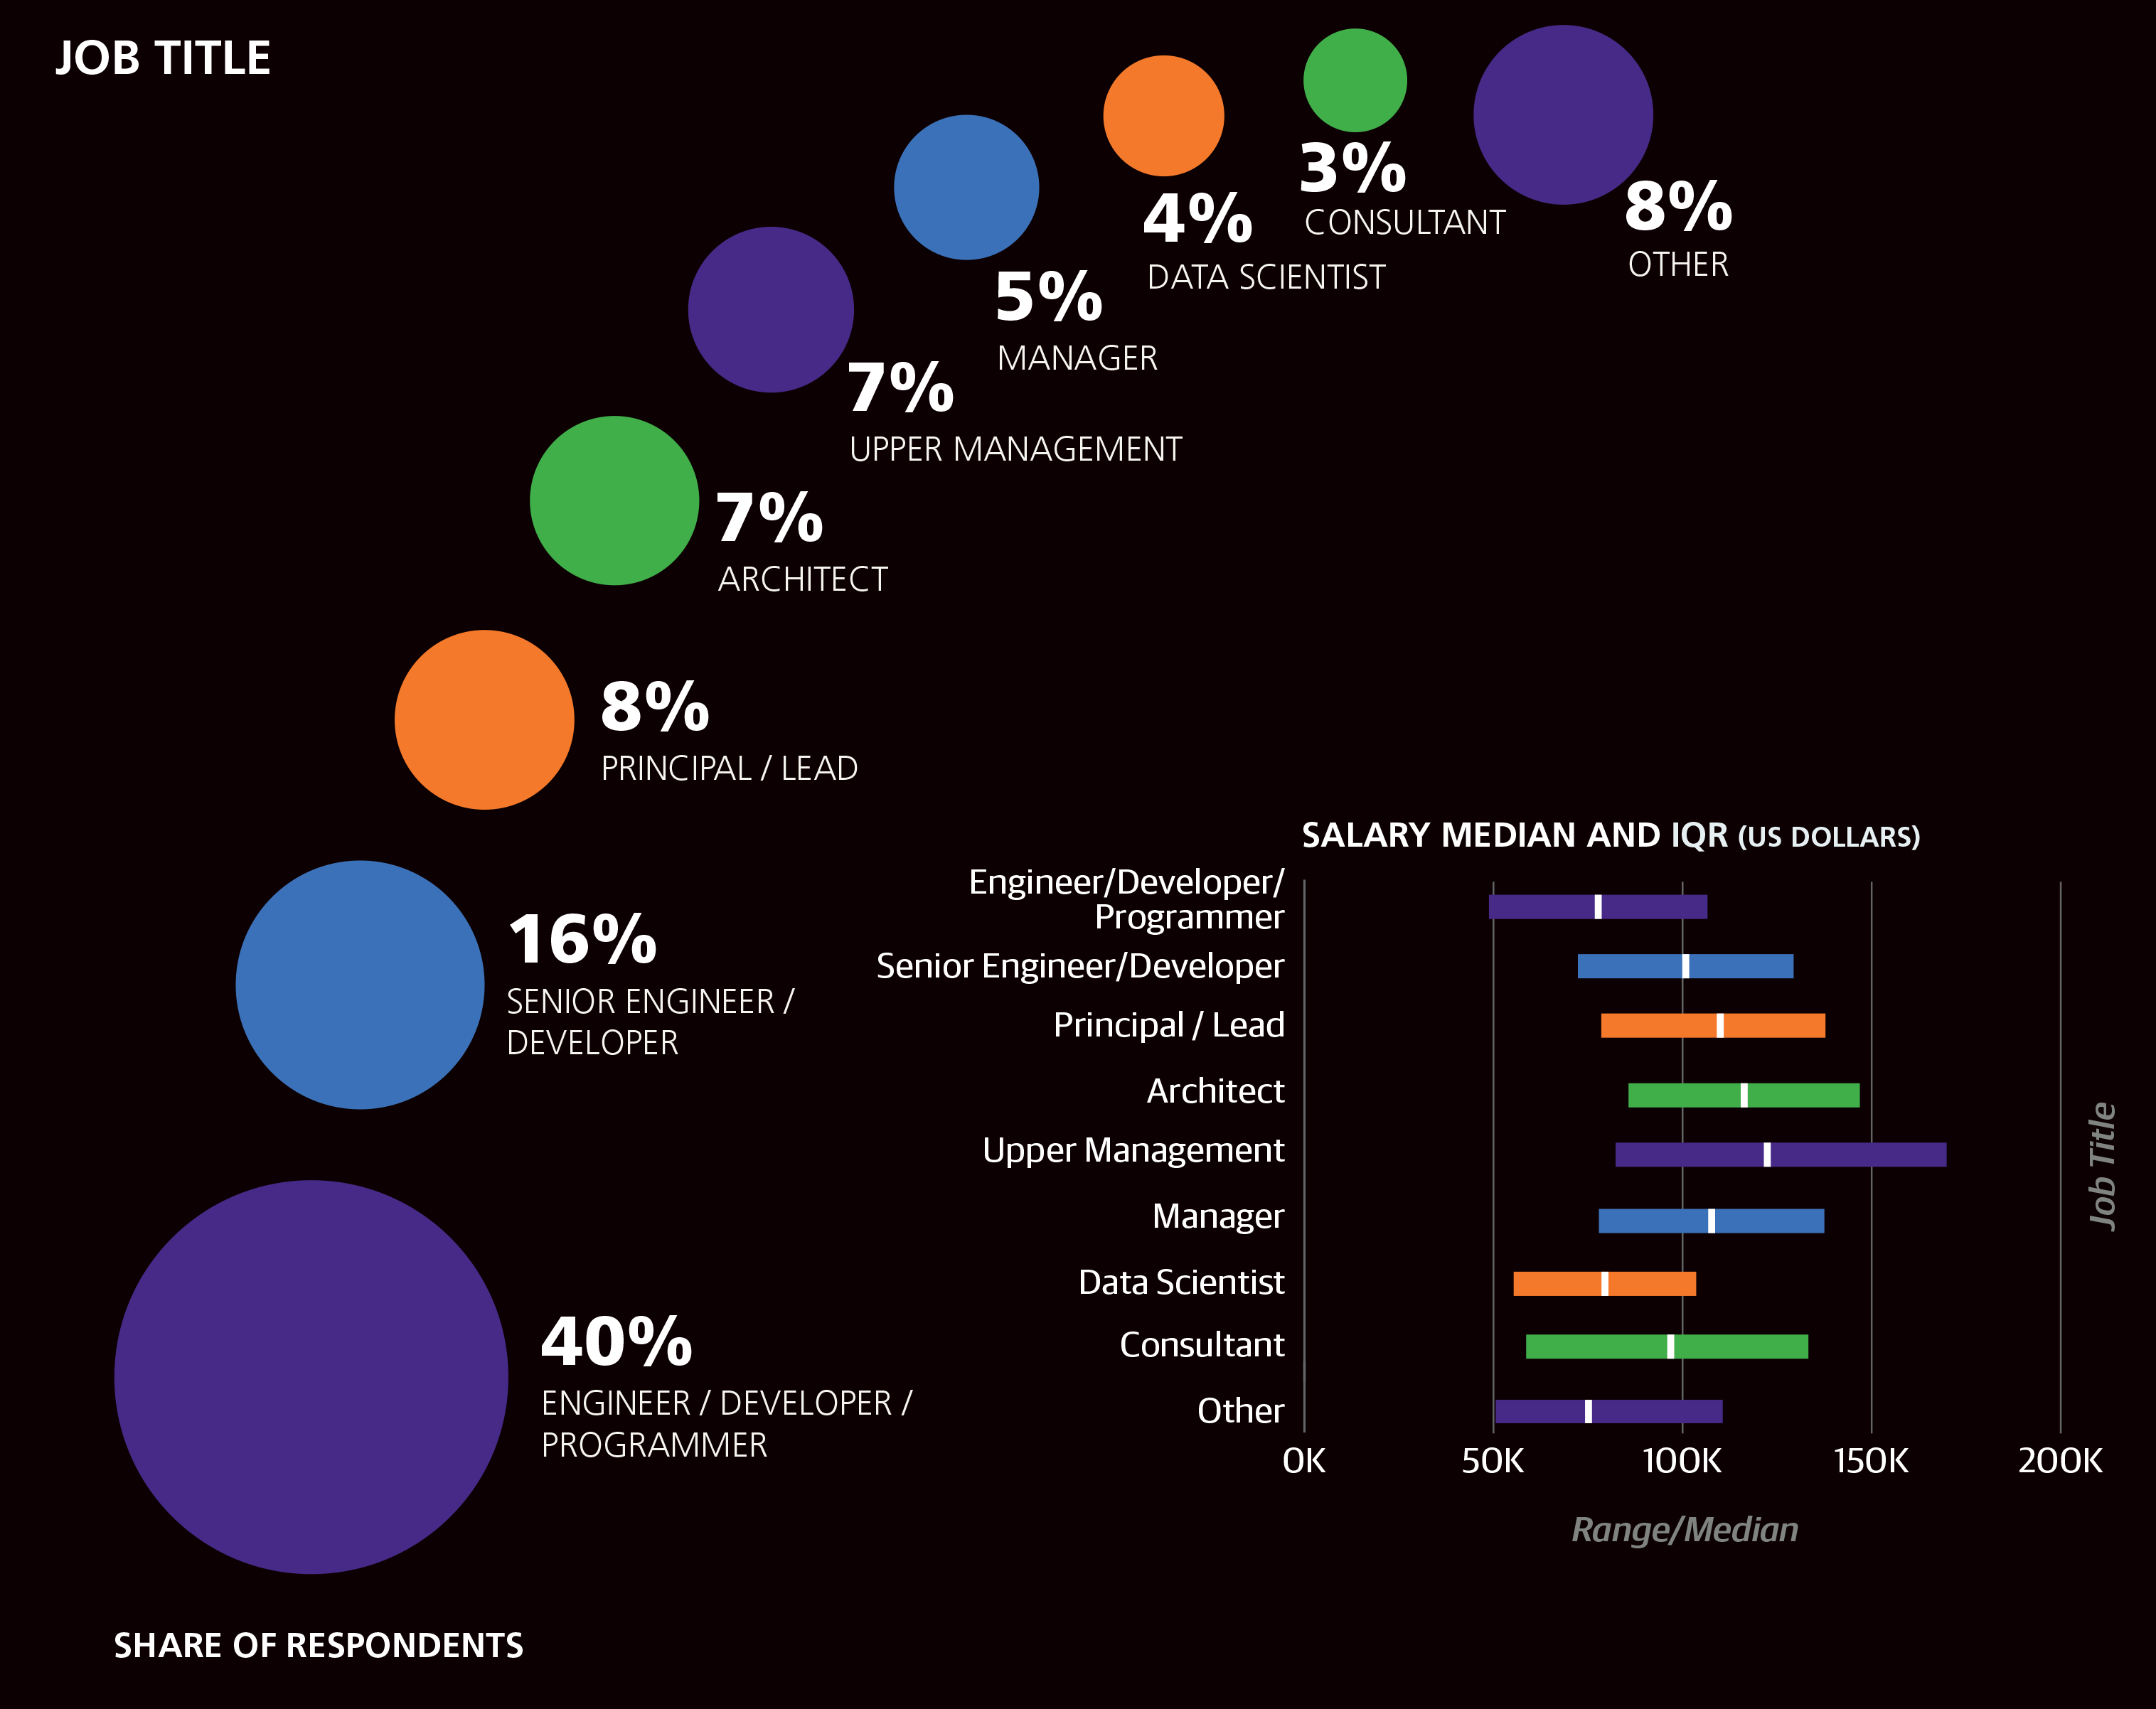
Two distinct approaches were taken to defining the roles of respondents. The first was a text field for job title, which we parsed to assign respondents to a category. The most common (cleaned) title was Engineer/Developer/ Programmer, with 40% of the sample. Engineers or developers with “Senior” in their title made up a further 16% of the sample and also earned an estimated +$9,147 more than their junior counterparts. Three other titles were also given positive coefficients: Principal/Lead (8% of the sample, +$11,936), Architect (7%, +$15,488), and Consultant (3%, +$11,867). As mentioned above, managers and students were excluded from the model, so there were no coefficients associated with them (the median salary of respondents in upper management was $123K).
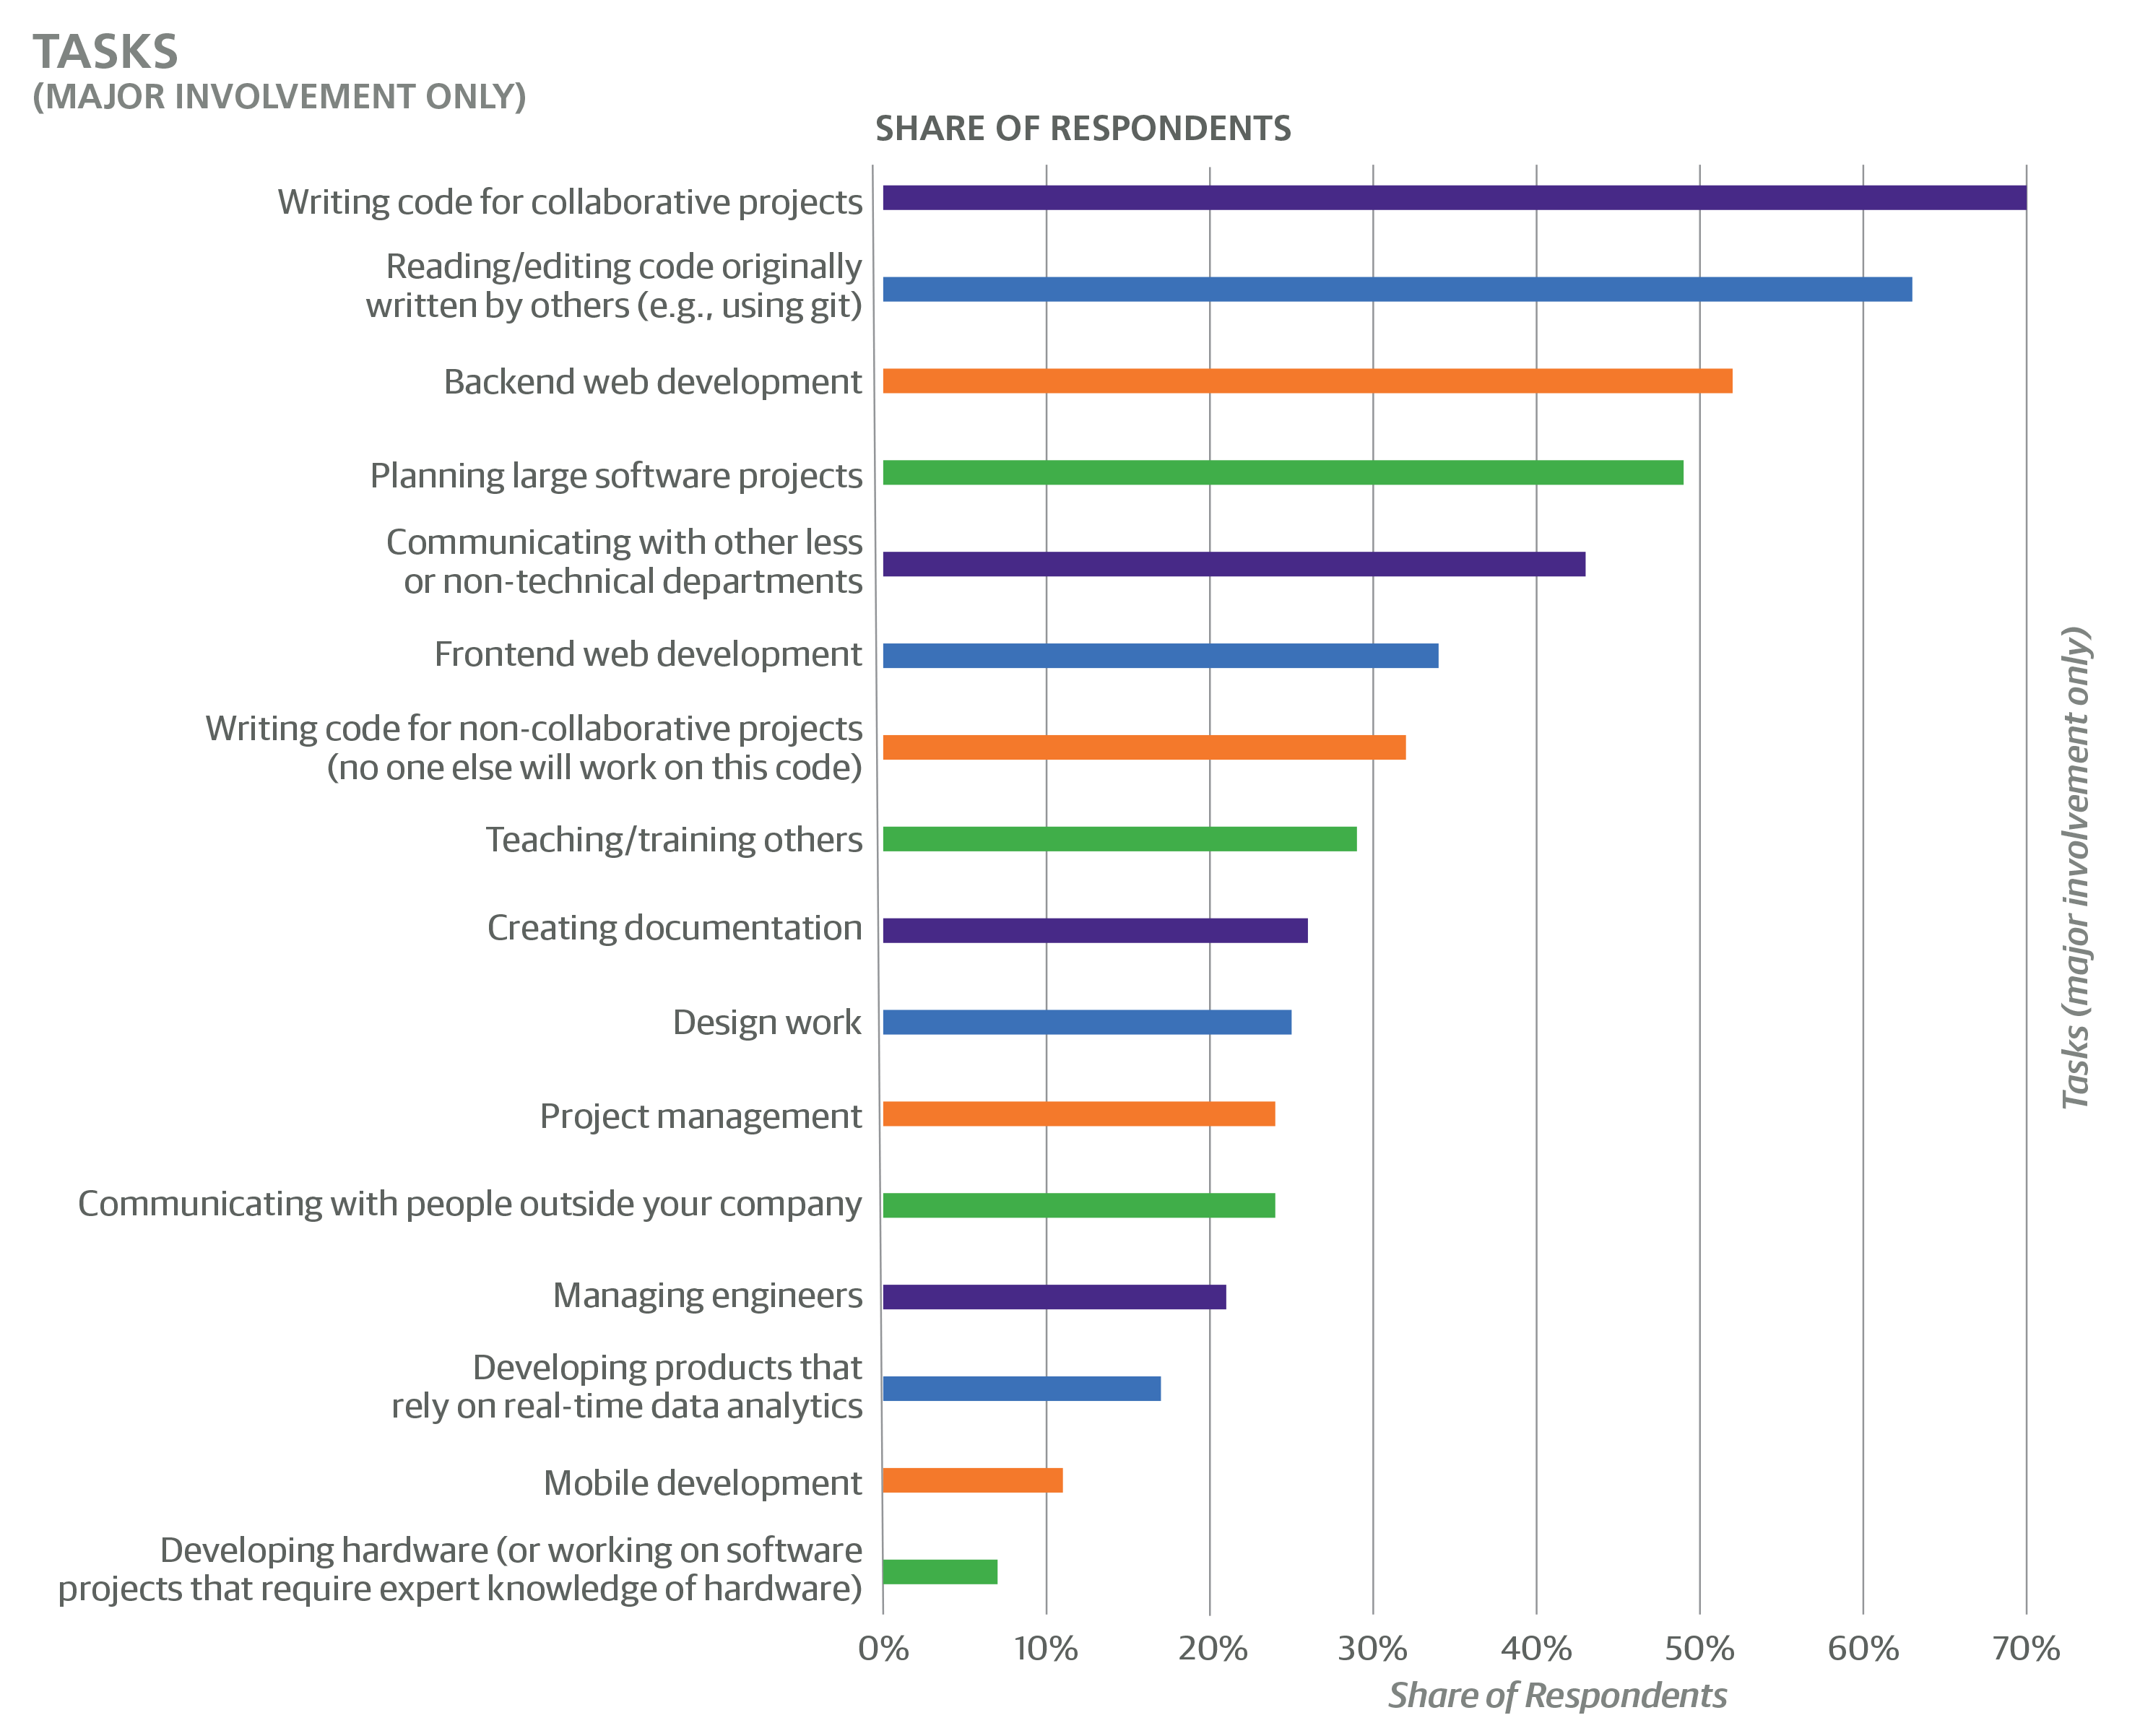
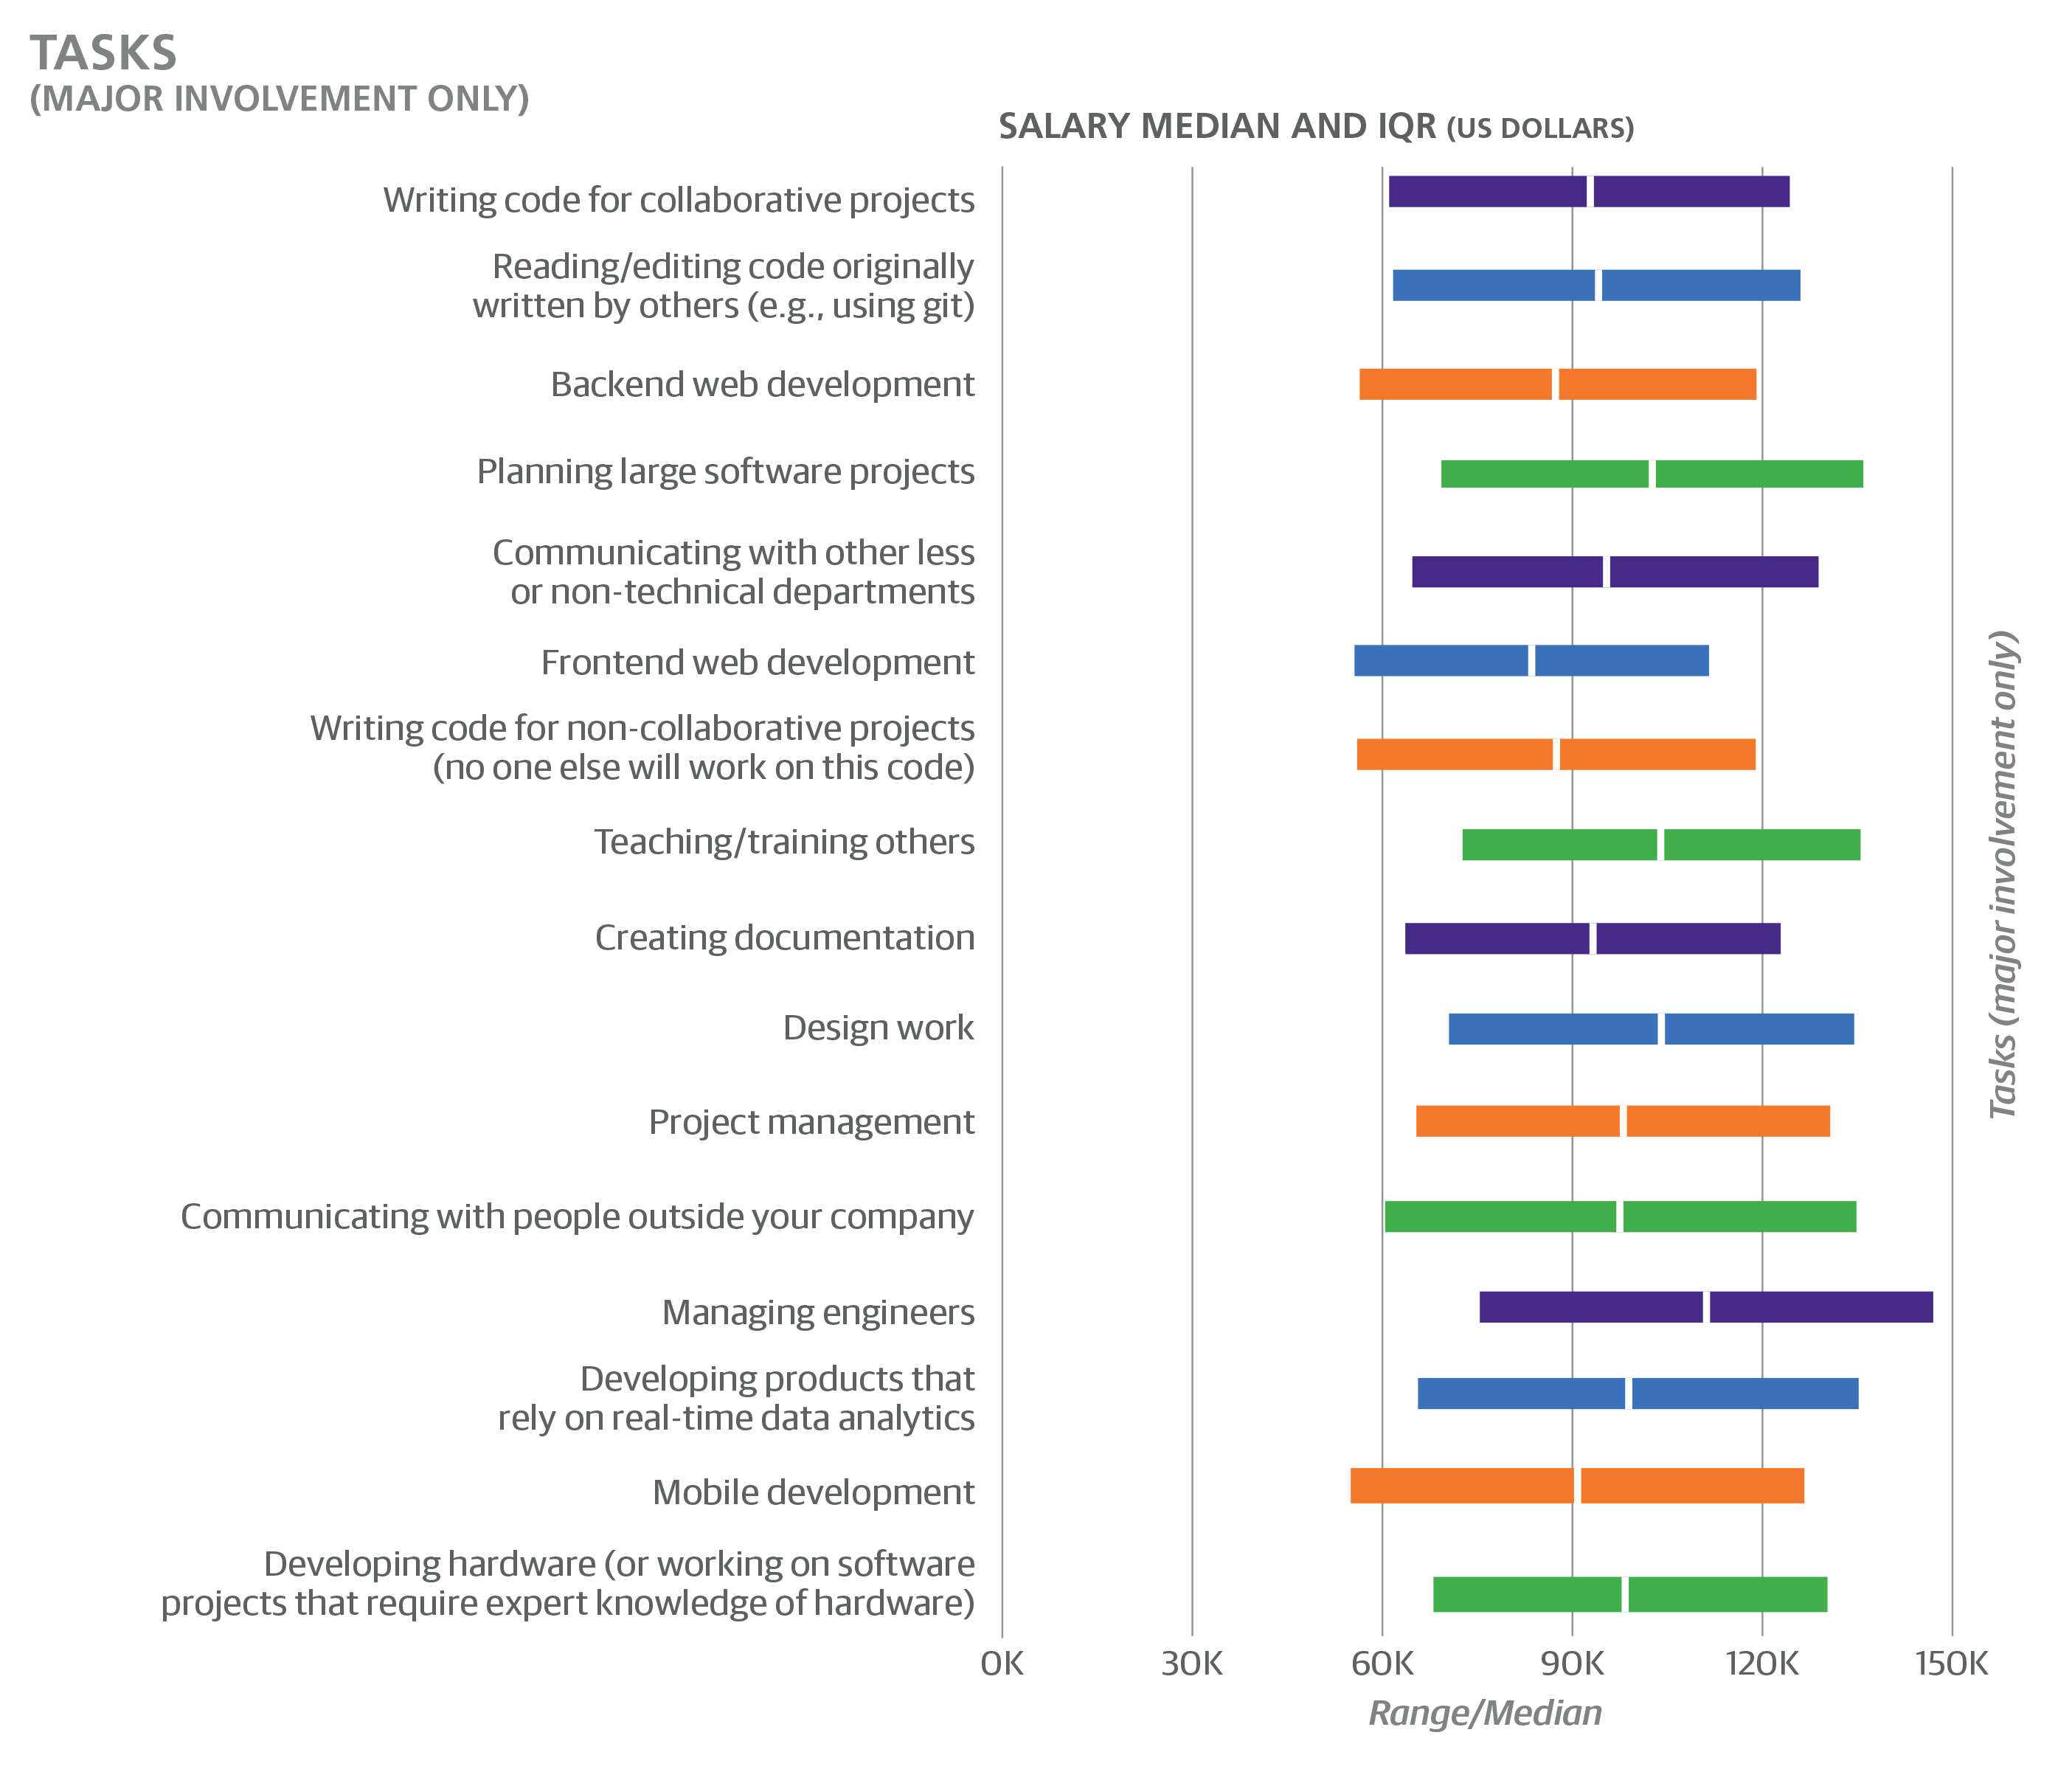
The second approach to capture respondents’ roles was to ask whether they engaged in specific tasks. The three possible answers to each of the 16 task questions were “no involvement”, “minor involvement”, and “major involvement”, which was defined as a task that “is essential to most or all of your projects and responsibilities”.
The two tasks with the greatest involvement were writing code for collaborative projects (70% major, 22% minor) and reading/editing code originally written by others (63% major, 31% minor). Even though neither of these tasks had associated coefficients, their high engagement rates highlight the importance of collaboration in software development: it is often a very social activity.
Backend web development was also very common (52% major, 28% minor), more than frontend web development (34% major, 37% minor) or mobile development (11% major, 27% minor), while only 13% of the sample had no involvement in web or mobile development. The single coefficient related to the above development distinctions was a penalty for frontend: minor and major involvement in frontend development had coefficients of –$4,194 or –$6,305, respectively.
“Planning large software projects” was a task that may seem to be synonymous with architect (a job title category), but the fact that more than one task could be chosen meant that the tasks appeared to be interpreted quite broadly: a full 49% of the sample (most of whom were not architects) reported major involvement in planning large software projects. These respondents did earn more than the rest of the sample: major involvement in planning large software projects had a coefficient of +$5,868.
Even though managers were excluded from the model, this was determined through job title, not tasks. A large number of respondents who said they have major involvement in managing engineers were among those excluded, but many software professionals with a management component (especially minor involvement) were kept in the model calculations. A modest coefficient was produced for (minor or major) involvement in managing engineers: +$3,706.
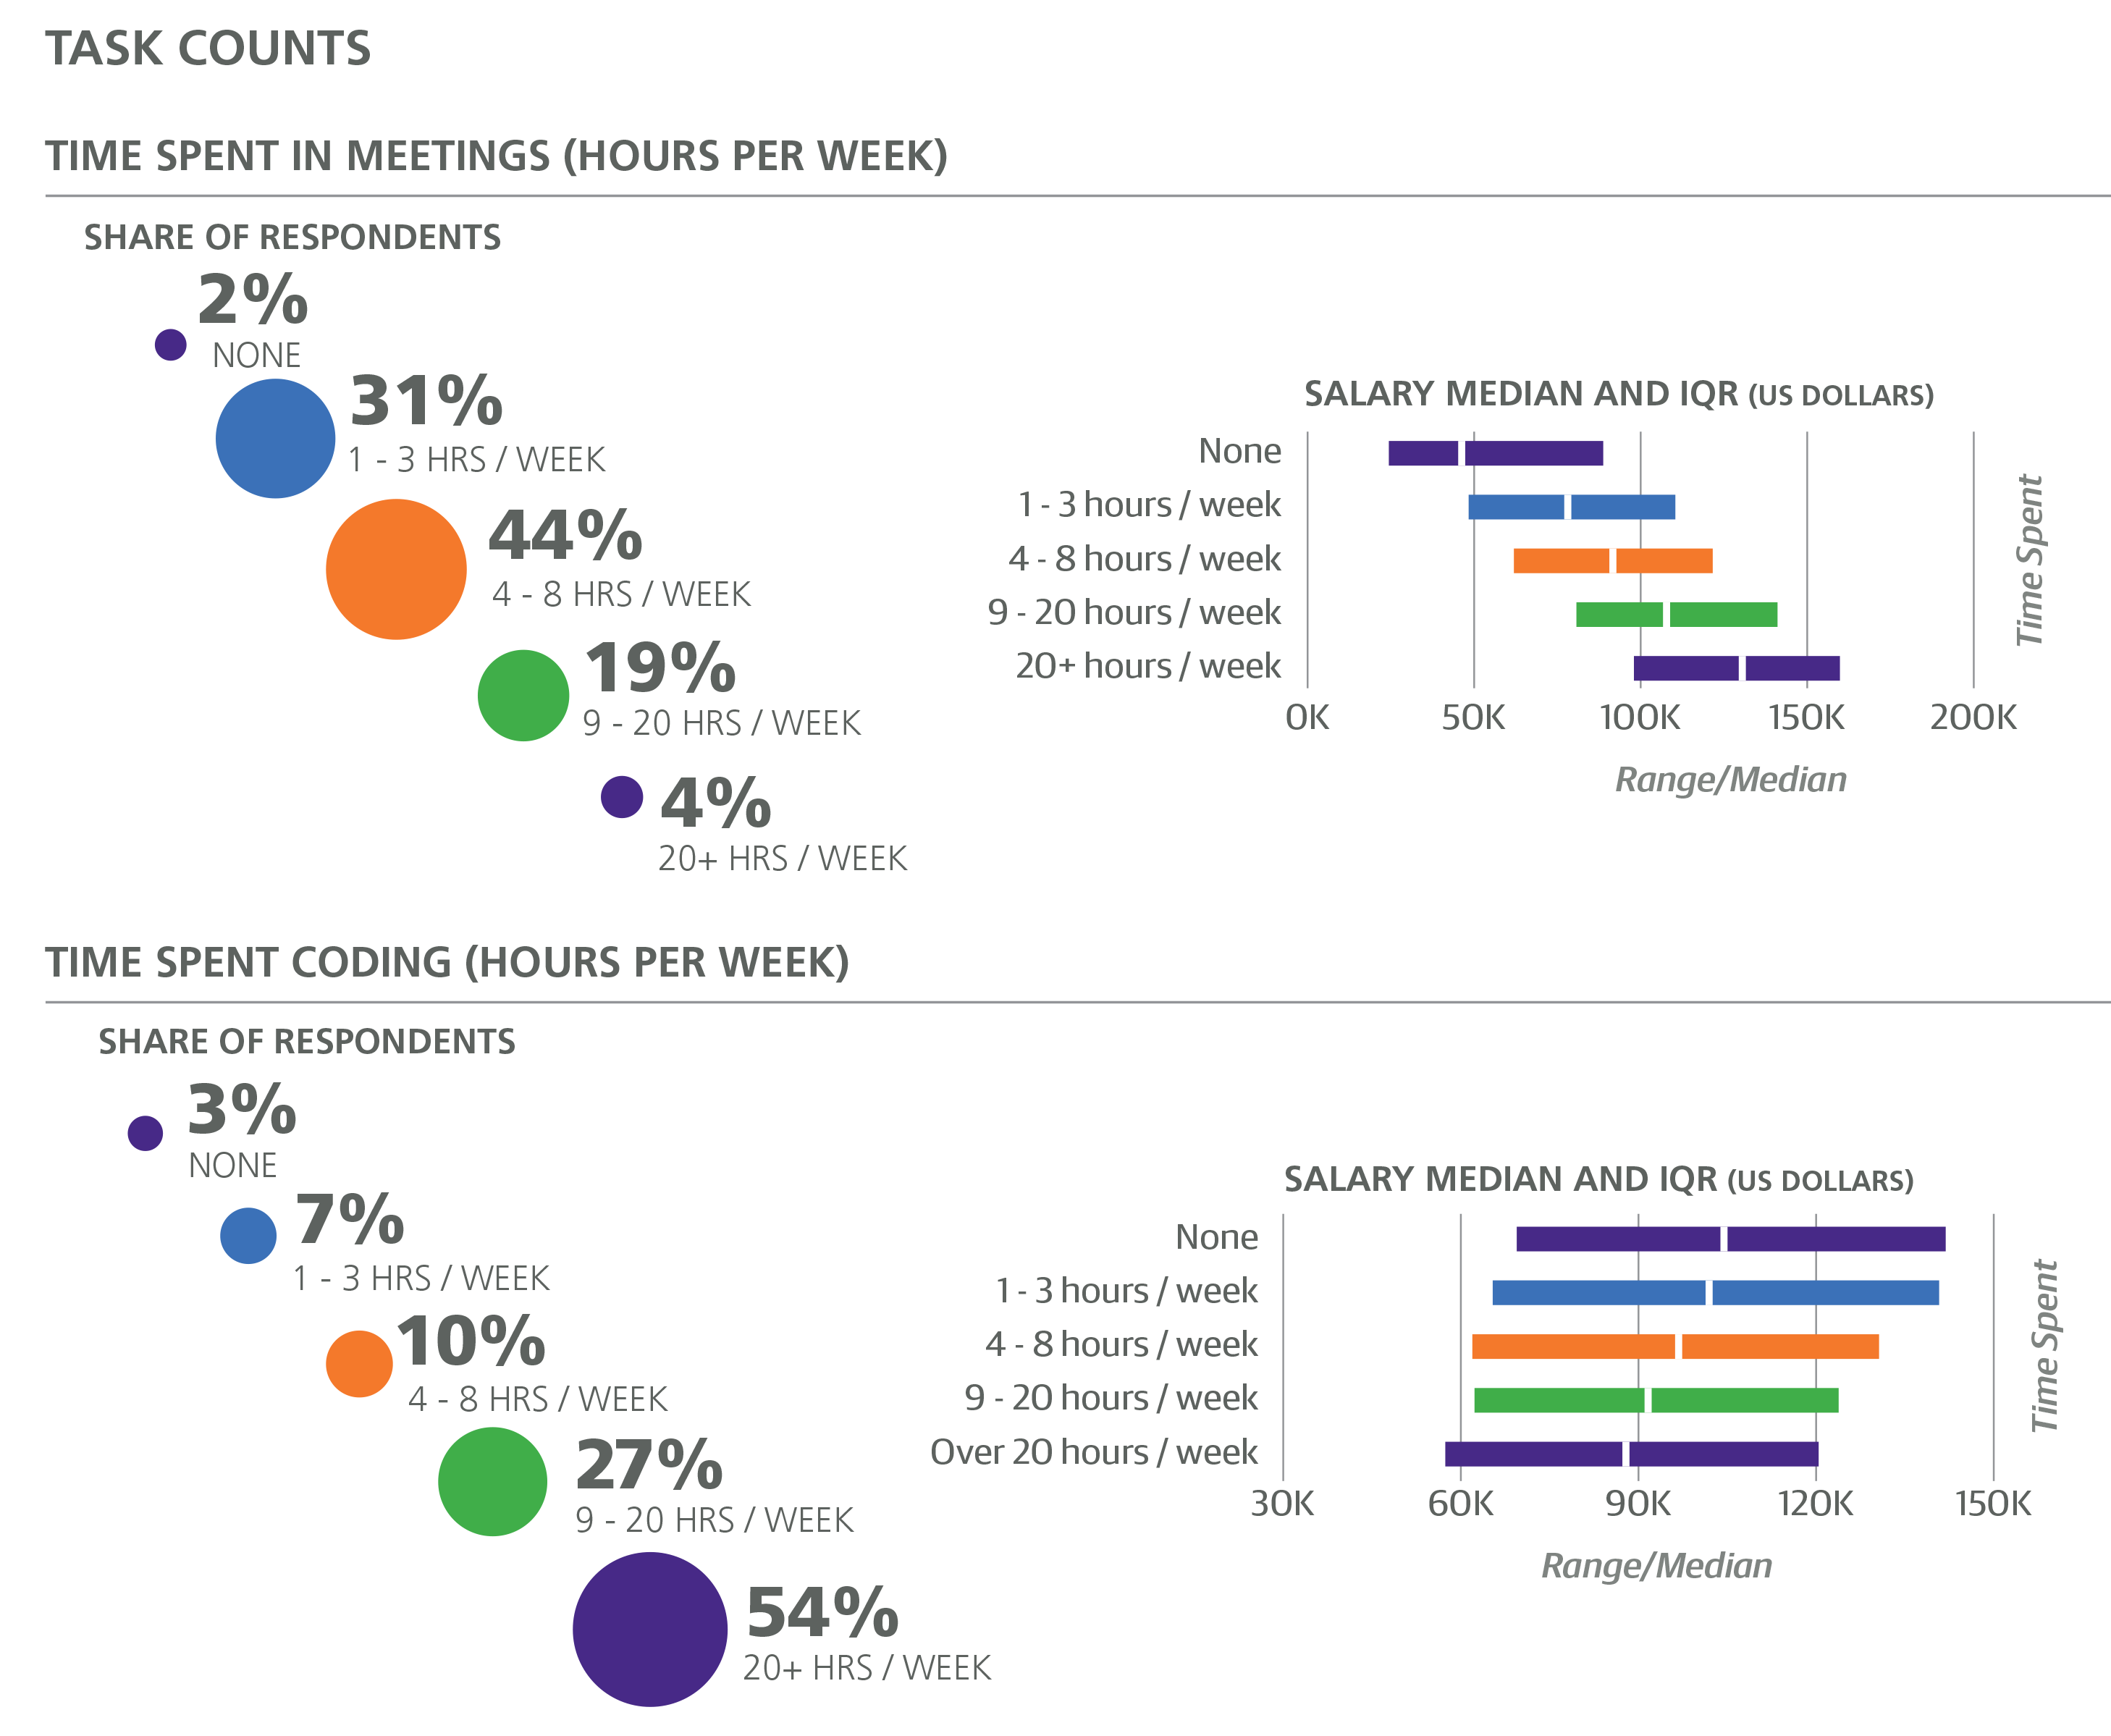
Even with questions about management, title, and years of experience, it is difficult to obtain a reliable metric of “level,” the track of vertical career advancement that, we assume, plays an integral part in determining salary. Variations in team and management structure, and inconsistencies in title distinctions (e.g., “senior”, “staff”, “principal”) contribute to this. One variable that we have found to serve as a decent proxy for level is the number of hours spent in meetings. The coefficient of +$237 per weekly meeting hour is (as usual) in addition to any other management- or level-related features. If we consider those professionals who spend somewhere around half of their time in meetings (2% spent over 20 hours/week in meetings), this coefficient can easily dwarf most other coefficients as a contribution to salary estimate.
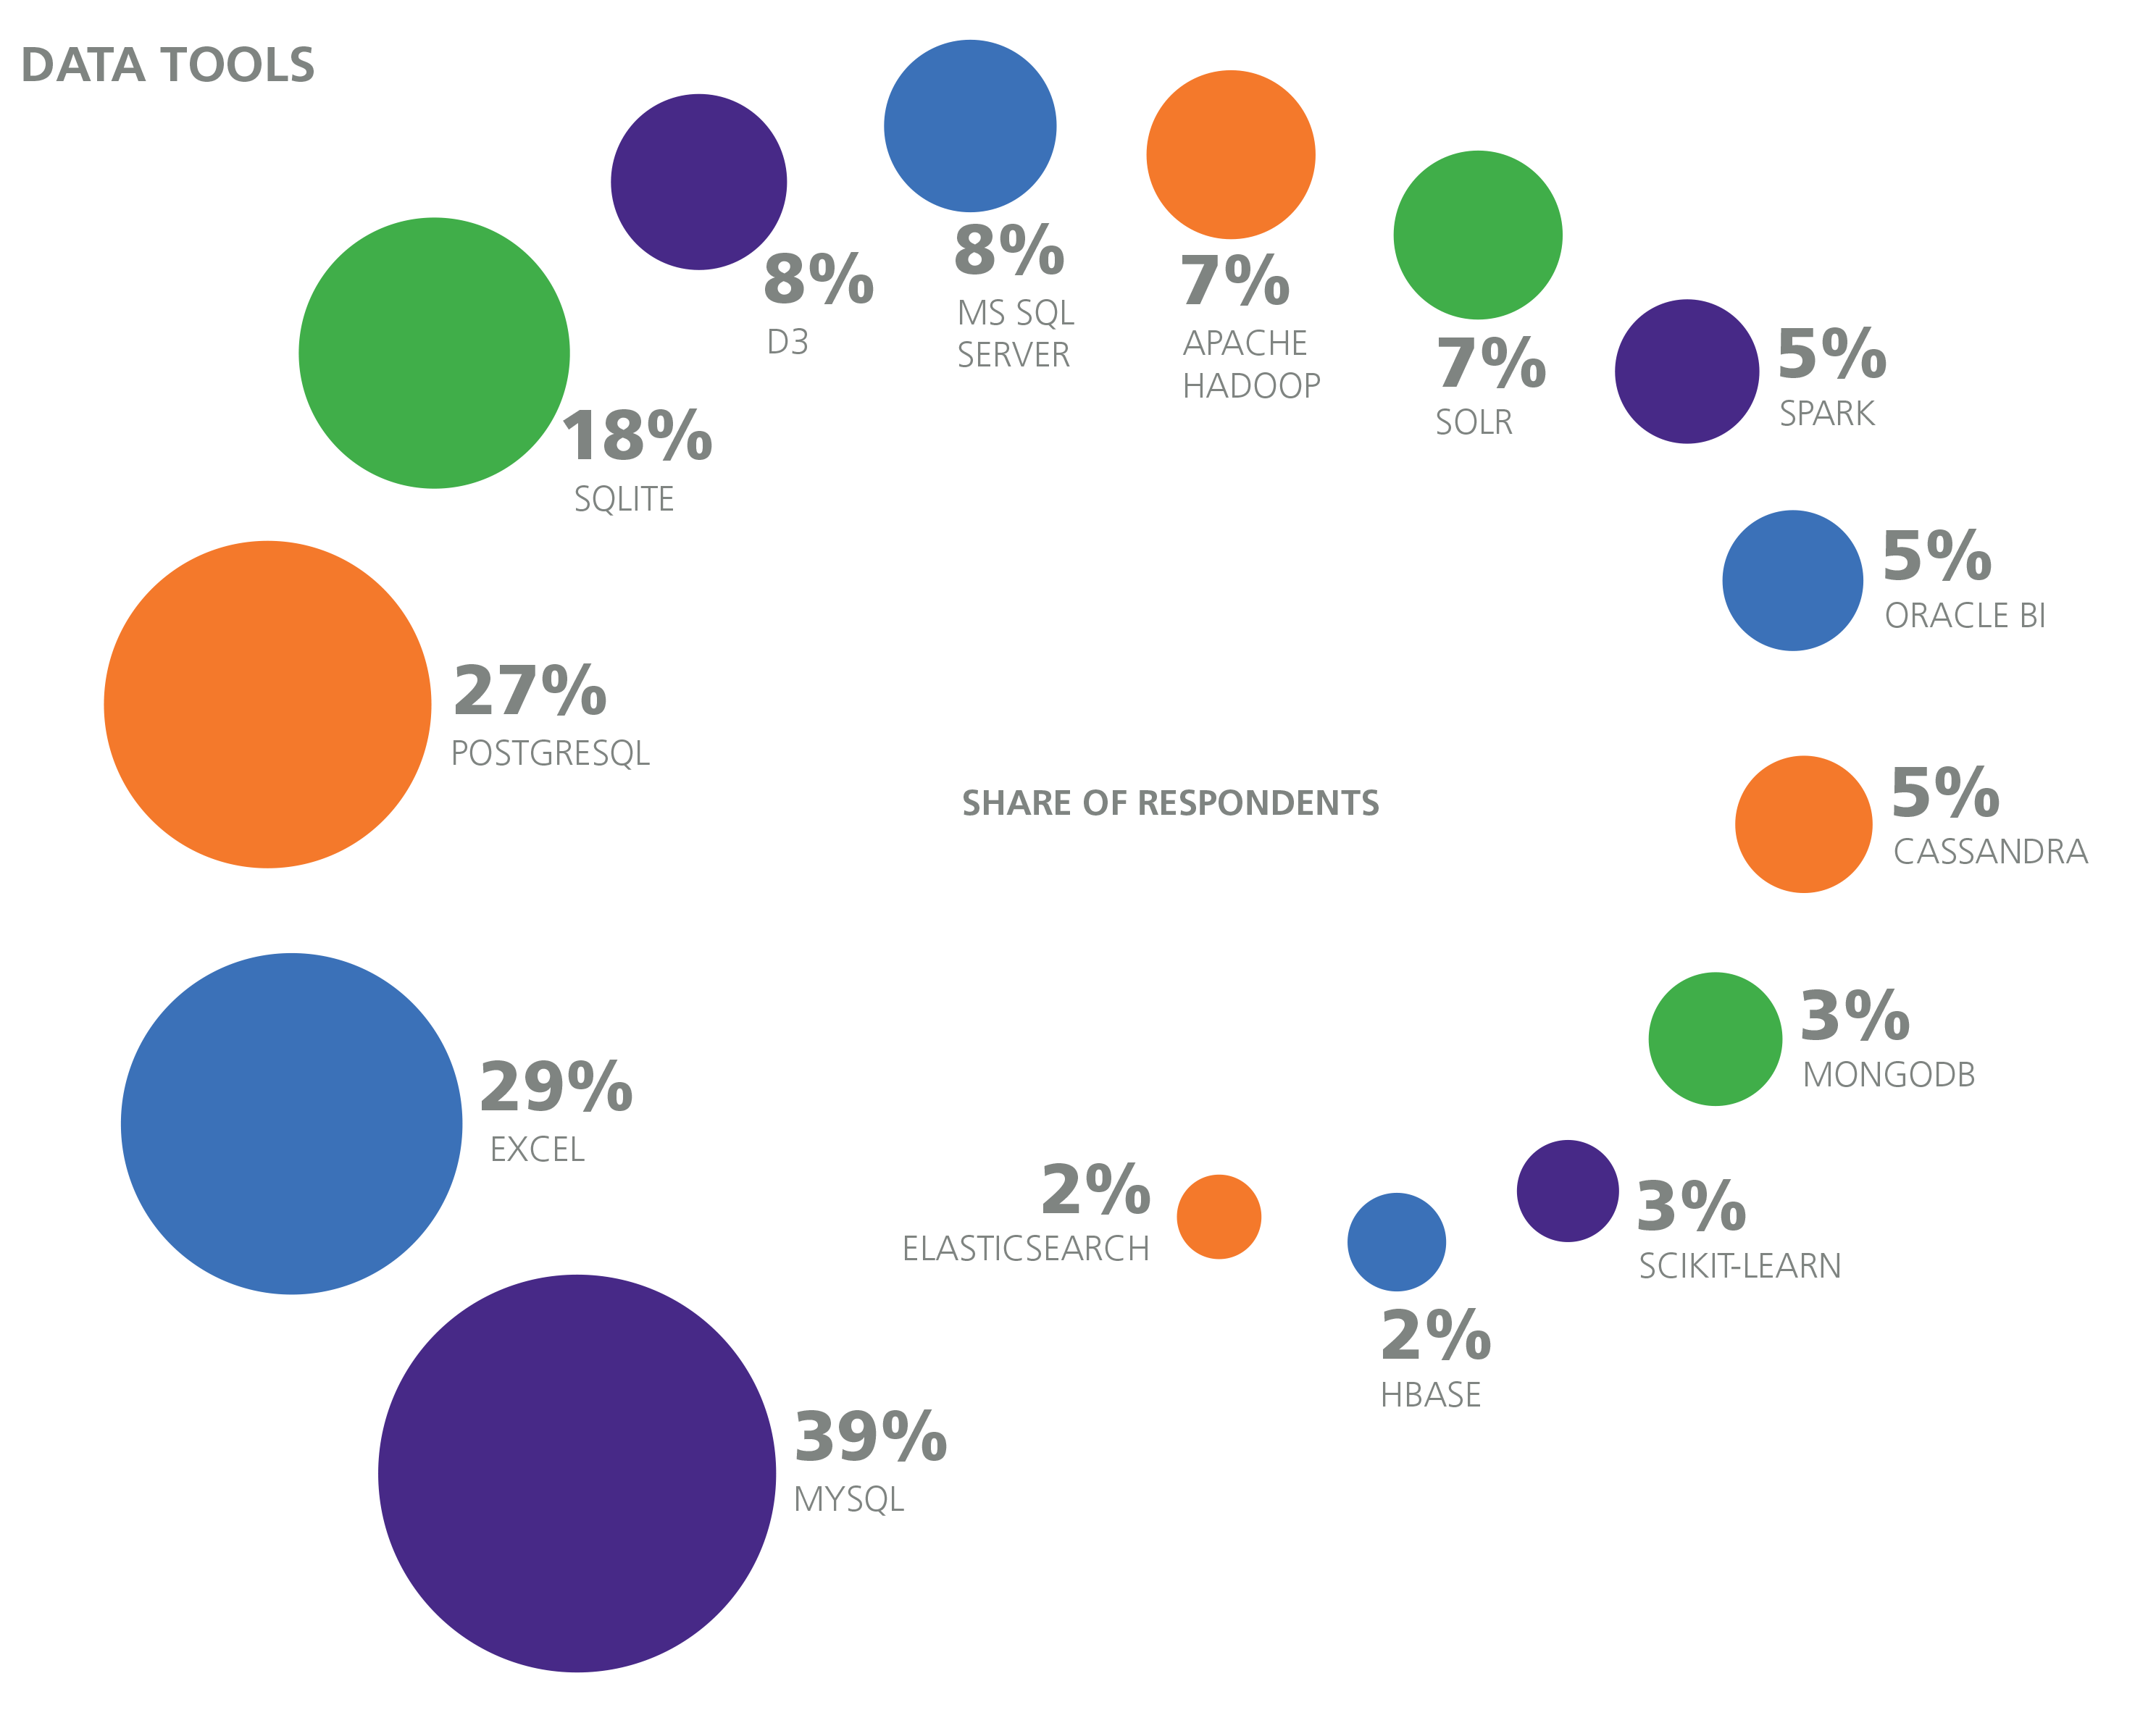
Tools
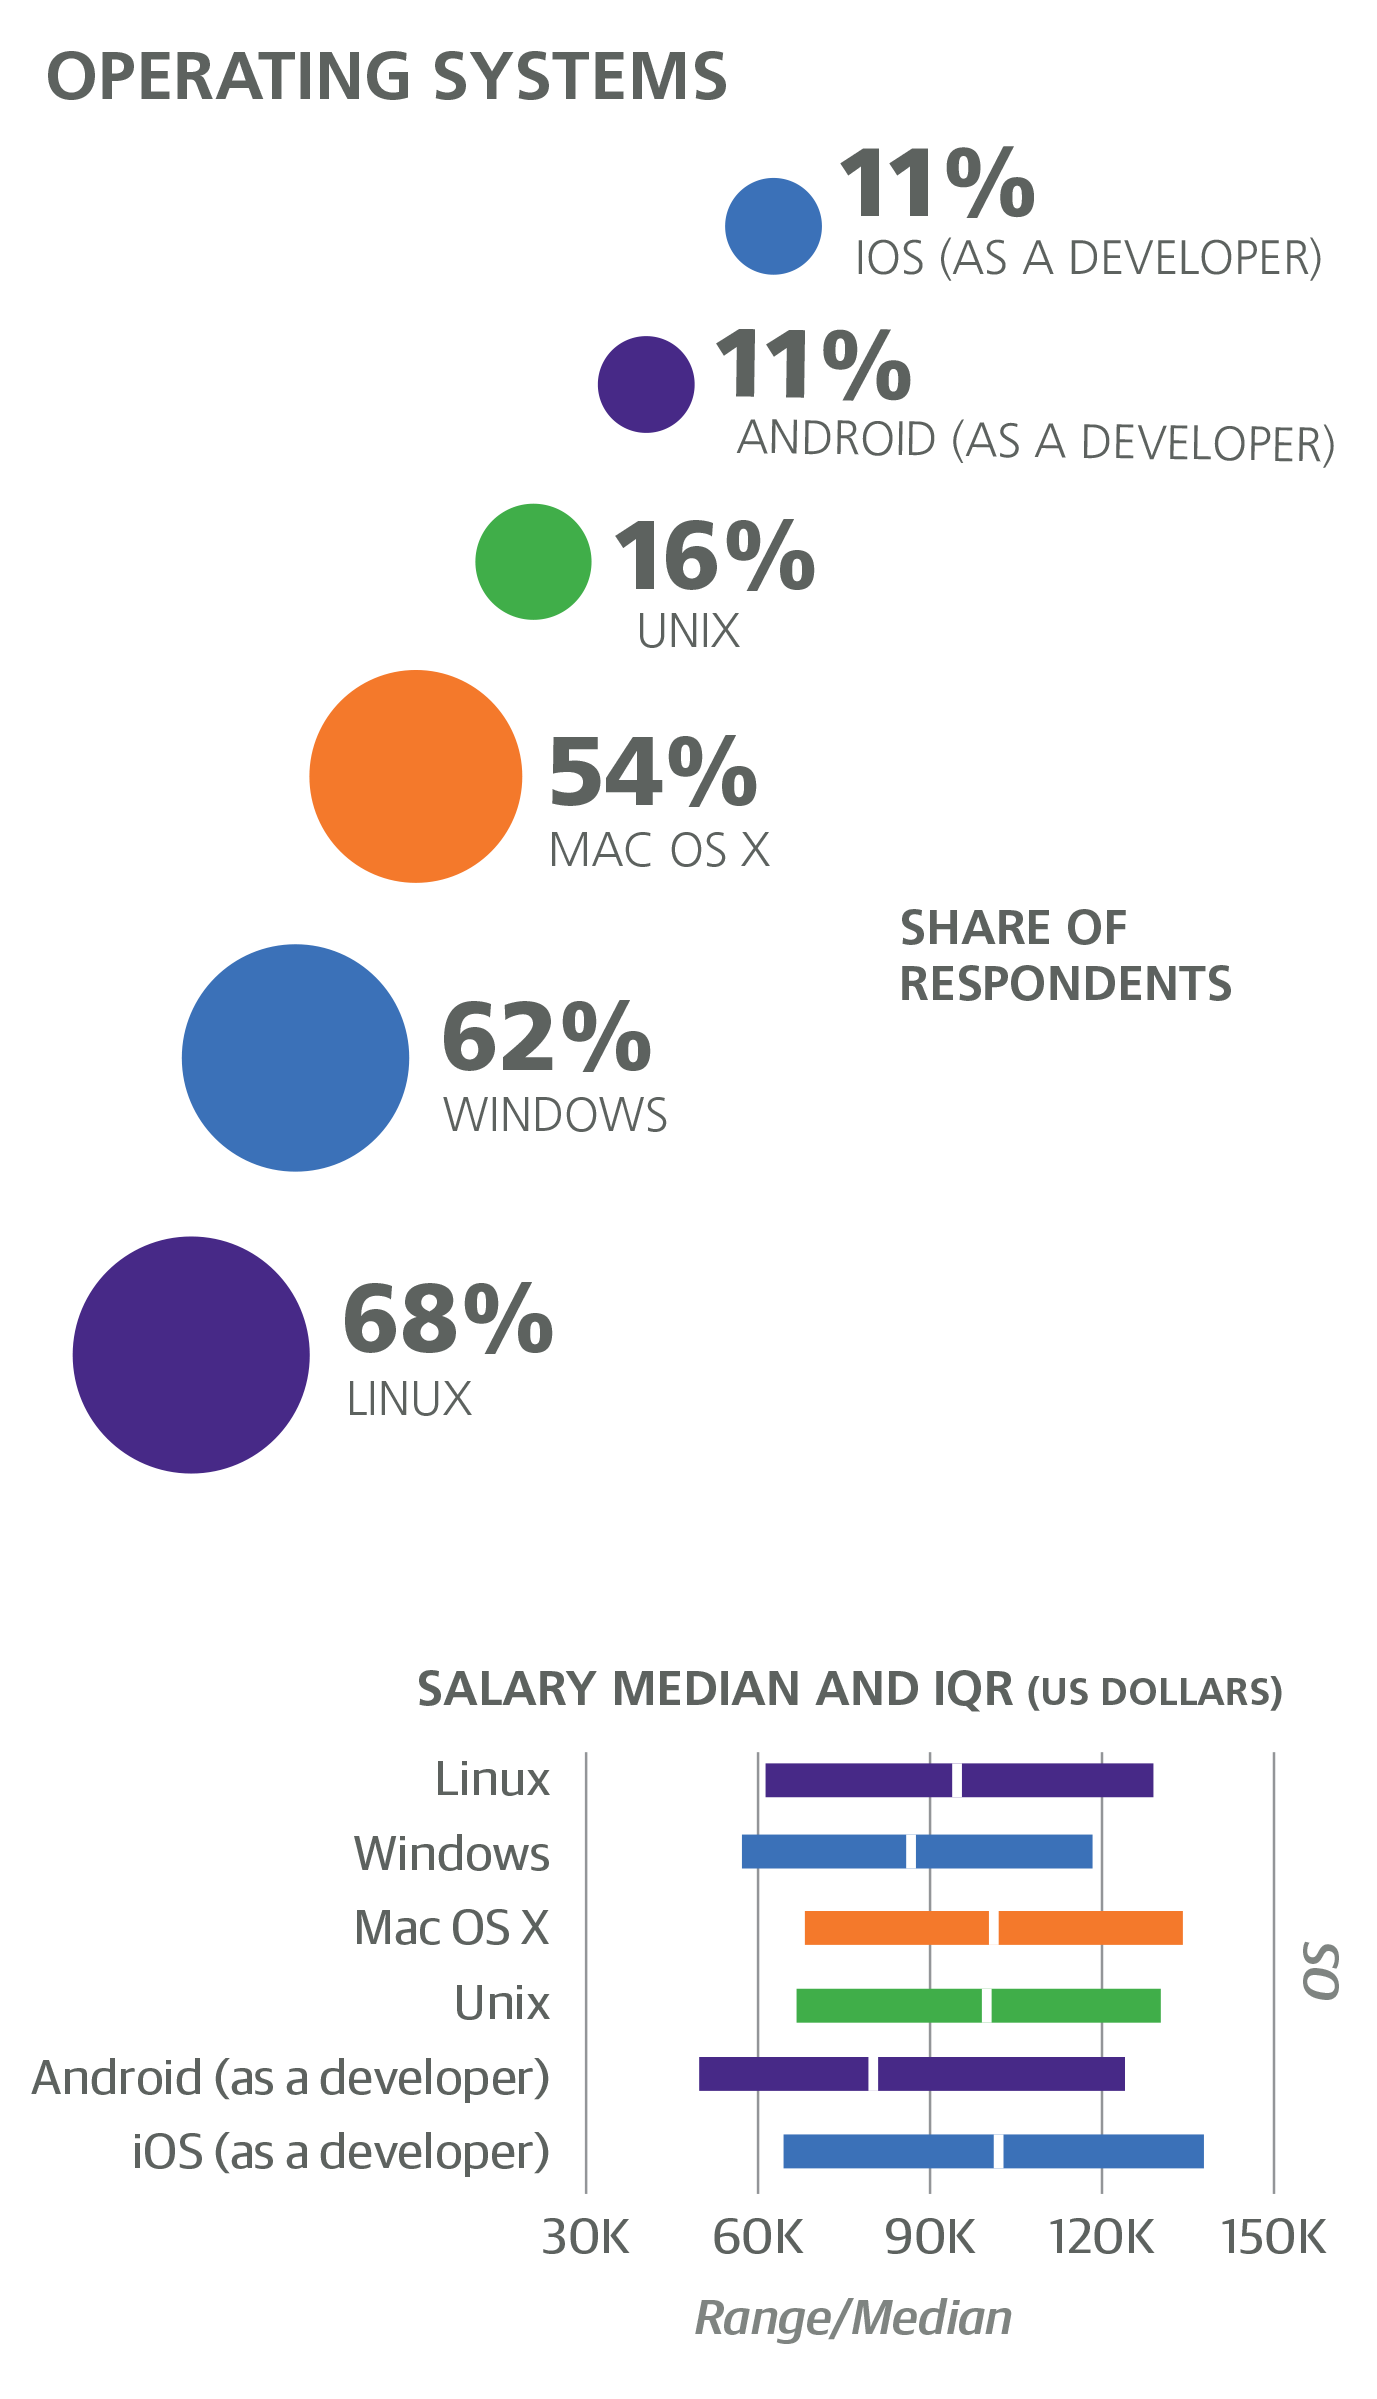
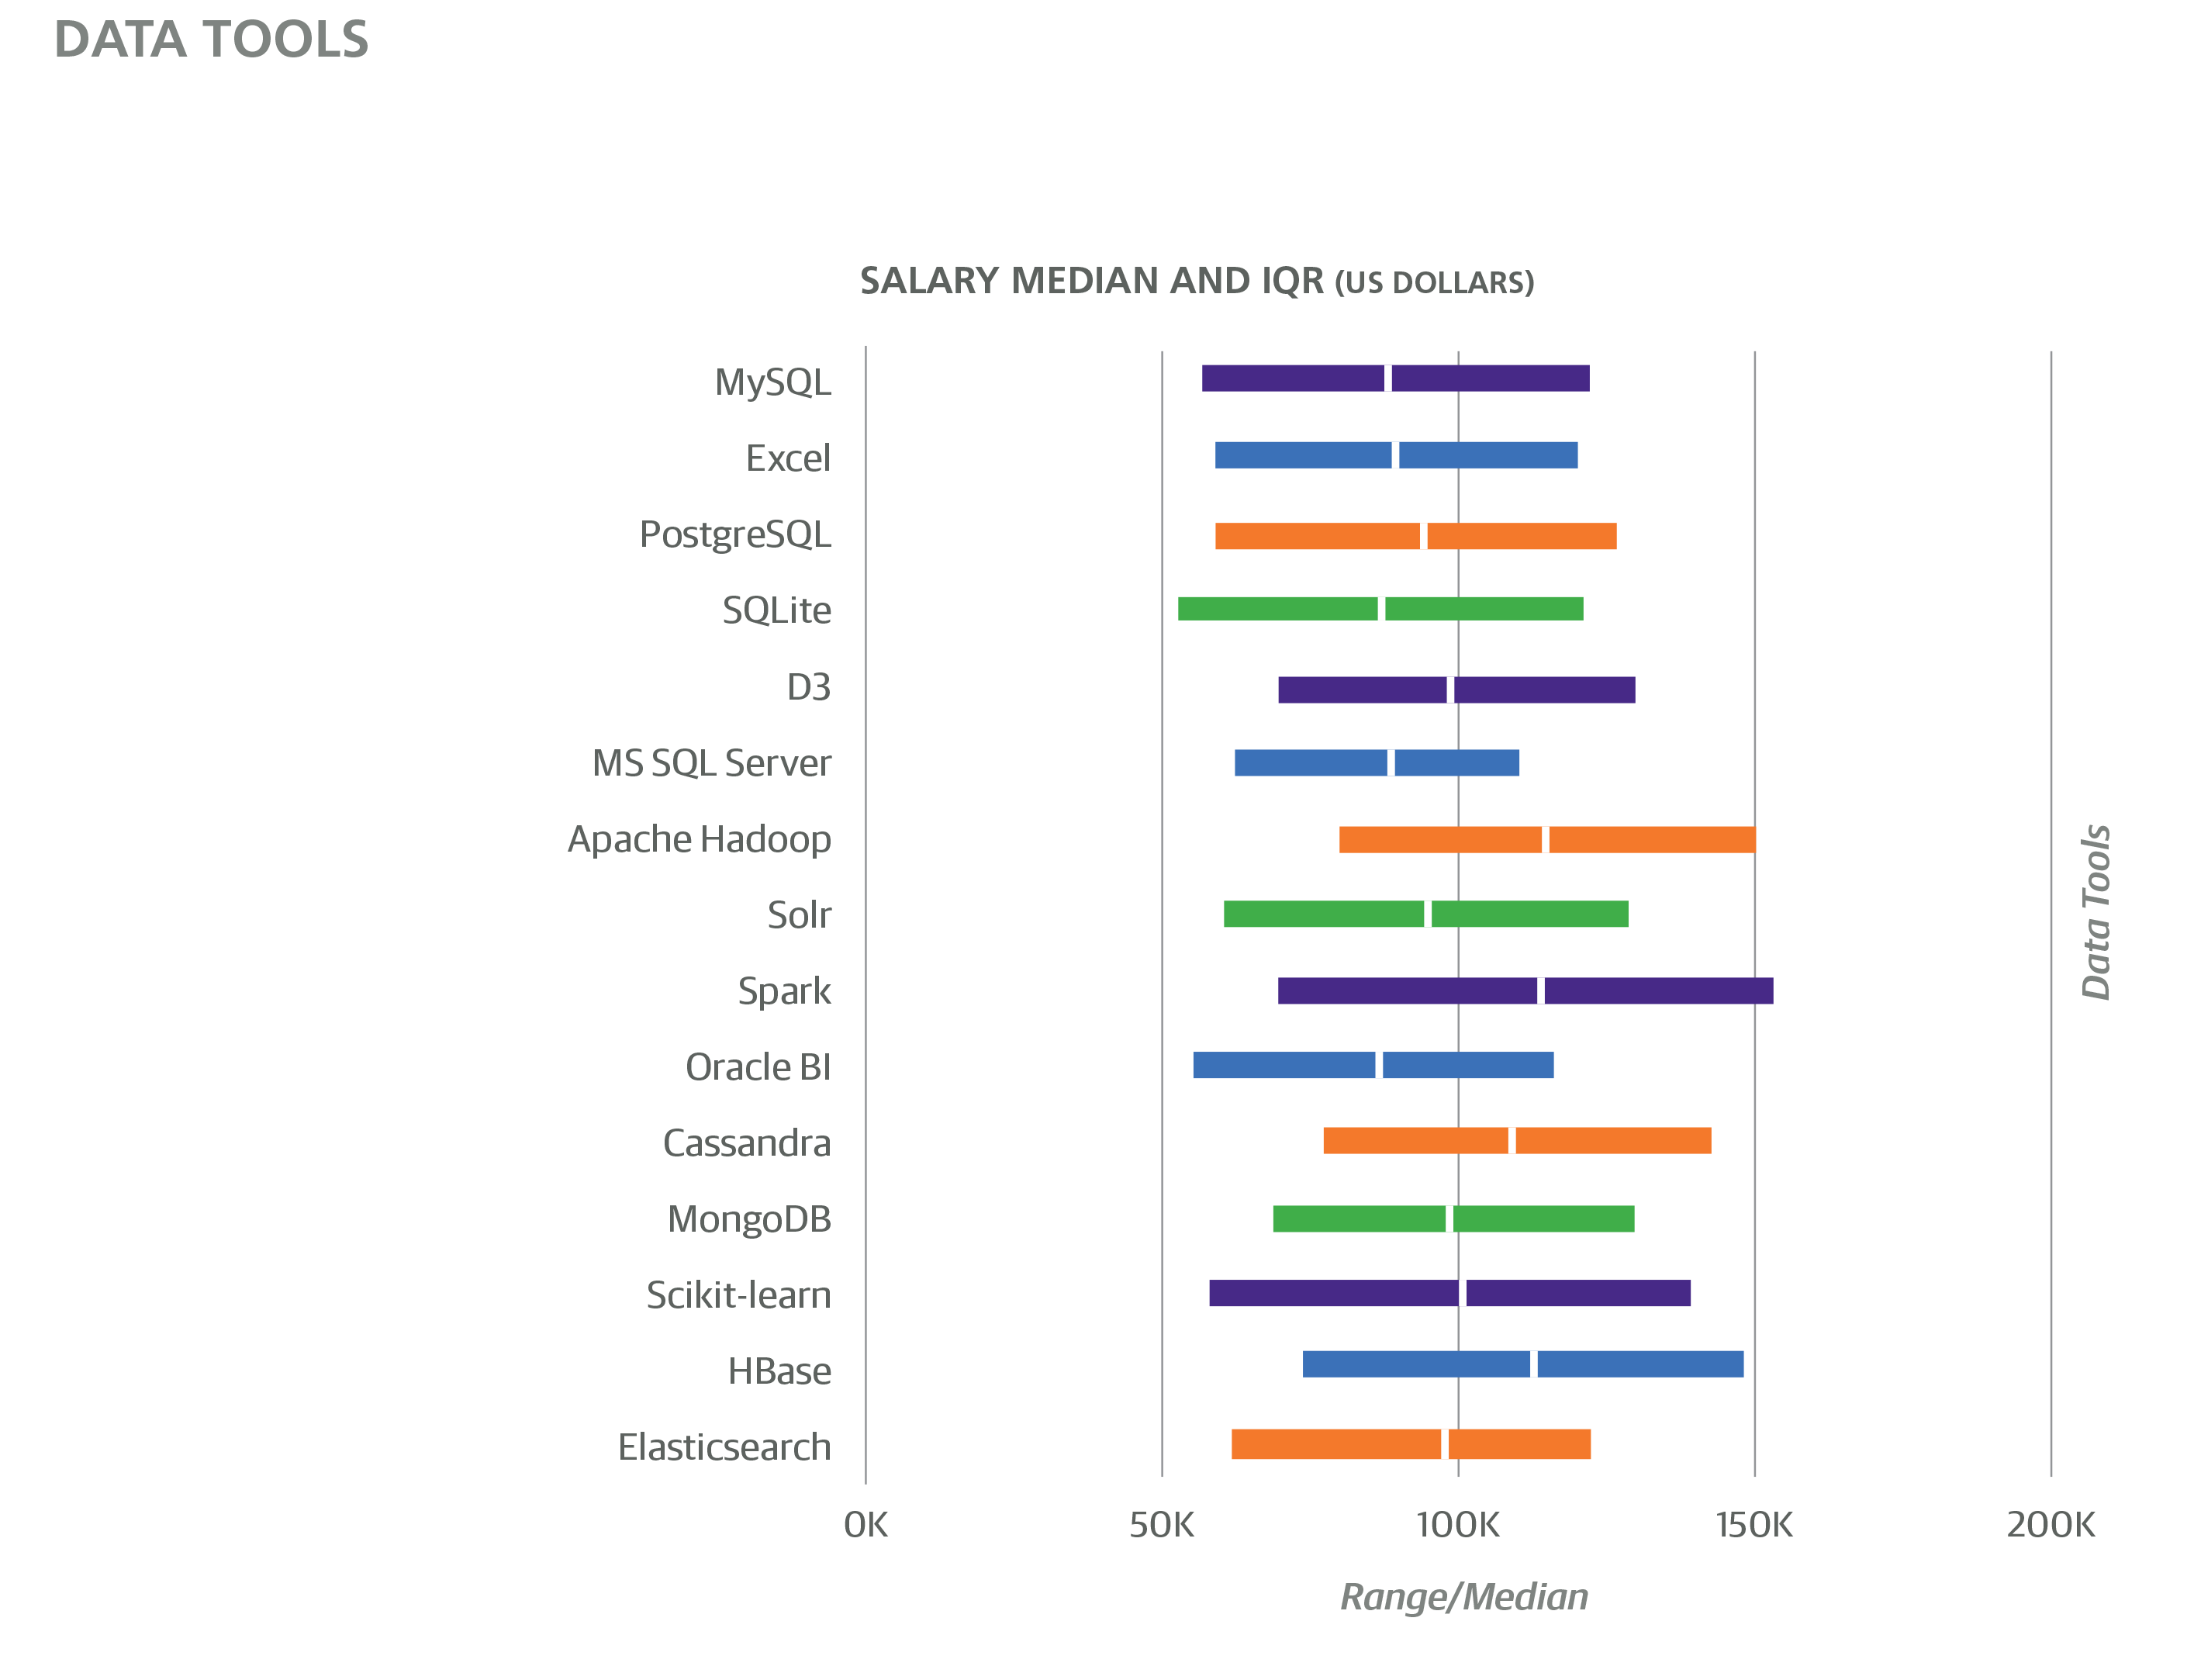
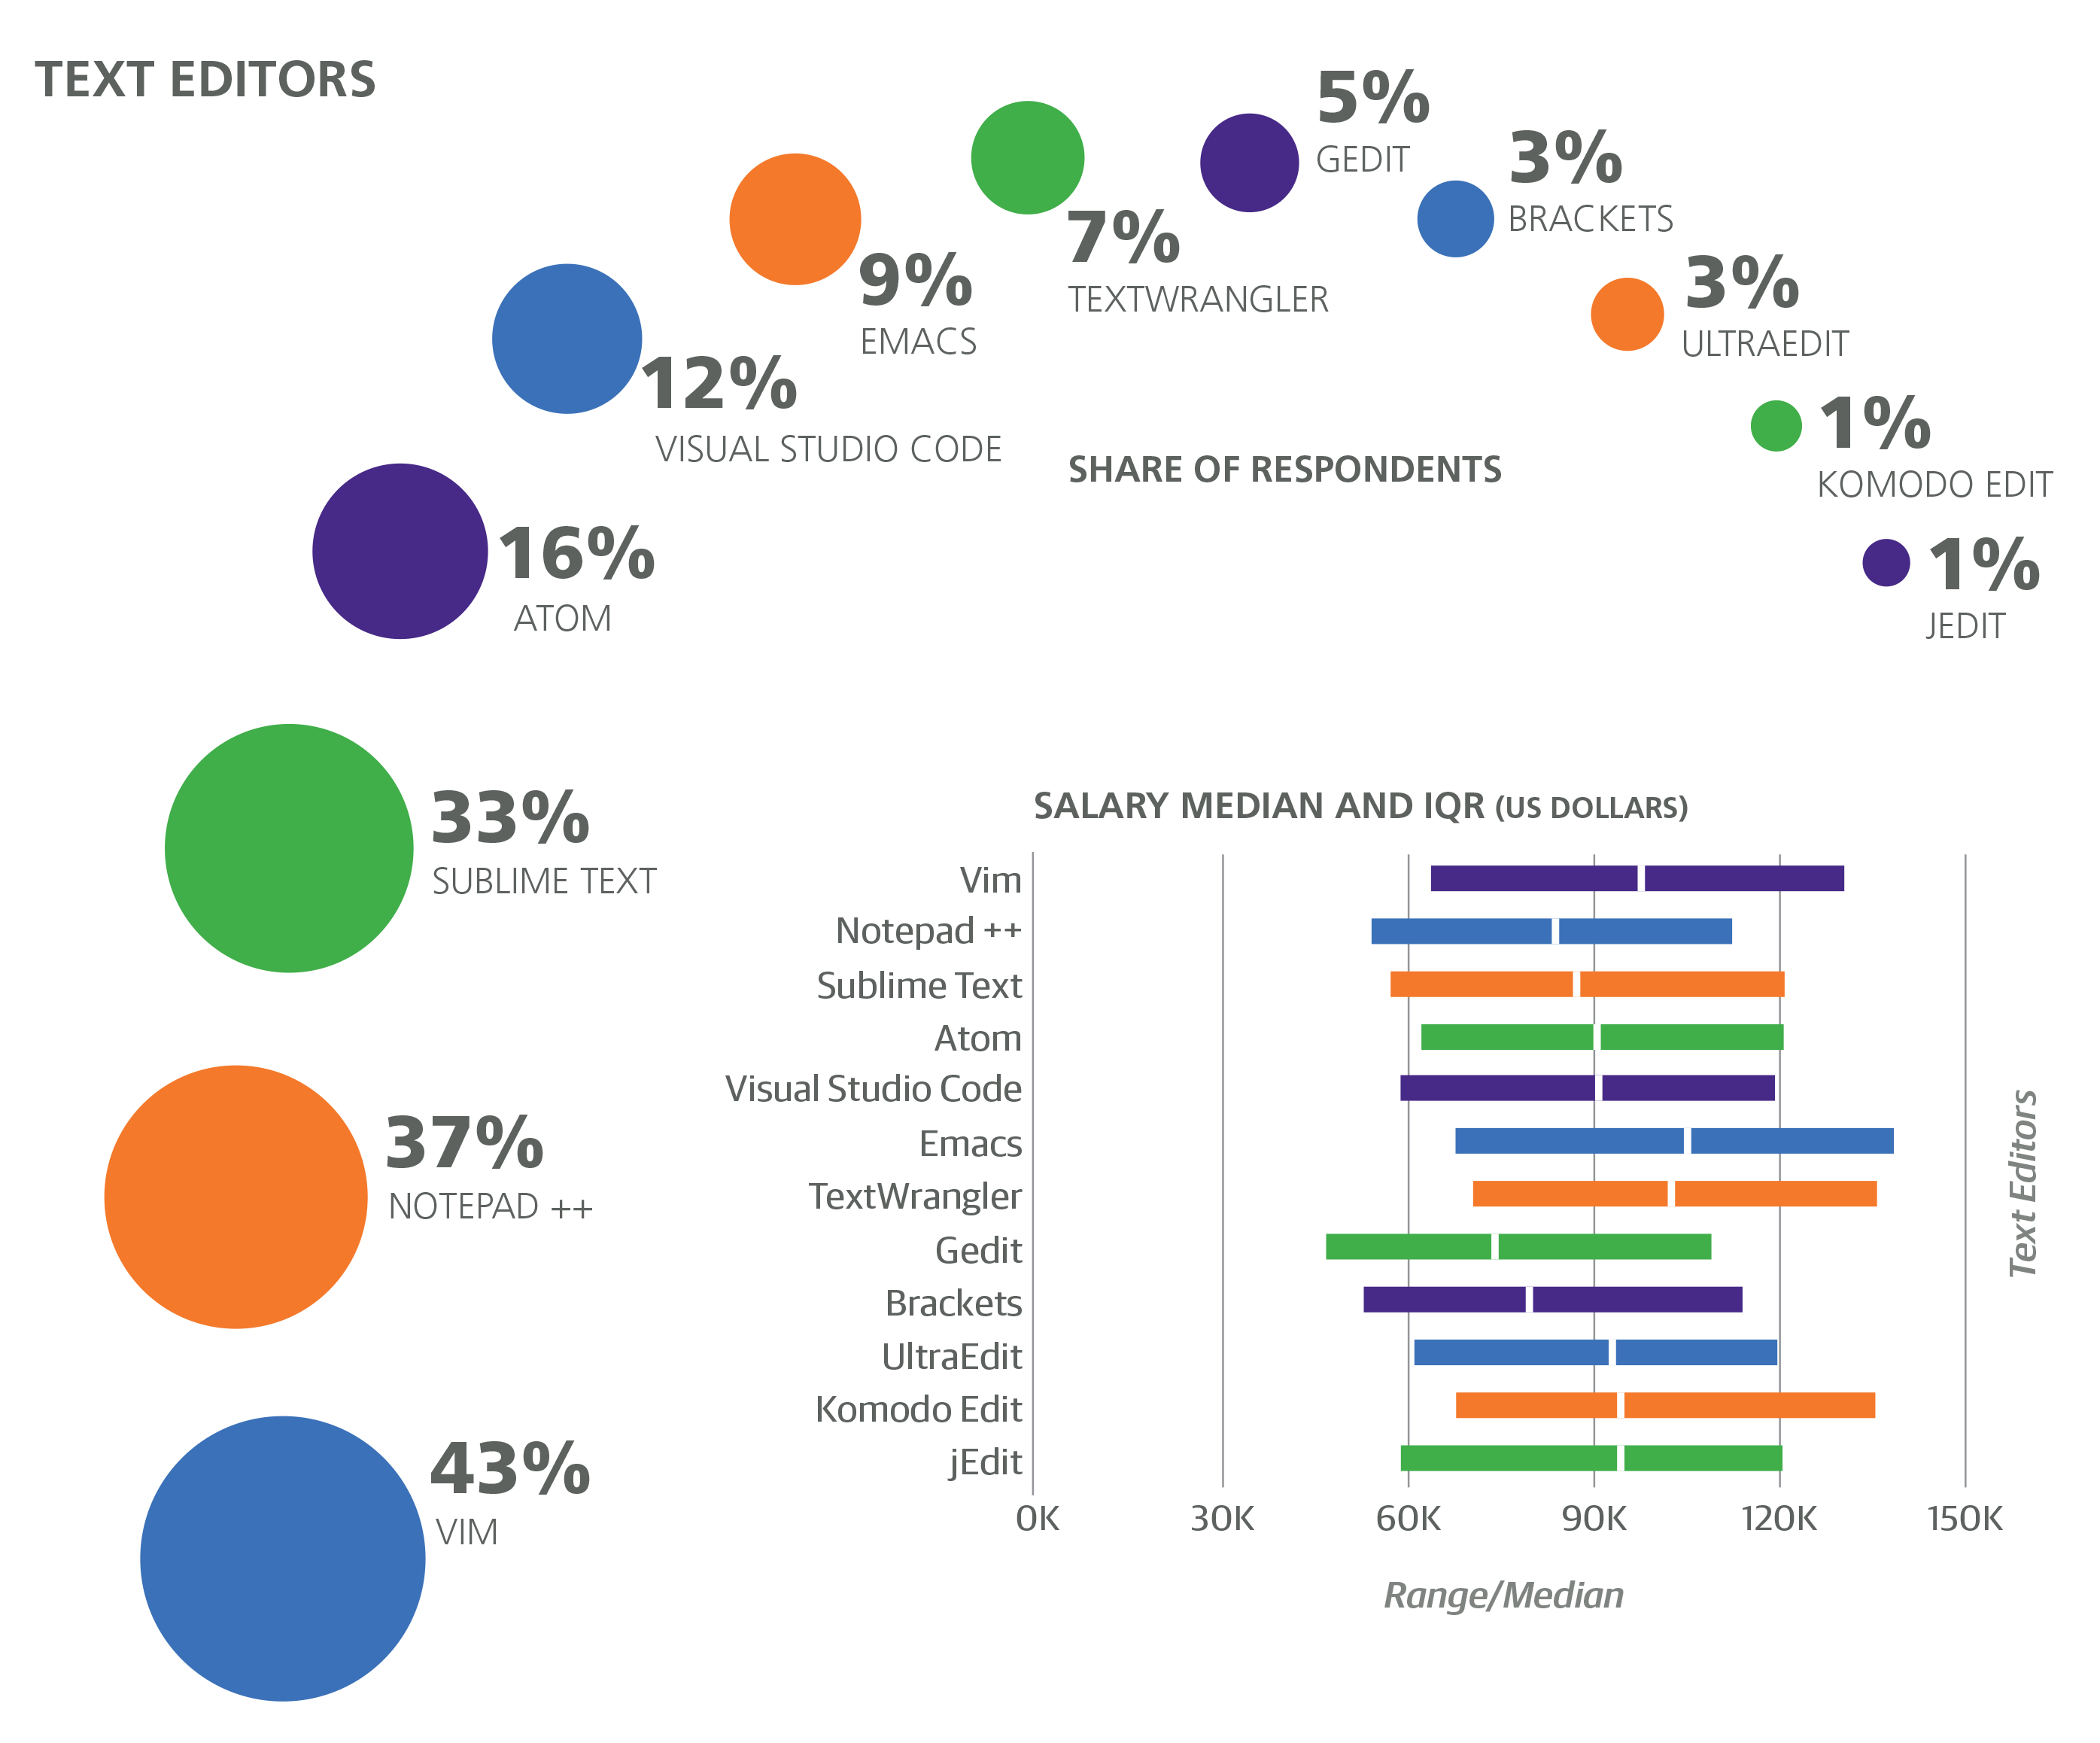
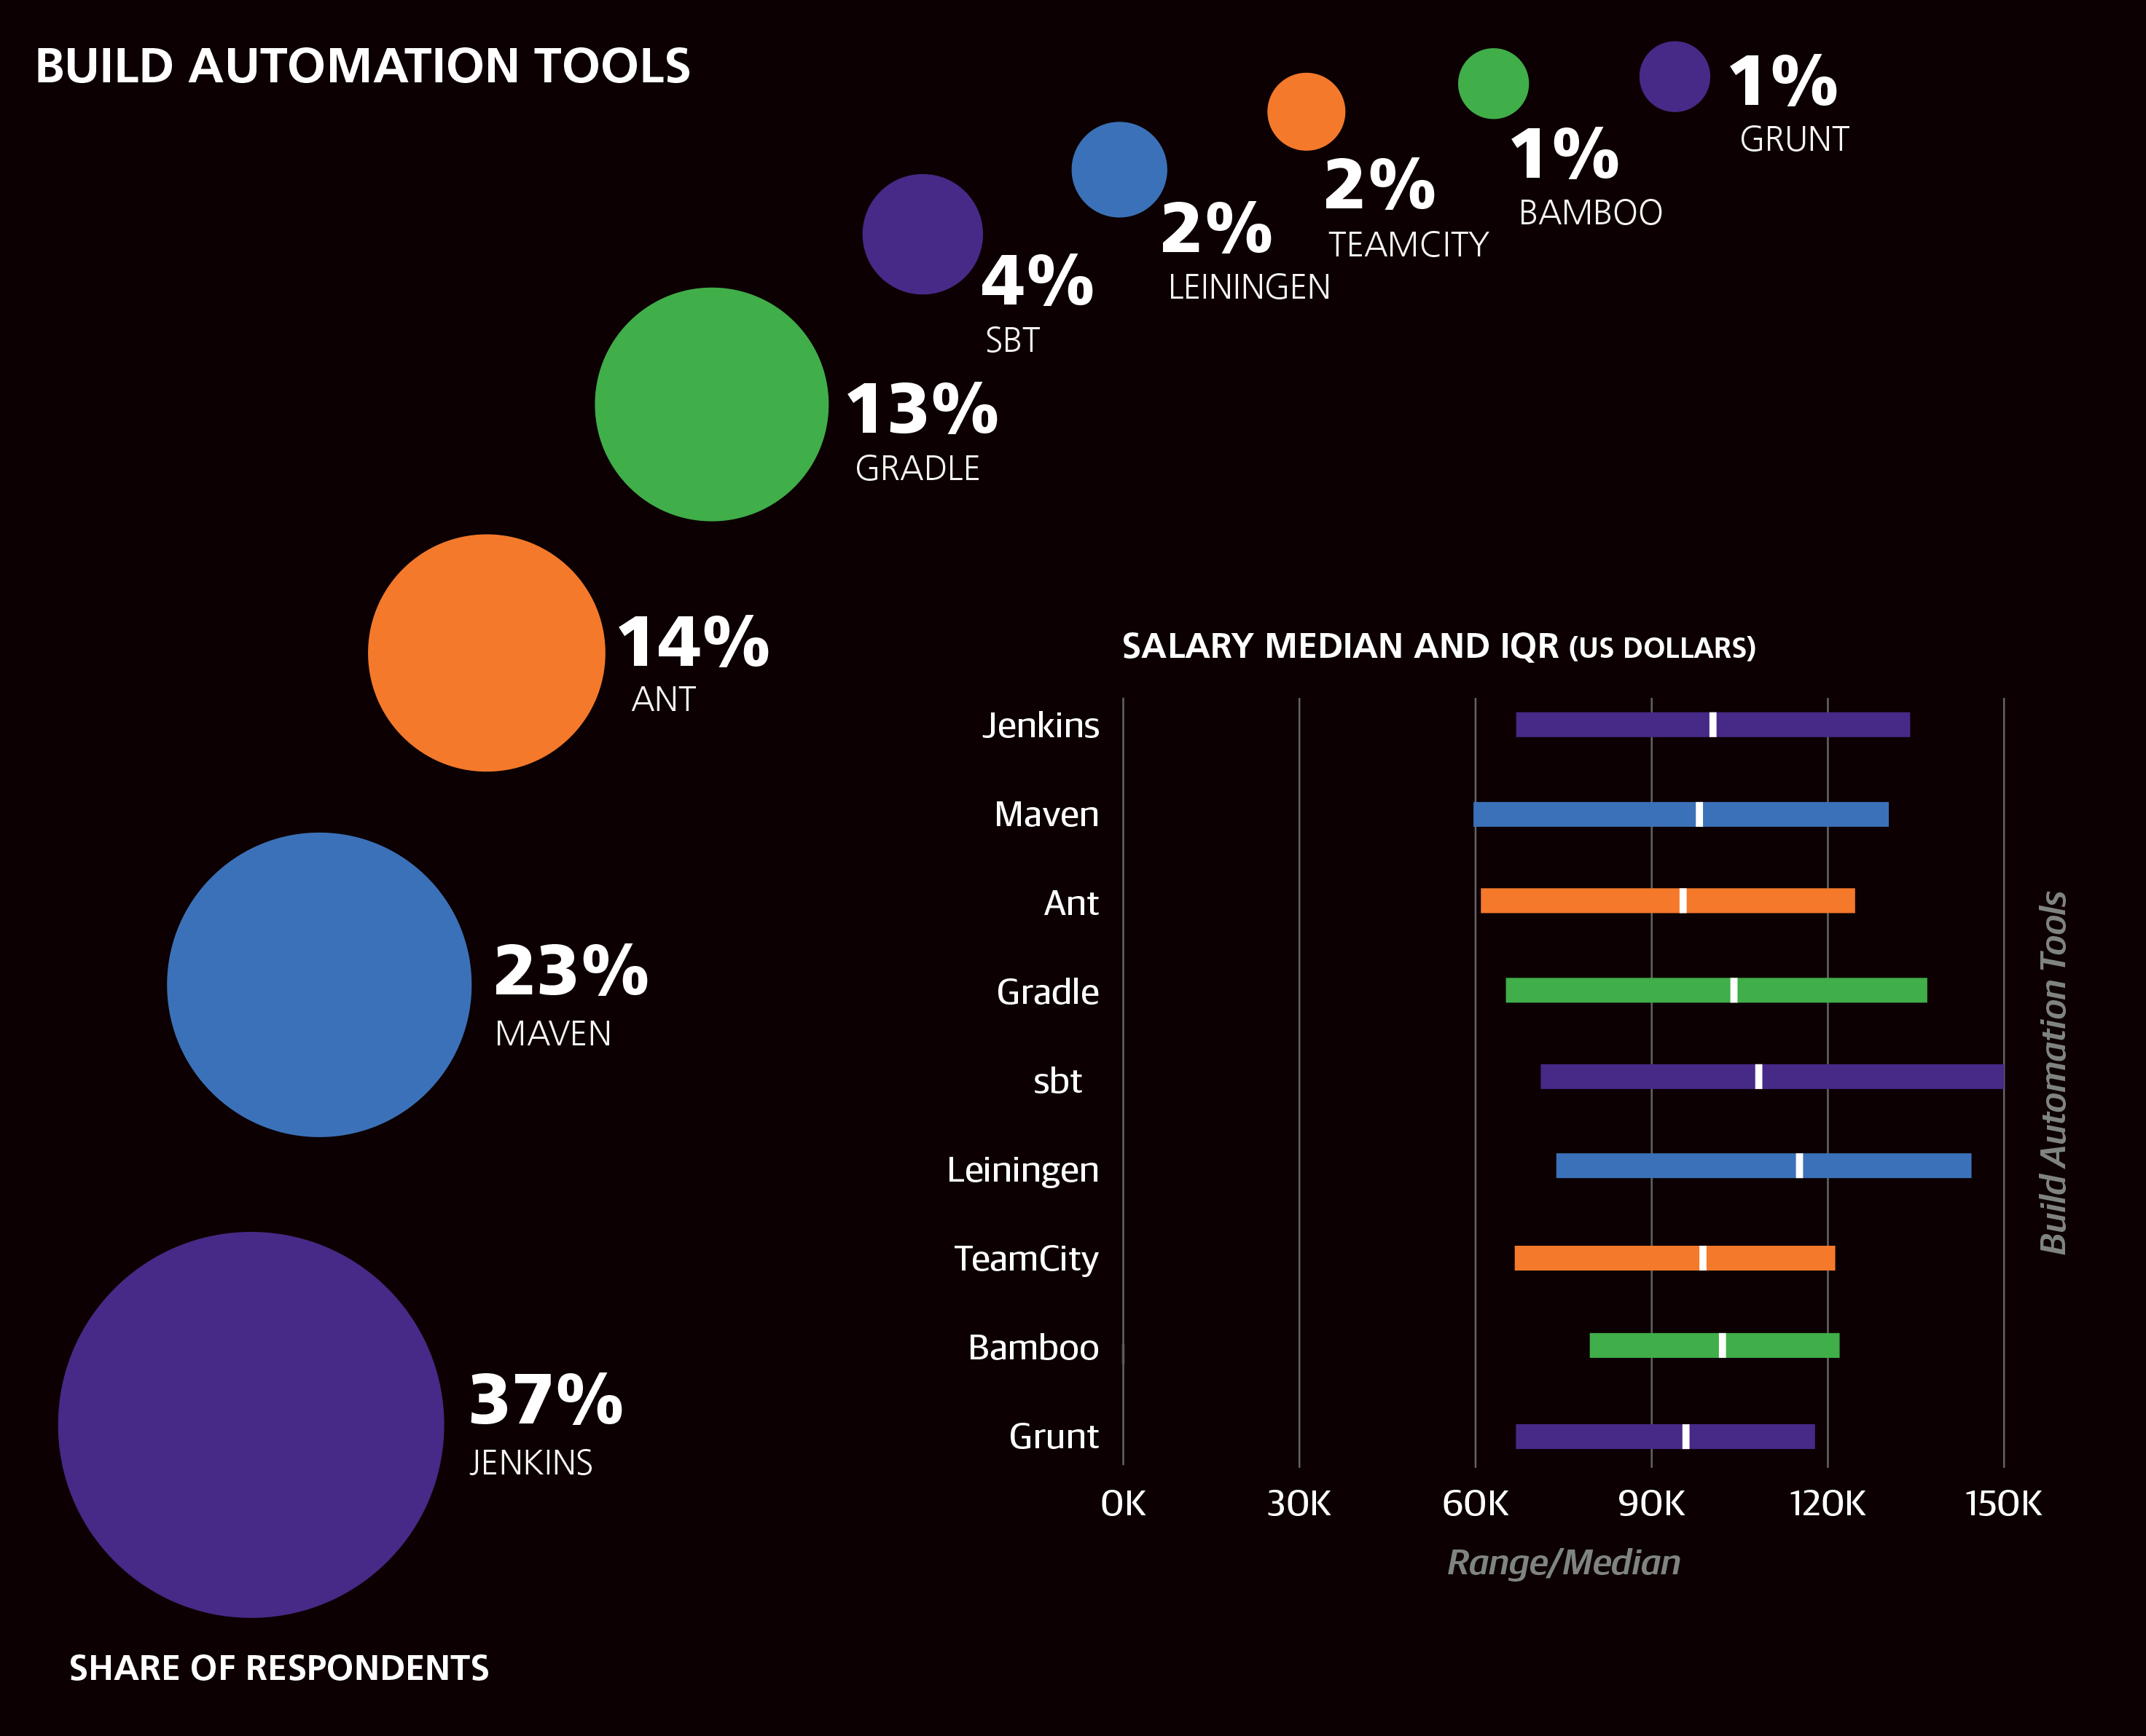
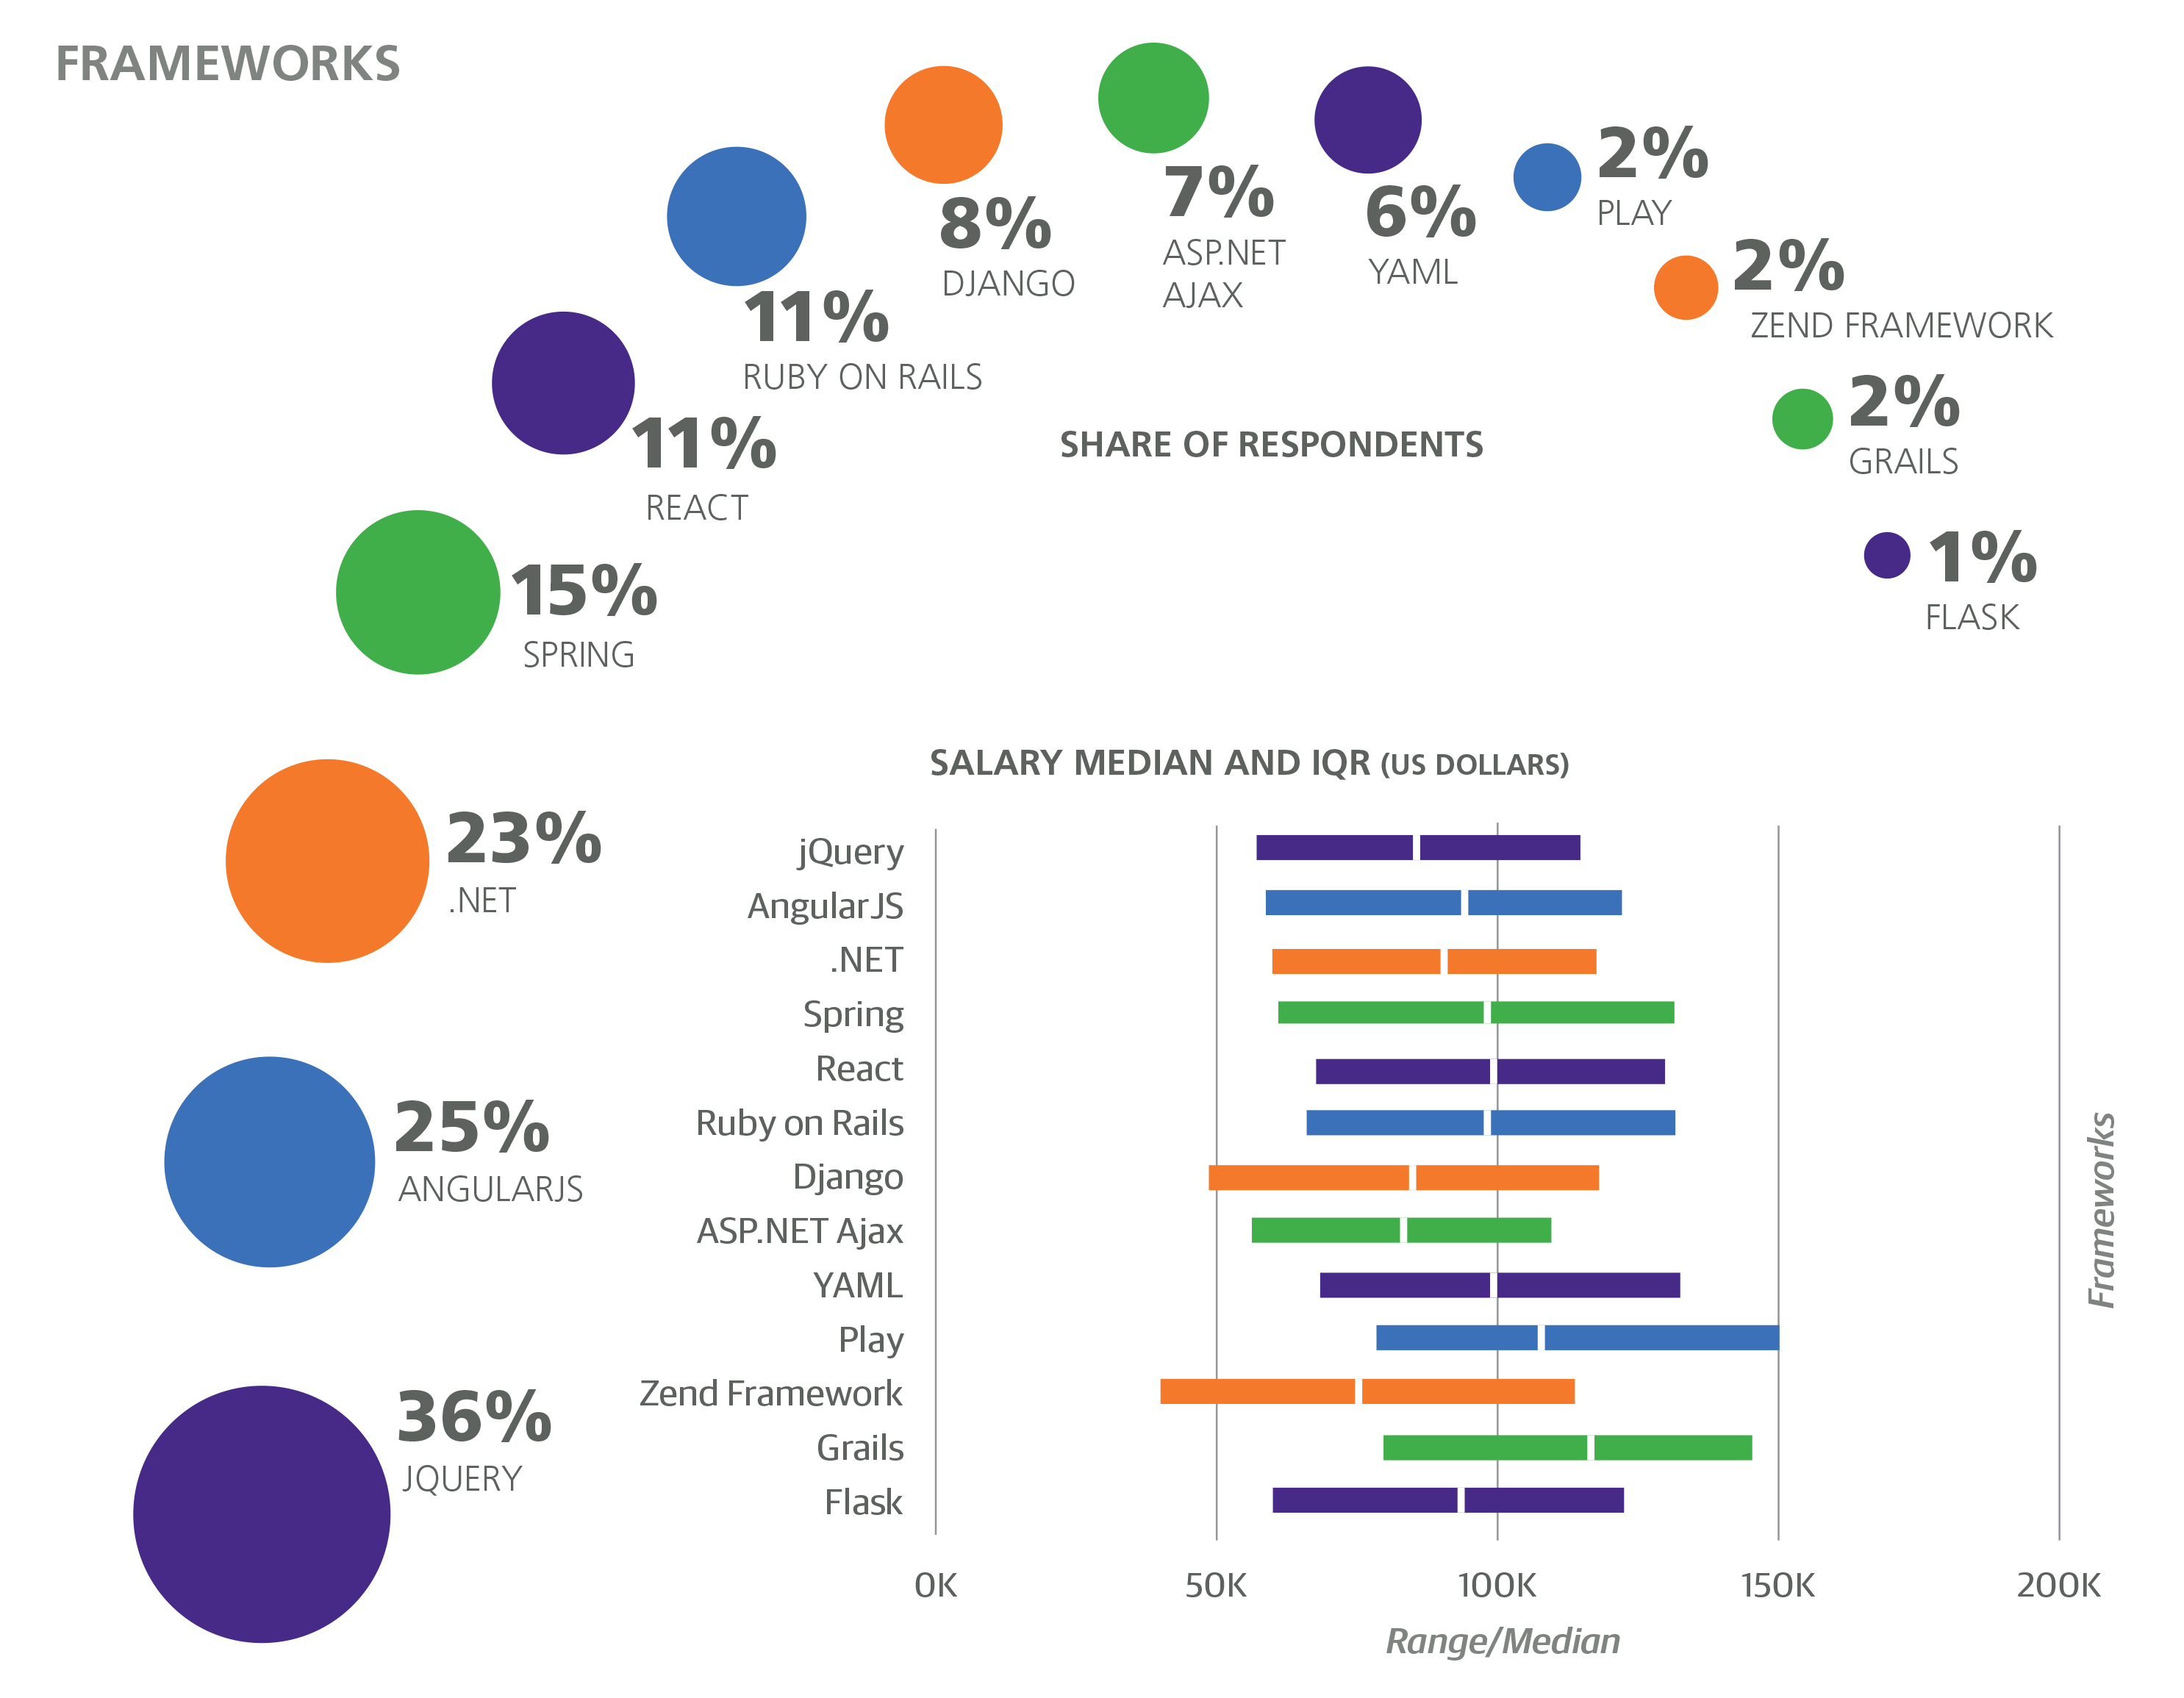
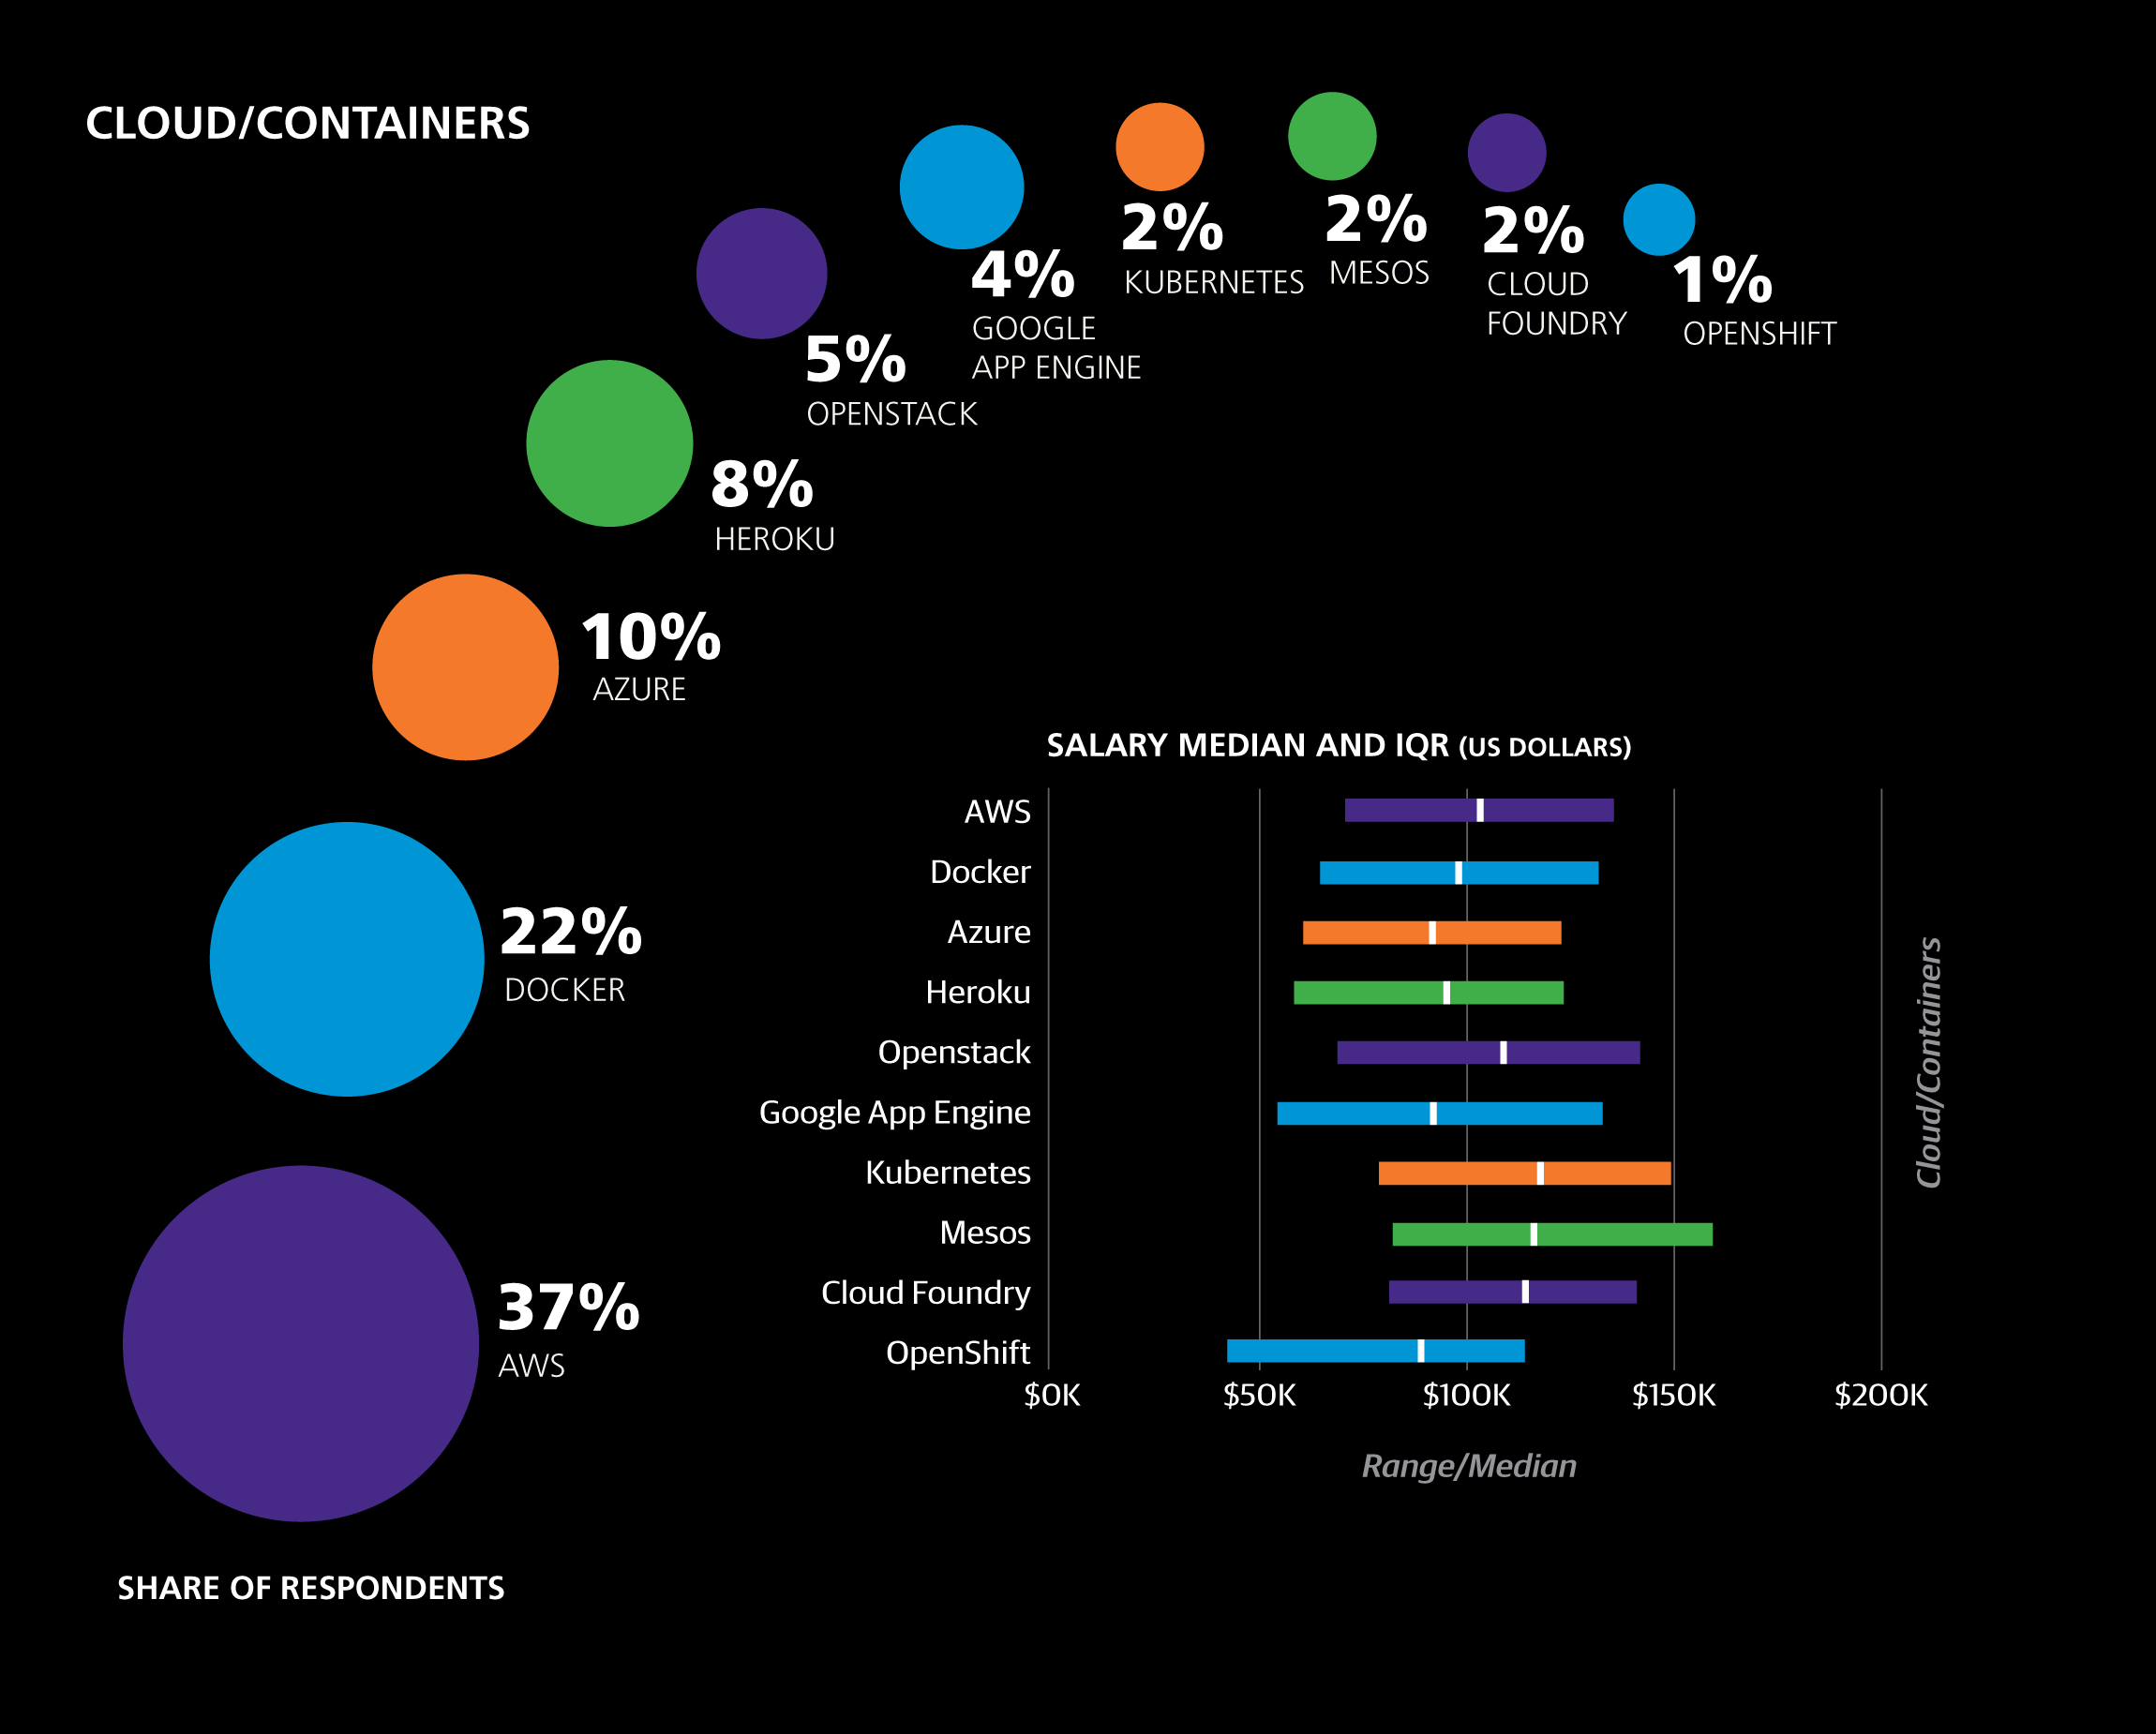
Eight categories of tools were included as binary questions on the survey; respondents simply marked the ones that they currently use in a professional context. The tool categories were operating systems, programming languages, text editors, IDEs, data tools, cloud/containers, build automation tools, and frameworks. On average, respondents used 3.75 programming languages and 14.6 tools of any kind. Less than 2% of the sample used fewer than 5 tools, while 18% used at least 20. Some tools seemed to encourage a larger toolkit: respondents who used Grails, Perl 6, HBase, Lua, Kubernetes, OpenShift, or Swift used 21–23 tools on average.
Instead of feeding individual tools into the model (which would result in a small selection of them being chosen as model coefficients), we instead have first built clusters of the most frequently used tools, and then offered them to the model as per-tool features. That is, a coefficient associated with a cluster adds (or subtracts) that dollar amount from the salary estimate times the number of tools used in the cluster (up to a maximum number of tools). The motivation behind this is that tools are often highly correlated with one another, and when individual tools are used as features, the model will select one from a correlated group as a sort of representative. Operating systems were excluded from the clusters.
The 14 clusters were formed using the Affinity Propagation algorithm in scikit-learn, with a transformation of the correlation coefficients between pairs of tools serving as the similarity metric. The essential idea is simple: for two tools in a cluster, if a respondent used one, she is more likely to use the other as well. It should be noted that this is not necessarily true for every pair of tools in every cluster. Many respondents used tools from multiple clusters (4.7 clusters on average), and there were large, positive correlations between a number of tools in different clusters. However, the clusters produced represent an efficient series of compromises for all of the irregularities in tool co-usage and provide a decent picture of which tools tend to be used with which others.
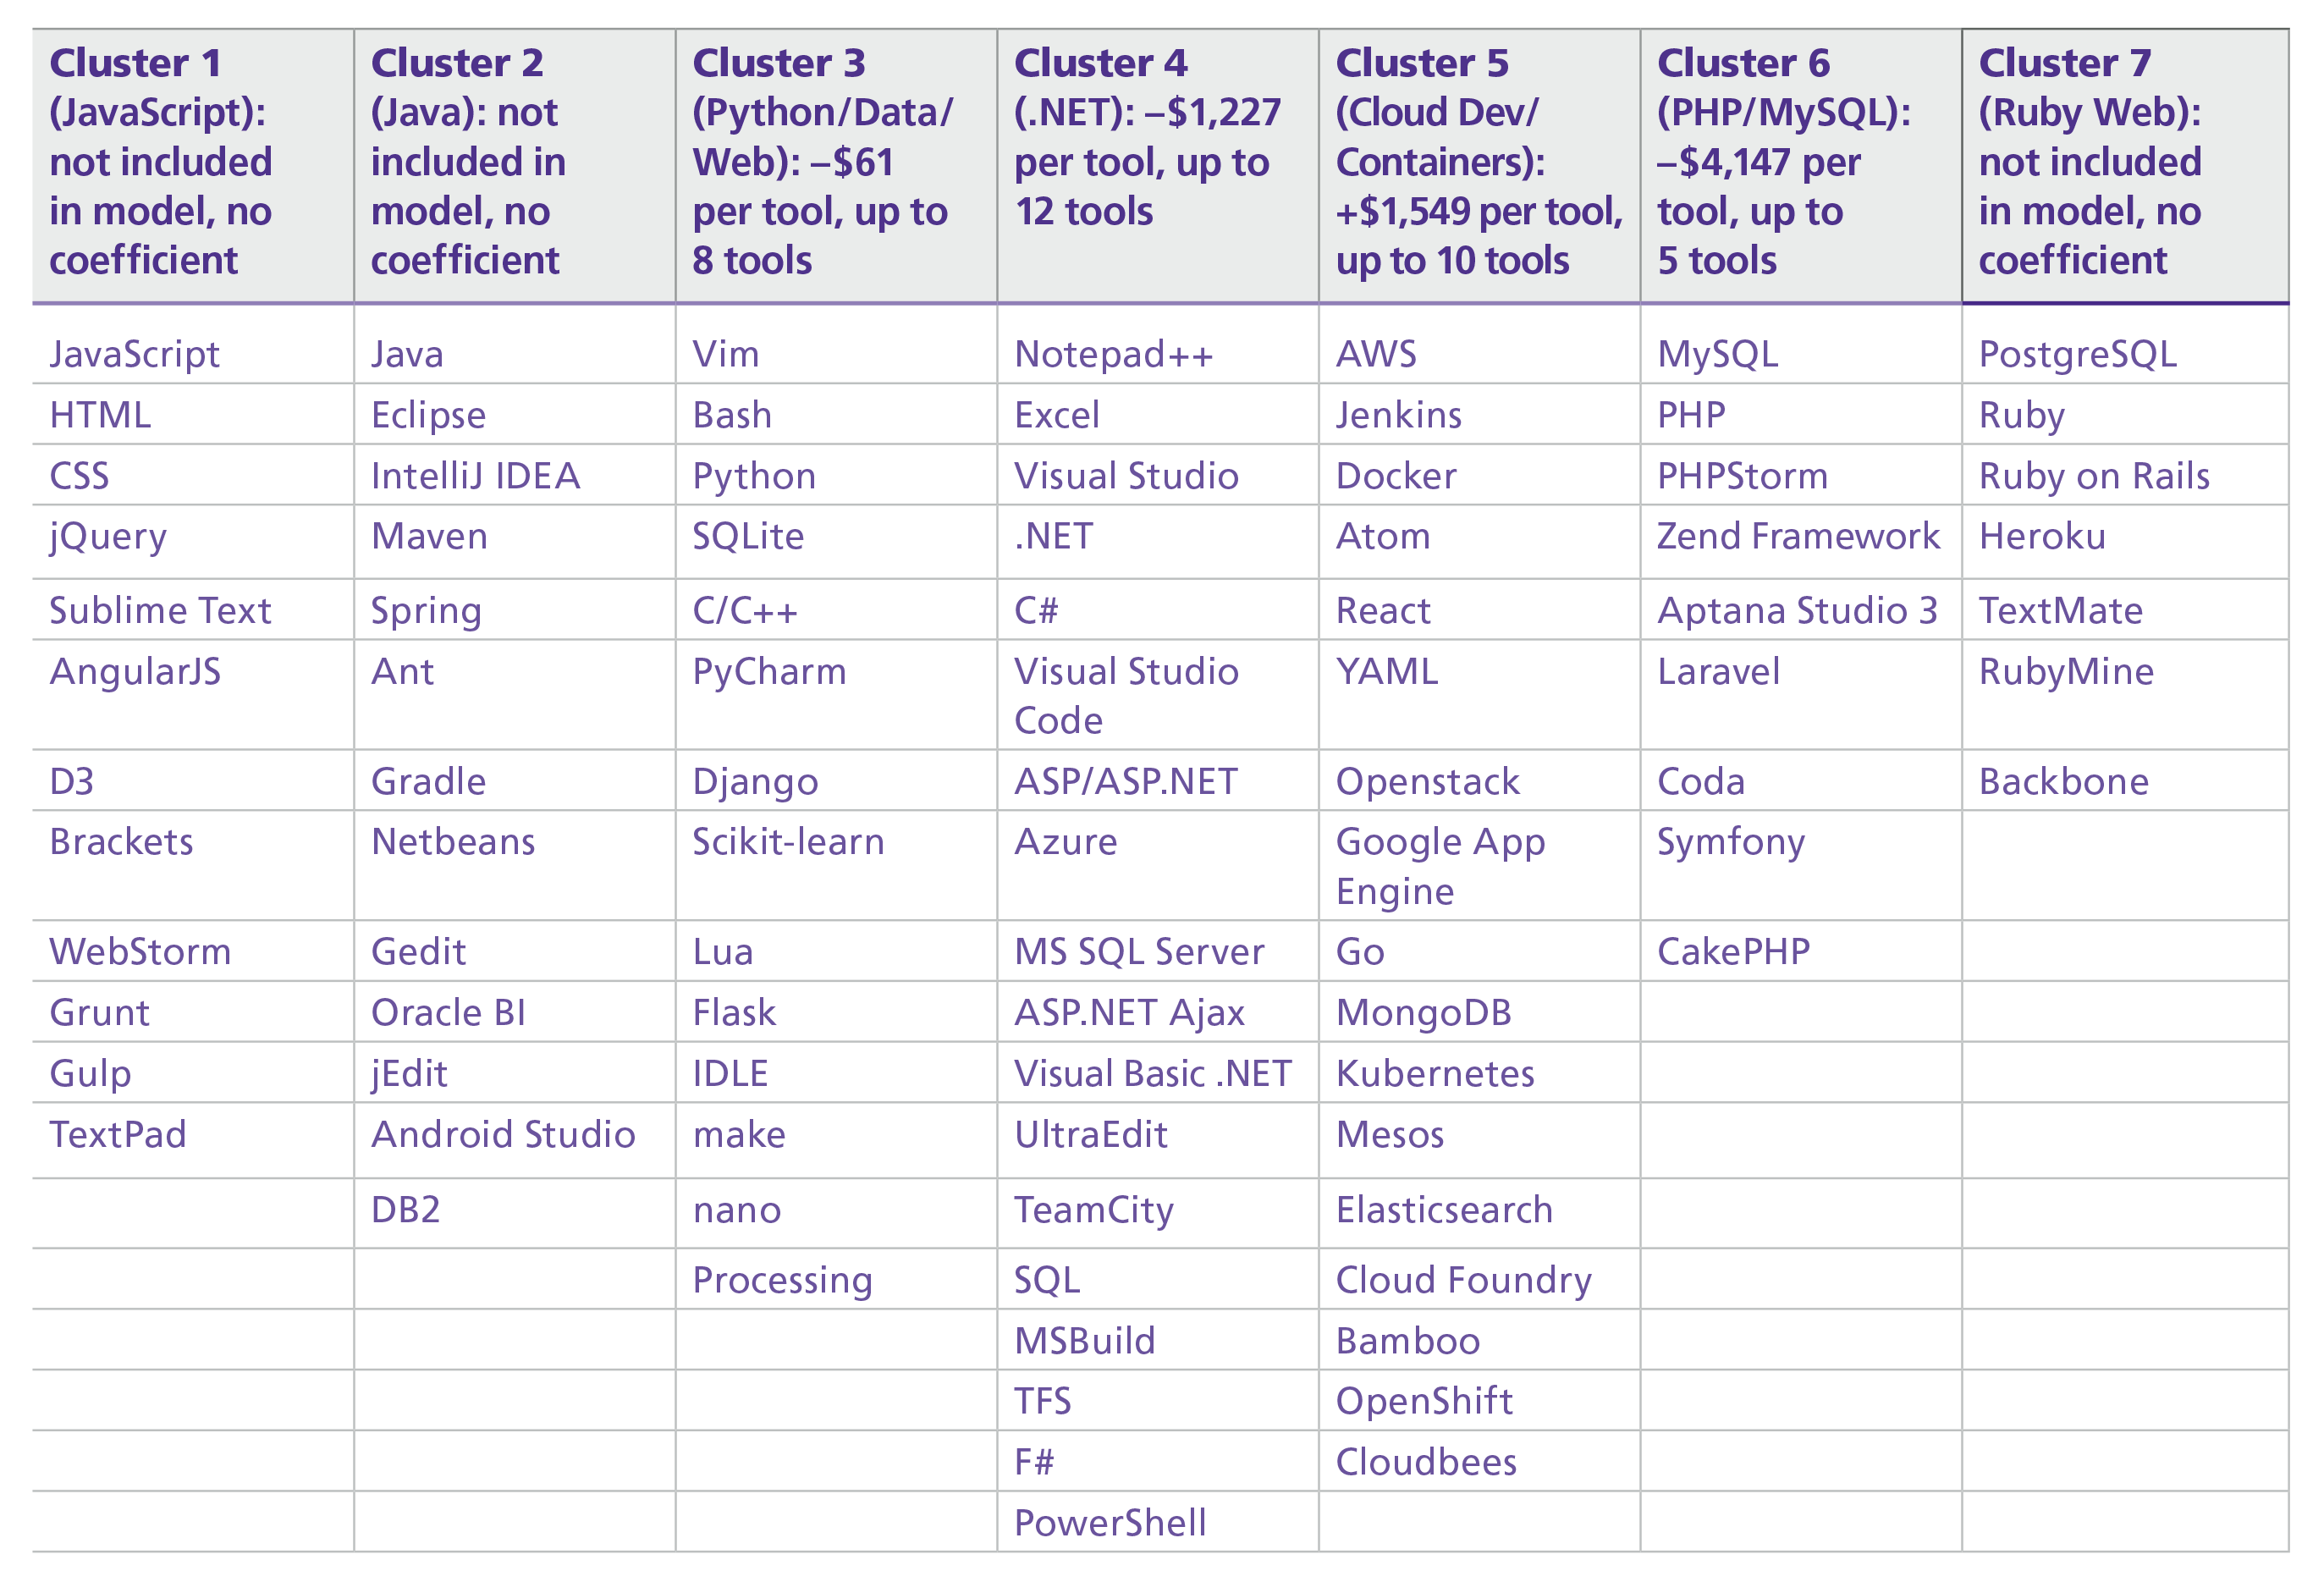
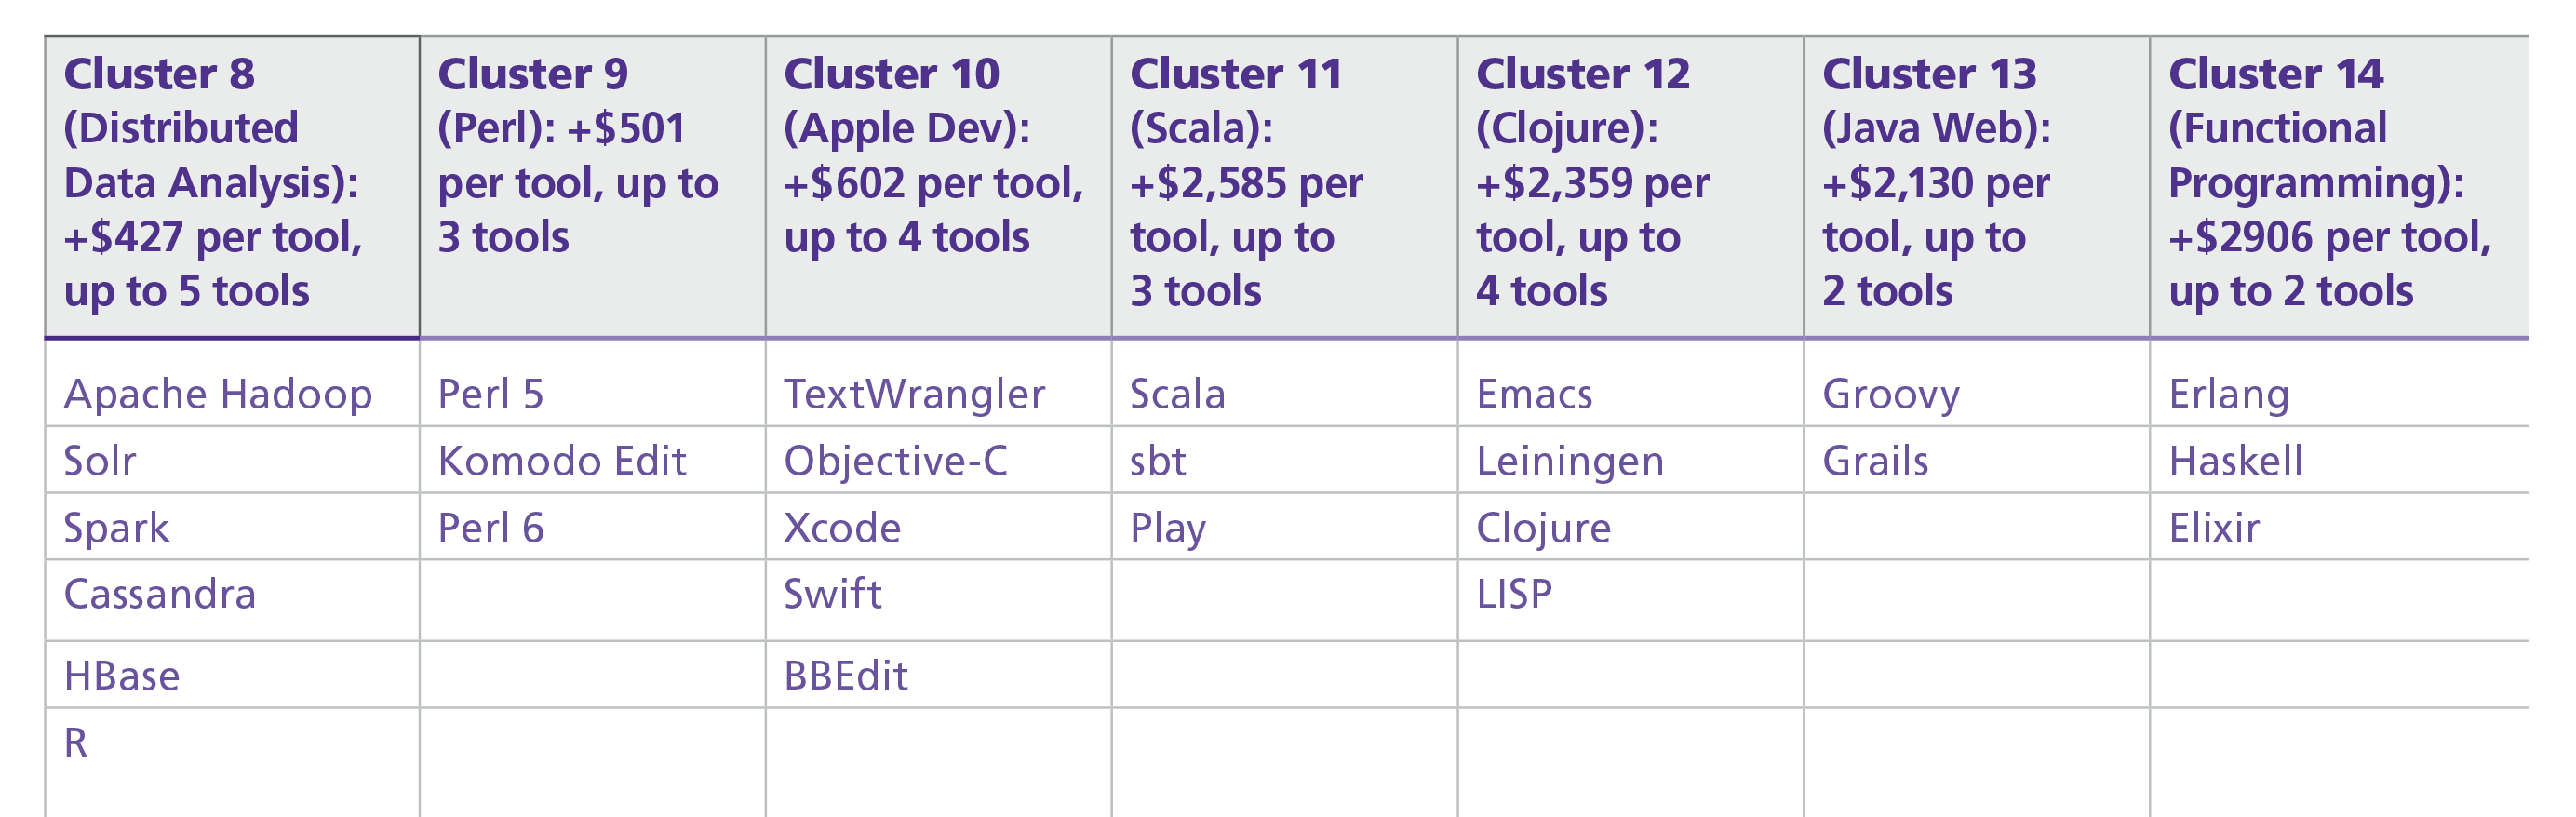
The salary estimate contribution for each cluster is obtained by multiplying a cluster’s coefficient by the number of tools you use from the cluster. For each cluster with a nonzero coefficient, a maximum number of tools is noted; if you use more than this number of tools from the cluster, only multiply the coefficient by the maximum number. The algorithm produces the 14 clusters shown on the following pages; we’ve named the clusters (in parentheses) as a mnemonic device.
The first cluster is focused on JavaScript, the most commonly used tool (other than operating systems). On average, respondents used 2.5 tools from this cluster, and only 24% did not use any tools from the cluster. There was no coefficient associated with Cluster 1 in the model. React, the JavaScript UI tool, was not in the cluster: use of React correlates more strongly with the tools in the Cloud Development cluster (Cluster 5).
The second cluster is a Java stack, although notably languages that run on Java—such as Scala and Clojure—are in their own clusters (11 and 12). Cluster 2 does not have a model coefficient; using more or fewer of these tools does not appear to affect salary after all of the variables are taken into account. OracleBI seems an outlier on a list of mostly Java tools; the correlation of OracleBI to the other tools may indicate a higher concentration of enterprise (i.e., big organization) use of Java.
Cluster 3 is typified by Python, although Vim and Bash have more users. Cluster 3 has a small, negative coefficient of –$61. Respondents used Python for a variety of programming tasks, as reflected in the tools in this cluster, including data management, data analysis, and web applications.
Cluster 4 consists primarily of Microsoft products (in particular, those in the .NET framework) and has a large negative coefficient of –$1,227. This was the second most well-used cluster: on average respondents used two tools from this cluster. That Excel shows up high on the list in the .NET clusters seems a sign that Excel is an integral part of .NET developers’ toolboxes, for analytics, data query, data investigation, and other uses.
Cluster 5 has a cloud/container theme, containing tools such as AWS, Jenkins, and Docker. With a coefficient of +$1,549 per tool, this cluster has the highest potential salary estimate contribution of all of the clusters. Cloud computing pays. The appearance of the JavaScript UI tool React in the cluster shows that the Cloud is used for app development; most of the tools in the cluster are used by web engineers to manage complex, cloud-based web application platforms, and also reflect the move to containers for portable cloud deployment.
In contrast to Cluster 5, Cluster 6 has the largest negative coefficient: –$4,147 per tool. This is the PHP/MySQL stack, one that may be going somewhat out of style. Still, 43% of the sample used at least one tool from this cluster. The PHP/MySQL cluster appears to be a silo with no strong correlation to other web development tools—an indication that PHP/MySQL represents a separate web development path for the survey respondents.
Cluster 7, like Cluster 6, consists of tools that mostly support building web apps (with RoR, and postgres as the backend database). This cluster did not have a coefficient. Ruby on Rails seems the center of gravity for the Ruby Web cluster, along with a few infrastructure tools that support Ruby on Rails.
Cluster 8 is centered around data processing and analytics, and notably it was split from Cluster 3 (Vim, Bash, Python), which also contained data tools. However, Cluster 8 seems to be more purely a data stack (Cluster 3 contained some web dev tools, for example). This cluster had a small but positive coefficient of +$427. The tools here are used for both data analysis and data engineering, but we think the appearance of Spark, Cassandra, HBase, and R indicate more emphasis on data analysis usage.
The six remaining clusters are much smaller both in terms of the number of tools in the cluster and the number of respondents who used them. Each is centered around one or two languages, and thus is simpler to interpret than some of the previous clusters. Furthermore, each had a large, positive coefficient in the model. These tools are largely emerging technologies (with the possible exception of Cluster 9, containing Perl), and their stacks have yet to be fully developed.
Past/Future Languages
Respondents were asked not only which languages they currently use, but also about those that they previously used (but no longer use) and those that they are planning to learn (within the next 1–2 years). Most respondents had at least one “past” and “future” language: only 18% of the sample had never used a language professionally that they no longer use, and 17% did not plan on learning any new languages.
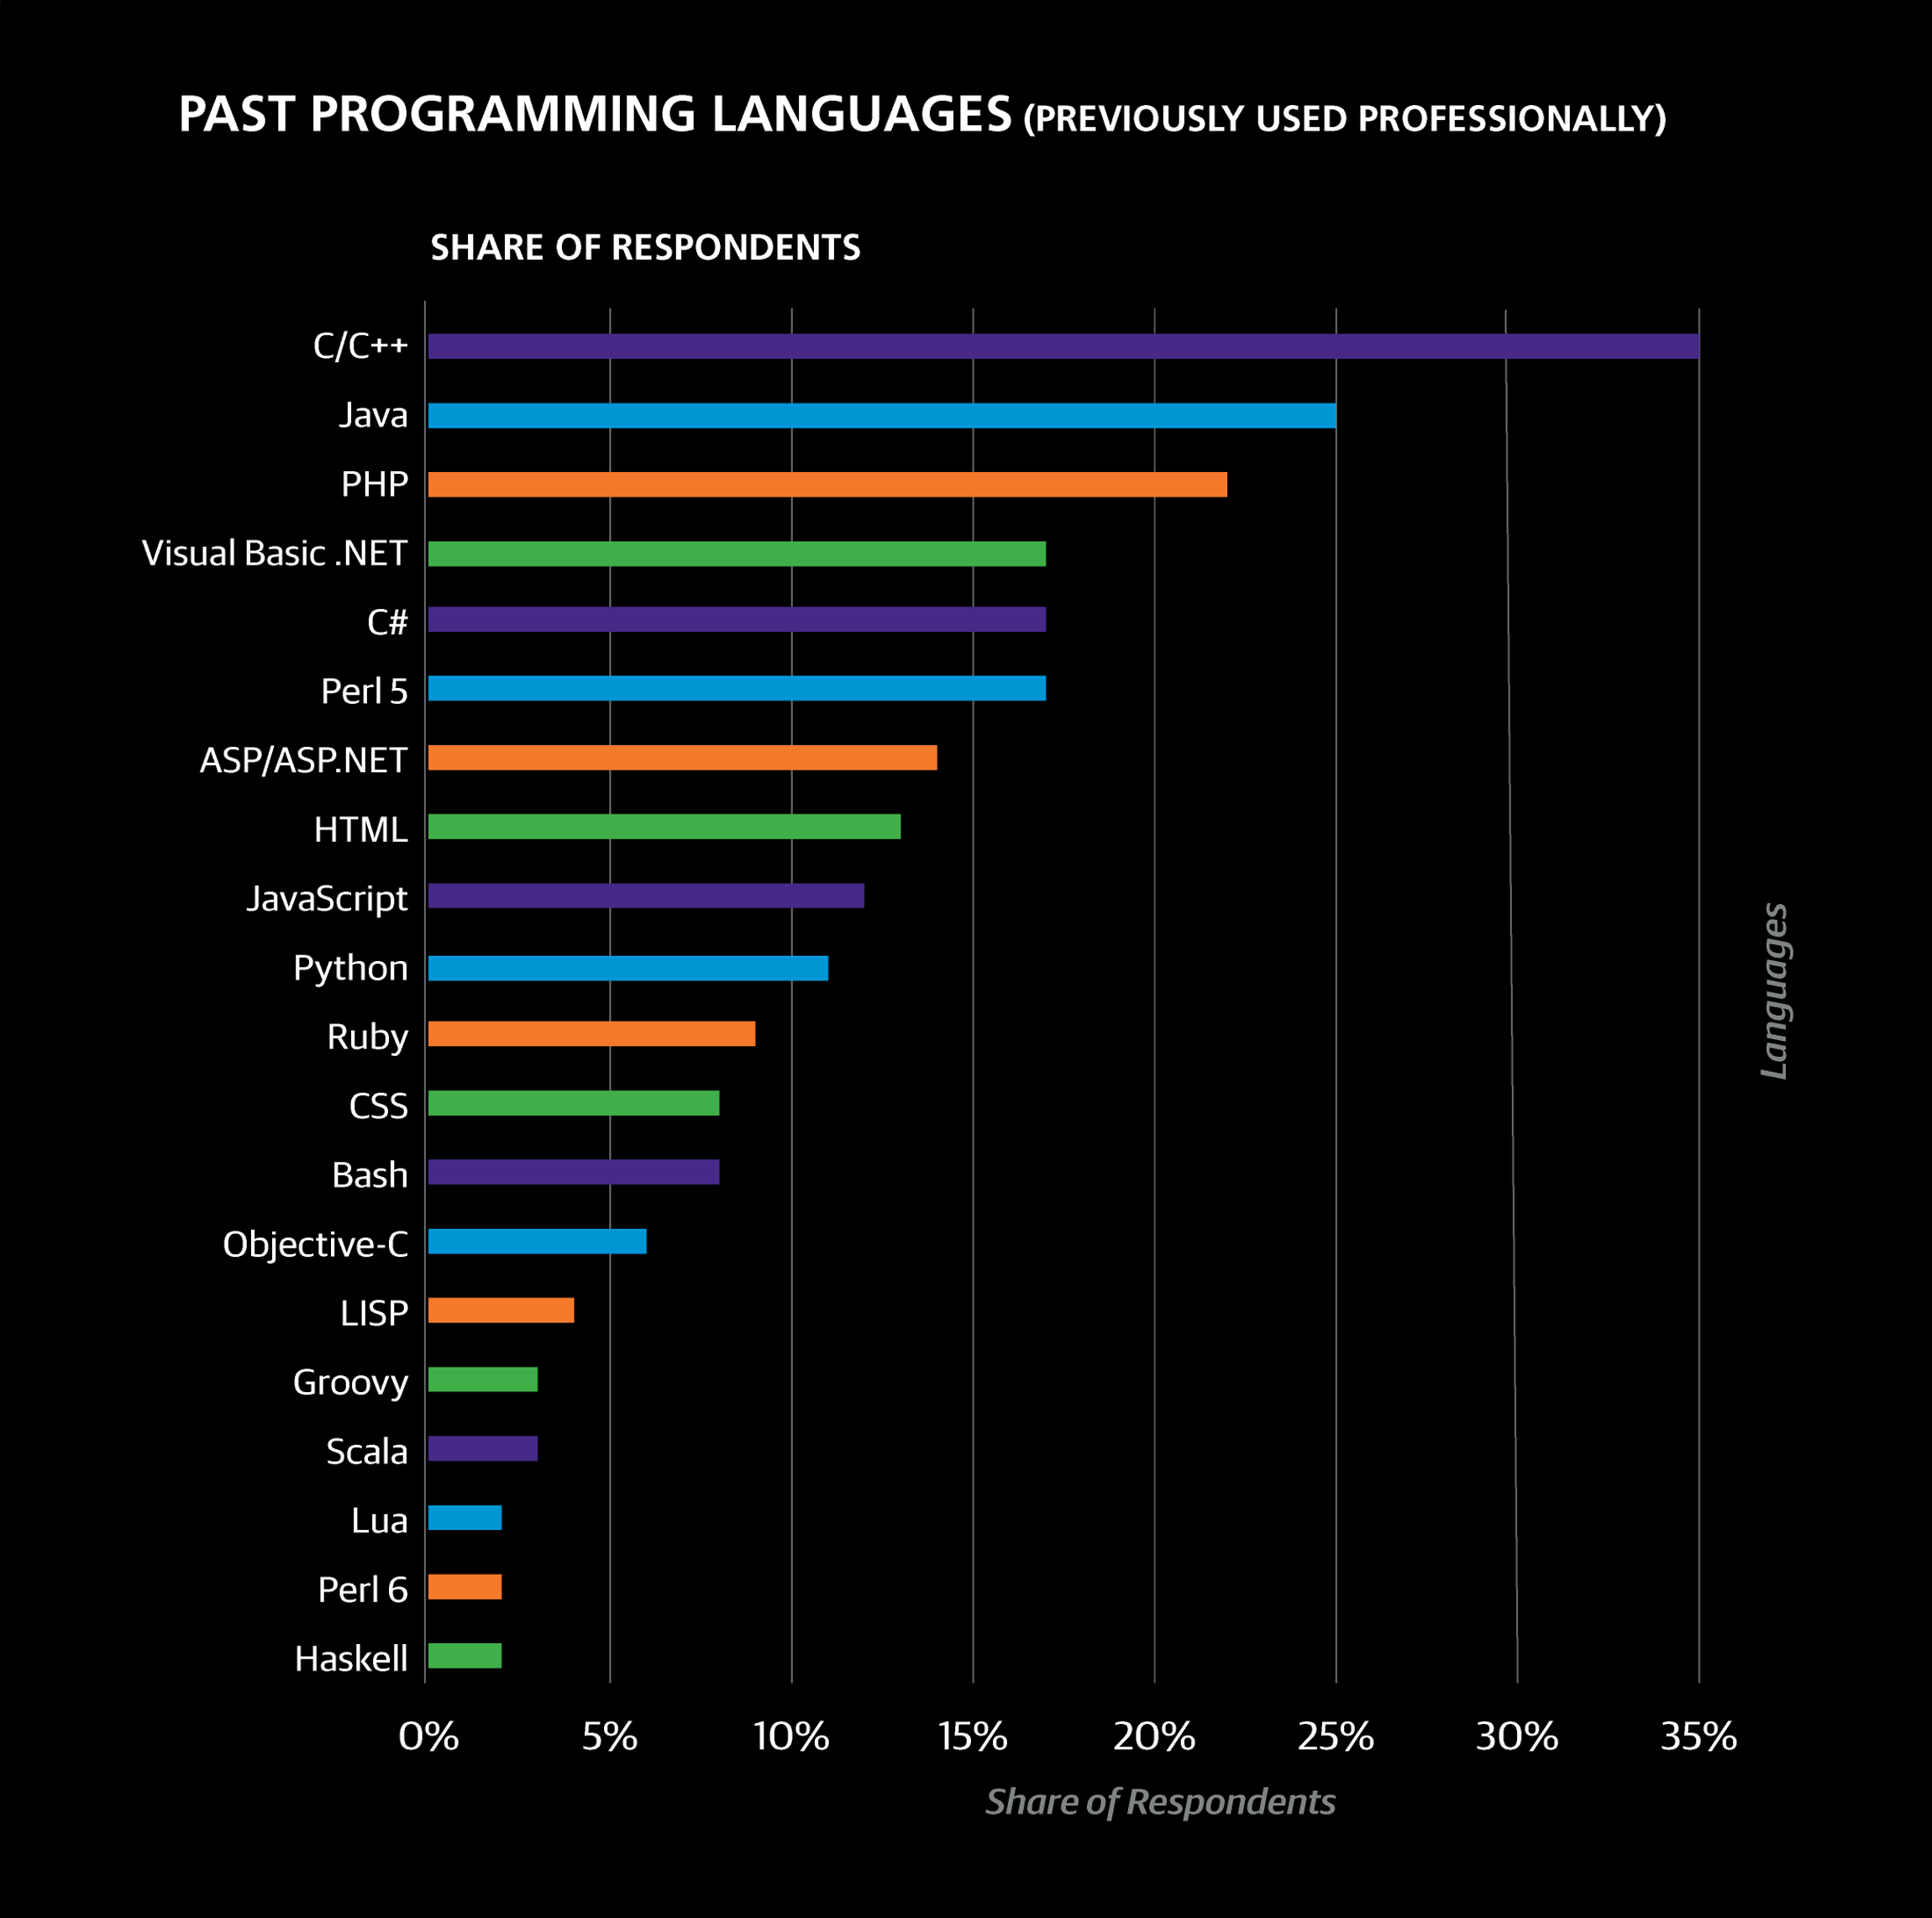
The most common “past” languages were C/C++ (35% of the sample), Java (25%), PHP (22%), Visual Basic .NET (17%), C# (17%), and Perl 5 (17%). This does not necessarily mean these languages are dead or dying: Java and C#, for example, were reported more frequently as currently used languages than past languages. LISP and Visual Basic, on the other hand, were reported more frequently as past languages than currently used languages: 4% vs. 1% for LISP and 17% vs. 4% for Visual Basic. Interestingly, Visual Basic also correlates highly with two sectors: Banking/Finance and Government.
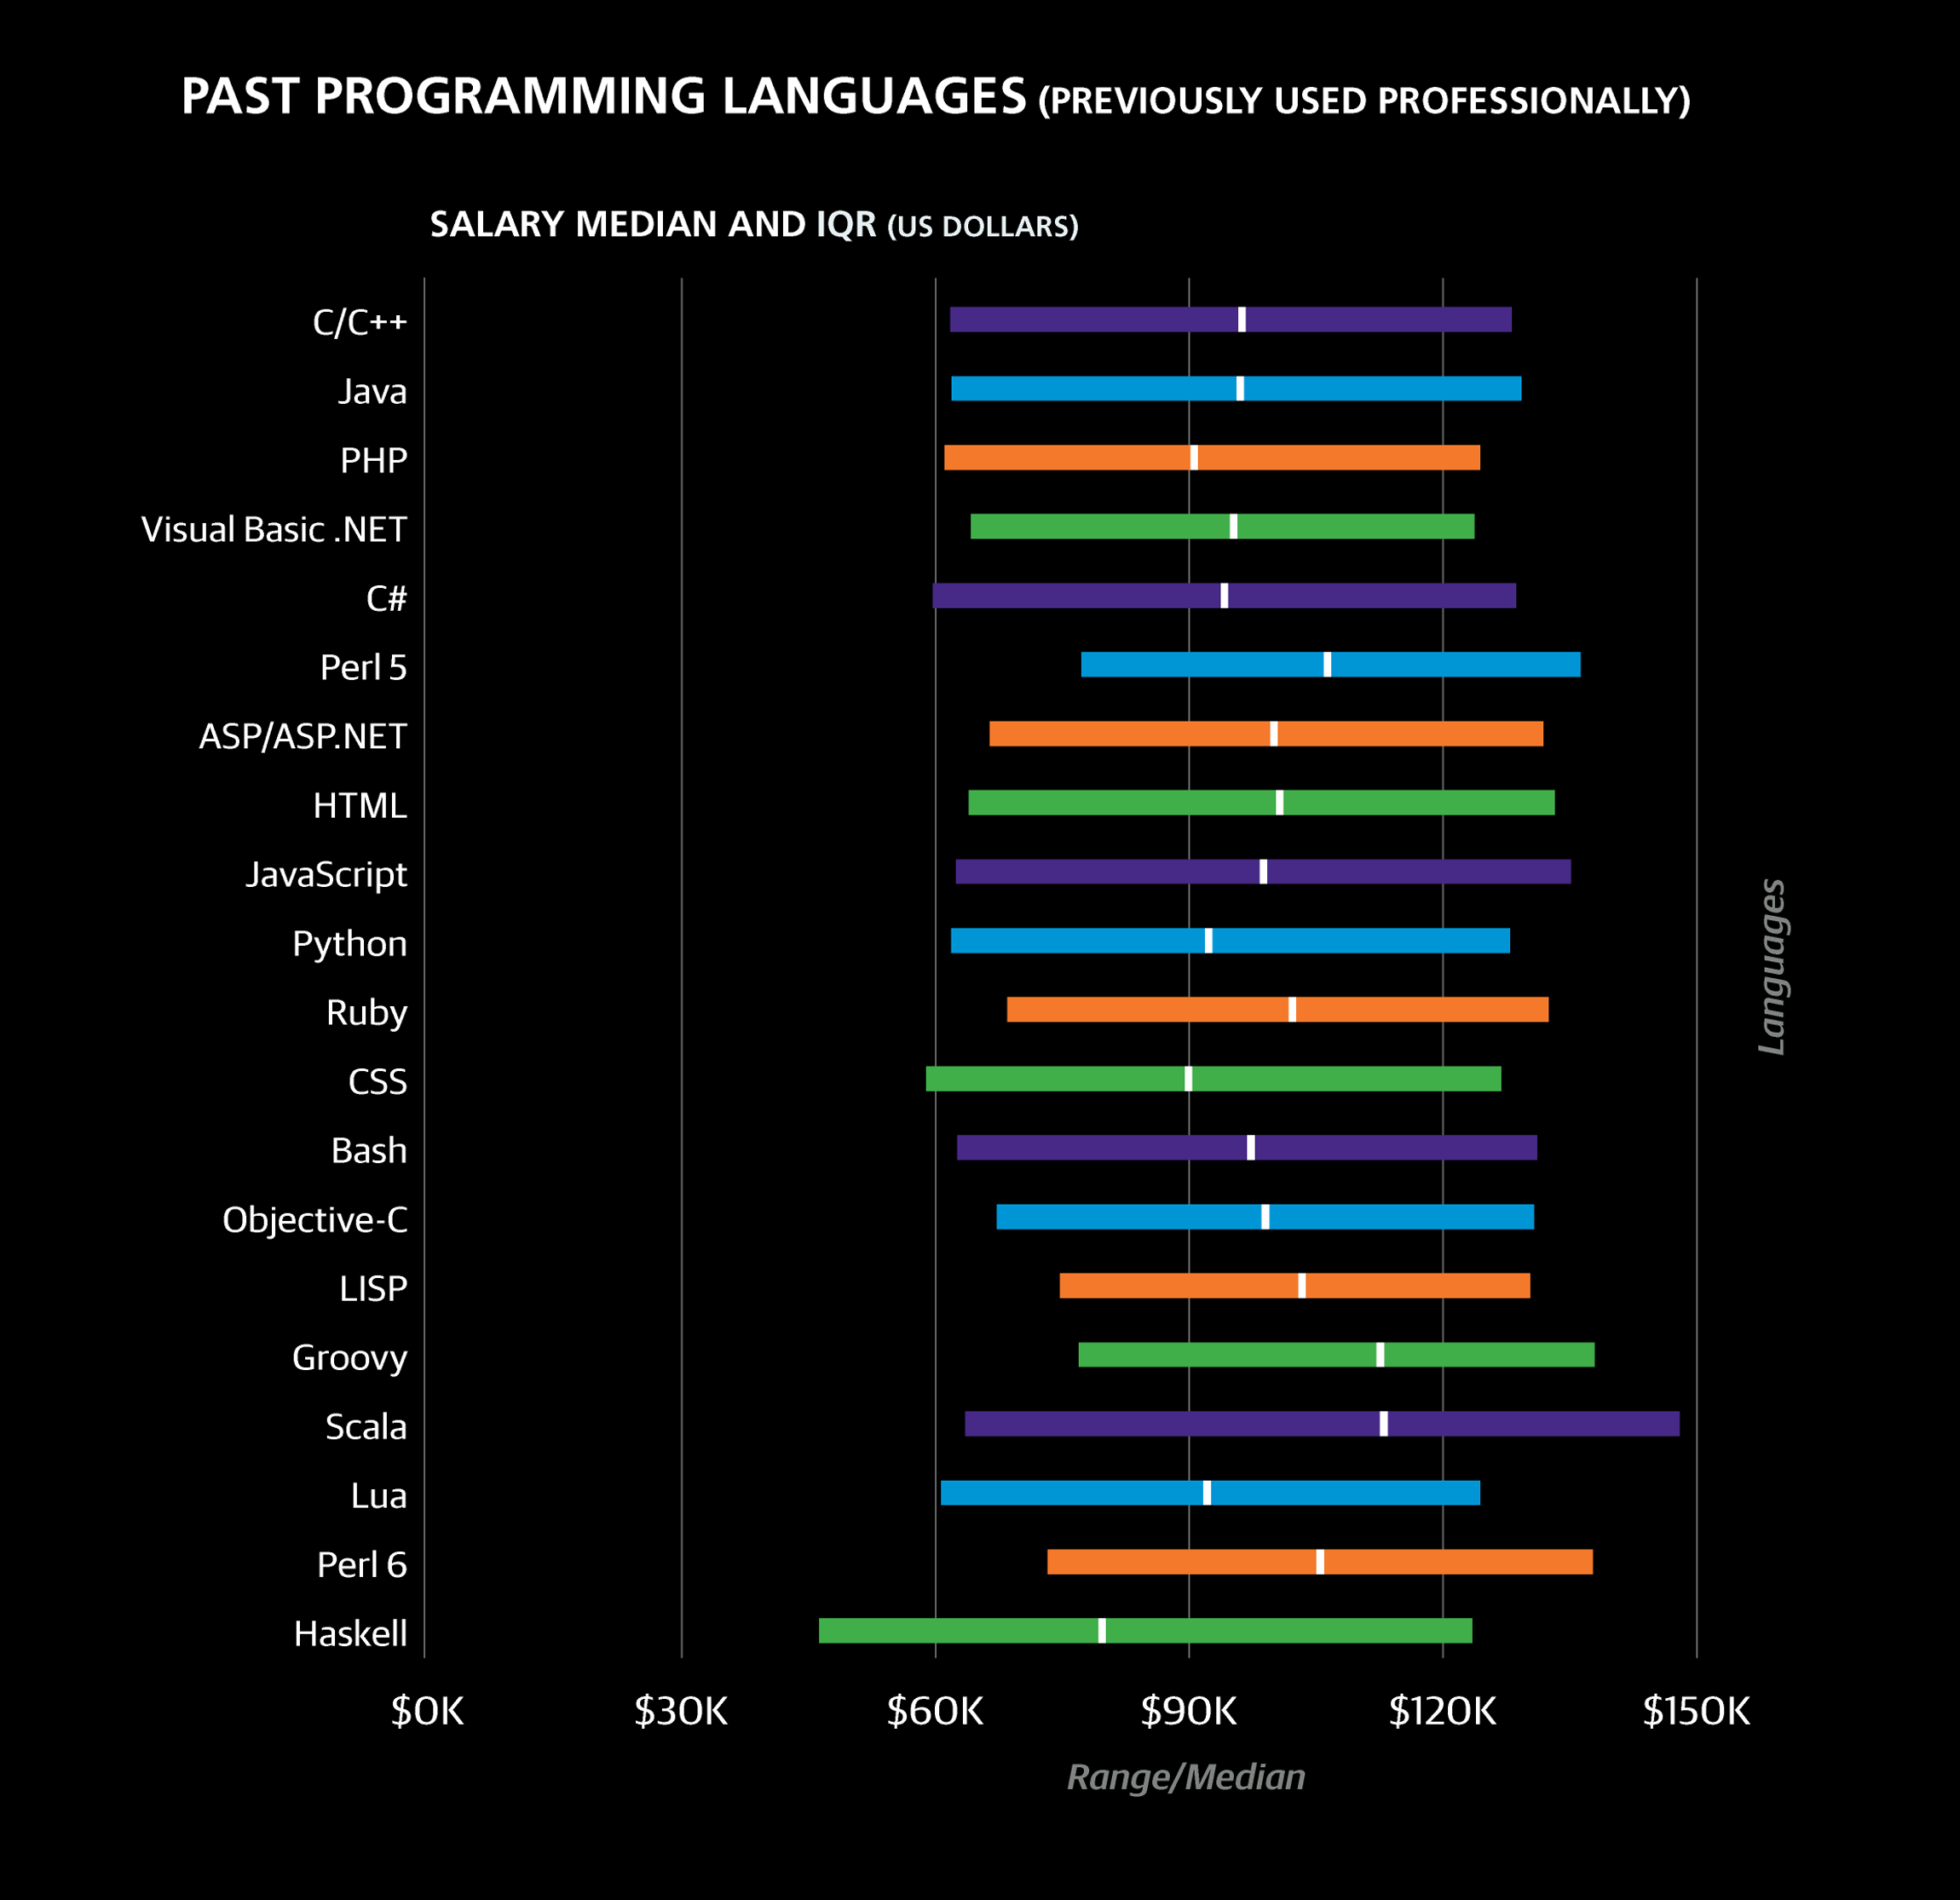
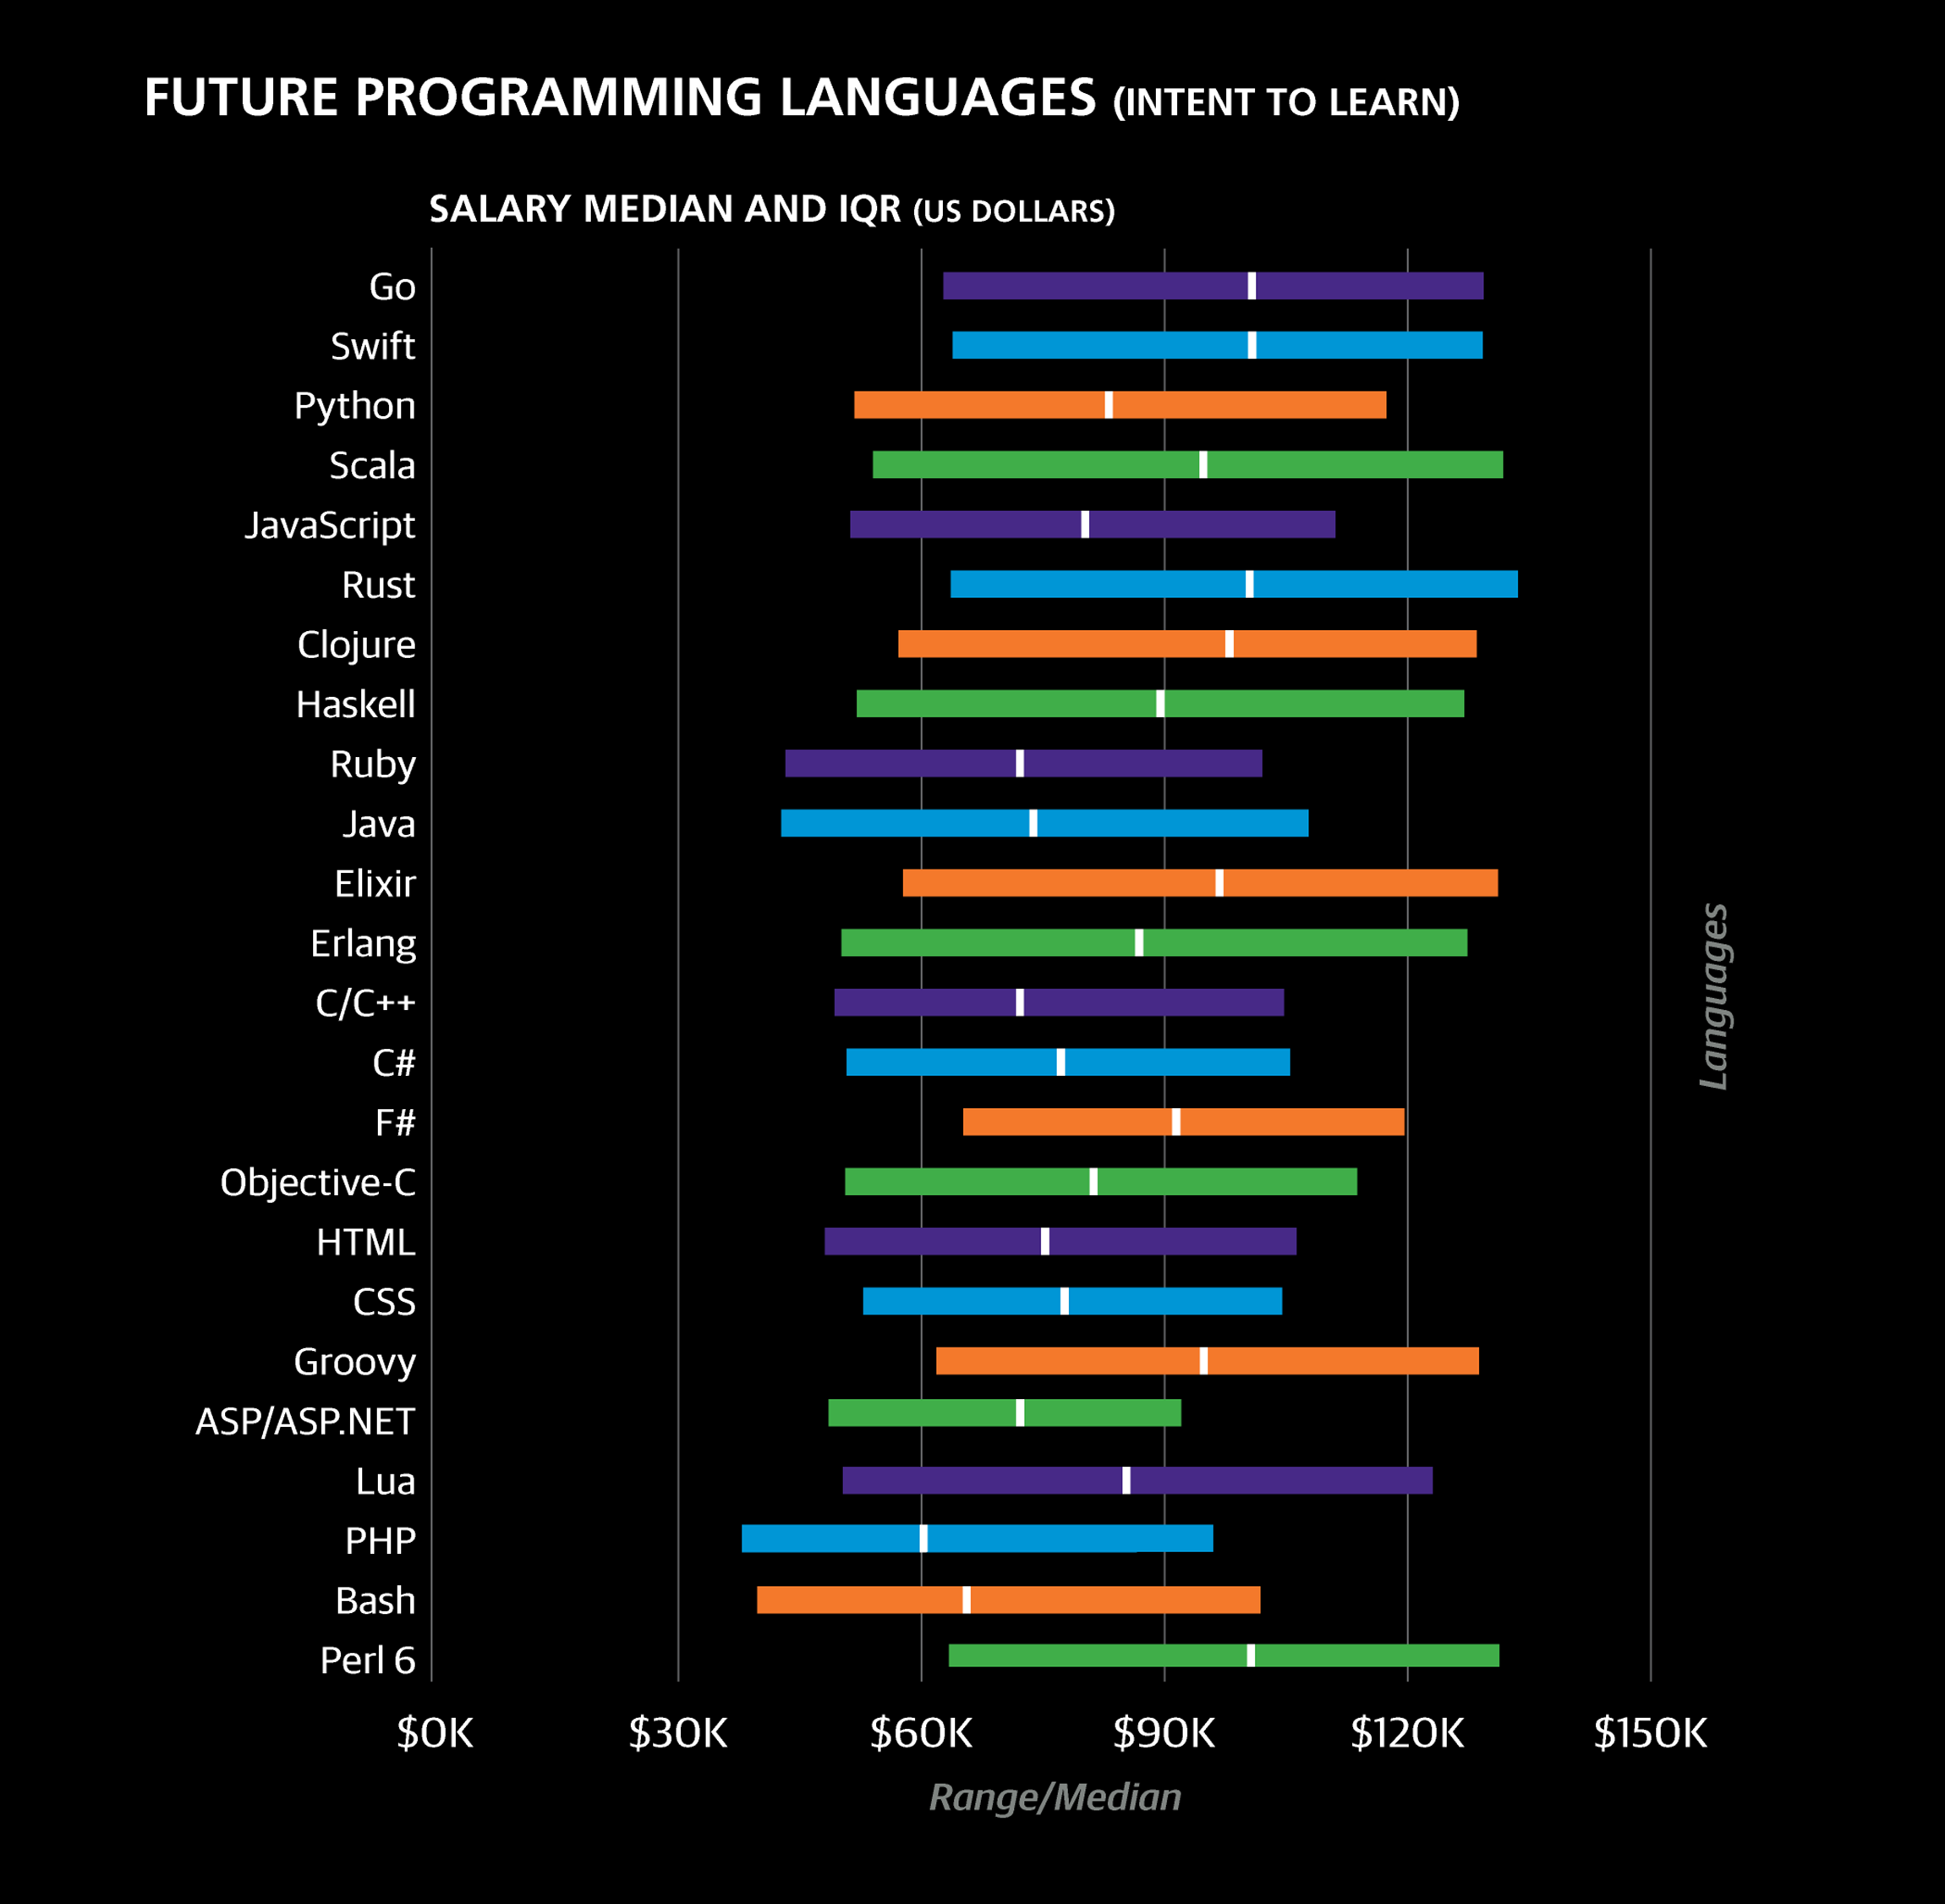
Two positive coefficients are associated with past languages: ASP/ASP.NET (+$2,403) and Scala (+$13,920). Interpretation is not straightforward; it can be spun negatively, since the respondents got a big boost in their expected salary when they stopped using them, but it could also be a understood in a positive light: these languages served as important career steps or learning paths. Respondents who used Scala in the past were more likely to be computer science majors (64% vs. 52% of the whole sample) and were more likely to work on collaborative code, read/edit code of others, plan software projects, work on projects that require real-time data analysis (27% vs. 17%), and do backend web development; it is possible that the past-Scala-use coefficient indicates knowledge of some of the above features (and perhaps hidden features, such as level), which in turn affect salary.
Most respondents (54%) selected one or two languages that they would like to learn. The top choices were Go (22% of respondents), Swift (20%), Python (18%), Scala (14%), JavaScript (14%), Rust (10%), and Clojure (9%). There is a clear distinction among languages on the top to-learn list defined by the proportion of the sample share that currently uses the language and the share that wants to learn them. In the case of Go, Swift, Scala, Rust, Clojure, Haskell, Elixir, Erlang, and F#, there are far more people who want or plan to learn them than currently use them. In contrast, Python, JavaScript, Ruby, and Java are used by more respondents currently than they were chosen as learning goals.
Notably, for the top 20 future languages, the proportion of current users to future learners was either less than 0.3 or more than 1.2. This is a quantitative realization of the distinction between emerging languages and current (but popular/growing) languages. Perhaps once the number of current users exceeds a certain amount (and thus the current:learner proportion surpasses .3), the rate that people learn the language is so high that the proportion quickly tips and there are more actual users than aspiring learners. However, this is only conjecture, and we will have to wait for future survey data to make any more solid conclusions.
As with past languages, the coefficients for future languages do not lend themselves to obvious explanation: Erlang (–$3,867), Ruby (–$5,363), and C# (–$7,721) all had negative coefficients.
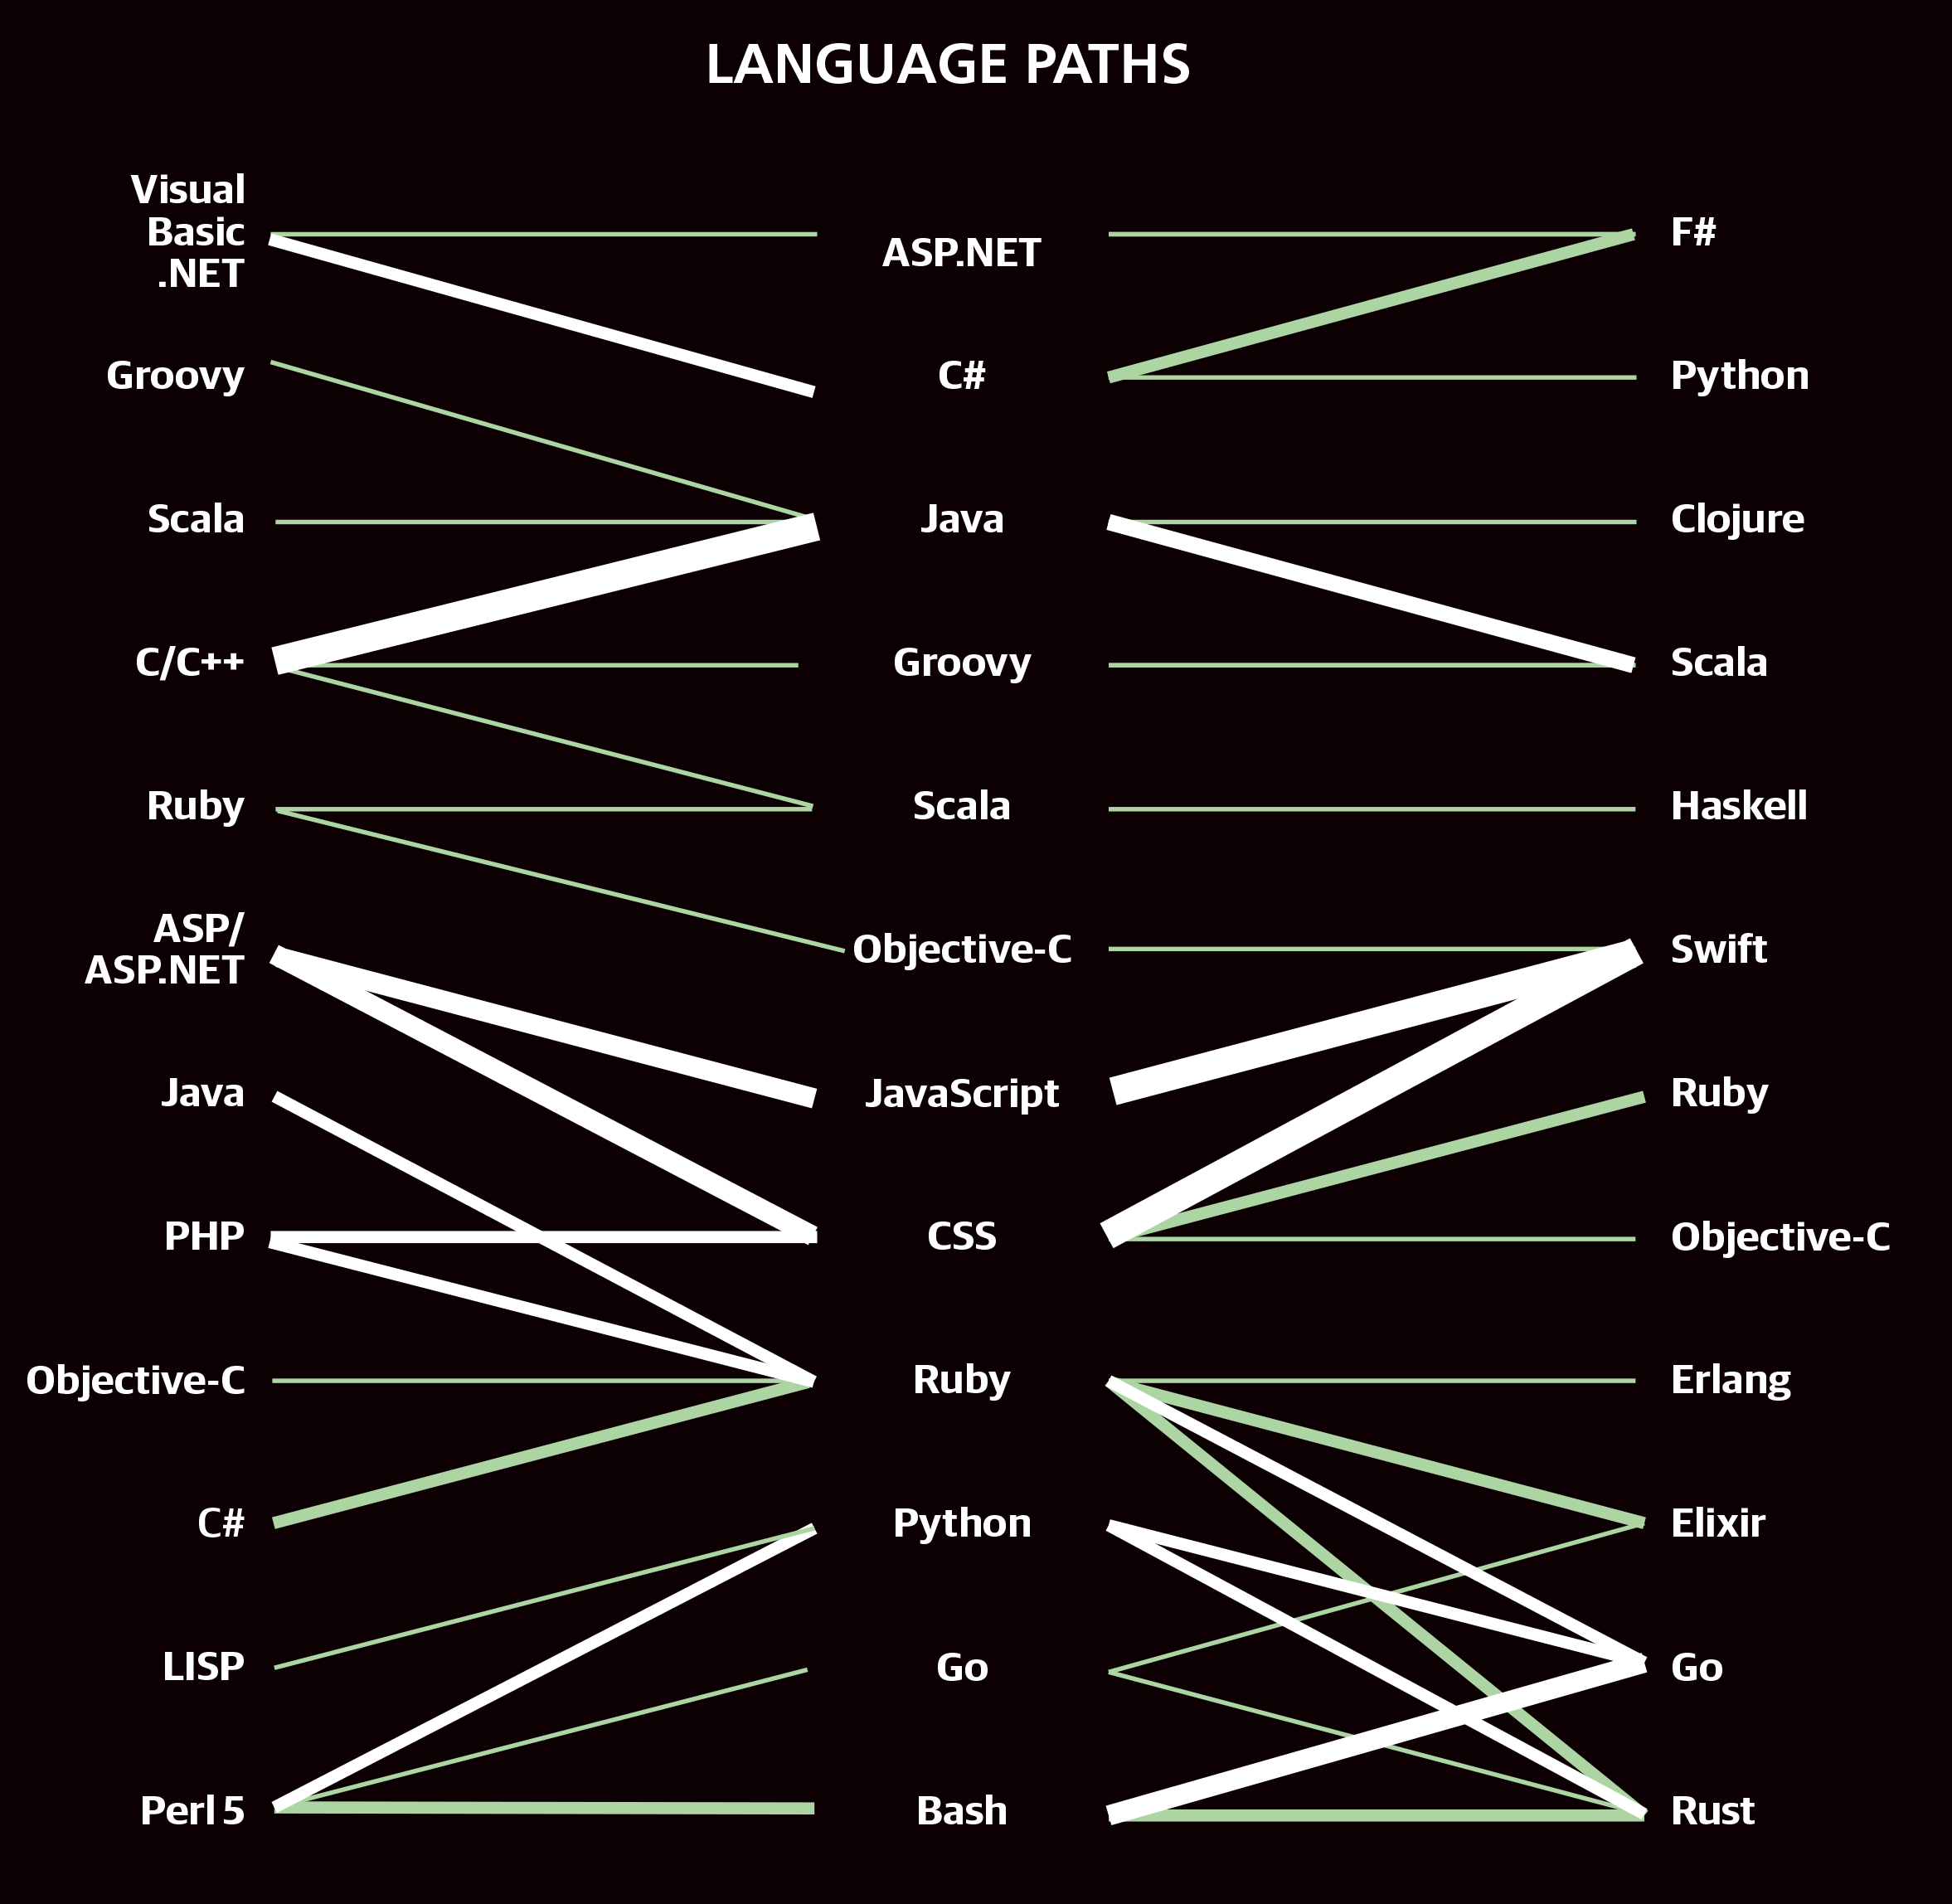
One final analysis we can make of the past-present-future languages is to associate them in language paths. For example, respondents who previously used C/C++ tend to use Java now, and those who use Java now tend to want to learn Scala. The most common paths are shown in the graph below. While these pathways were not included as additional features to the model, we can look at the median salaries of respondents who took a particular path. Among common paths (at least 30 respondents), ones taken by the most well paid respondents were Perl 5 > Java > Clojure (median salary $107K), LISP > HTML > Swift ($104K), Ruby > Java > Clojure ($102K), and Perl 5 > Ruby > Swift ($100K).
Work Week, Bargaining, and Ease of Finding Work
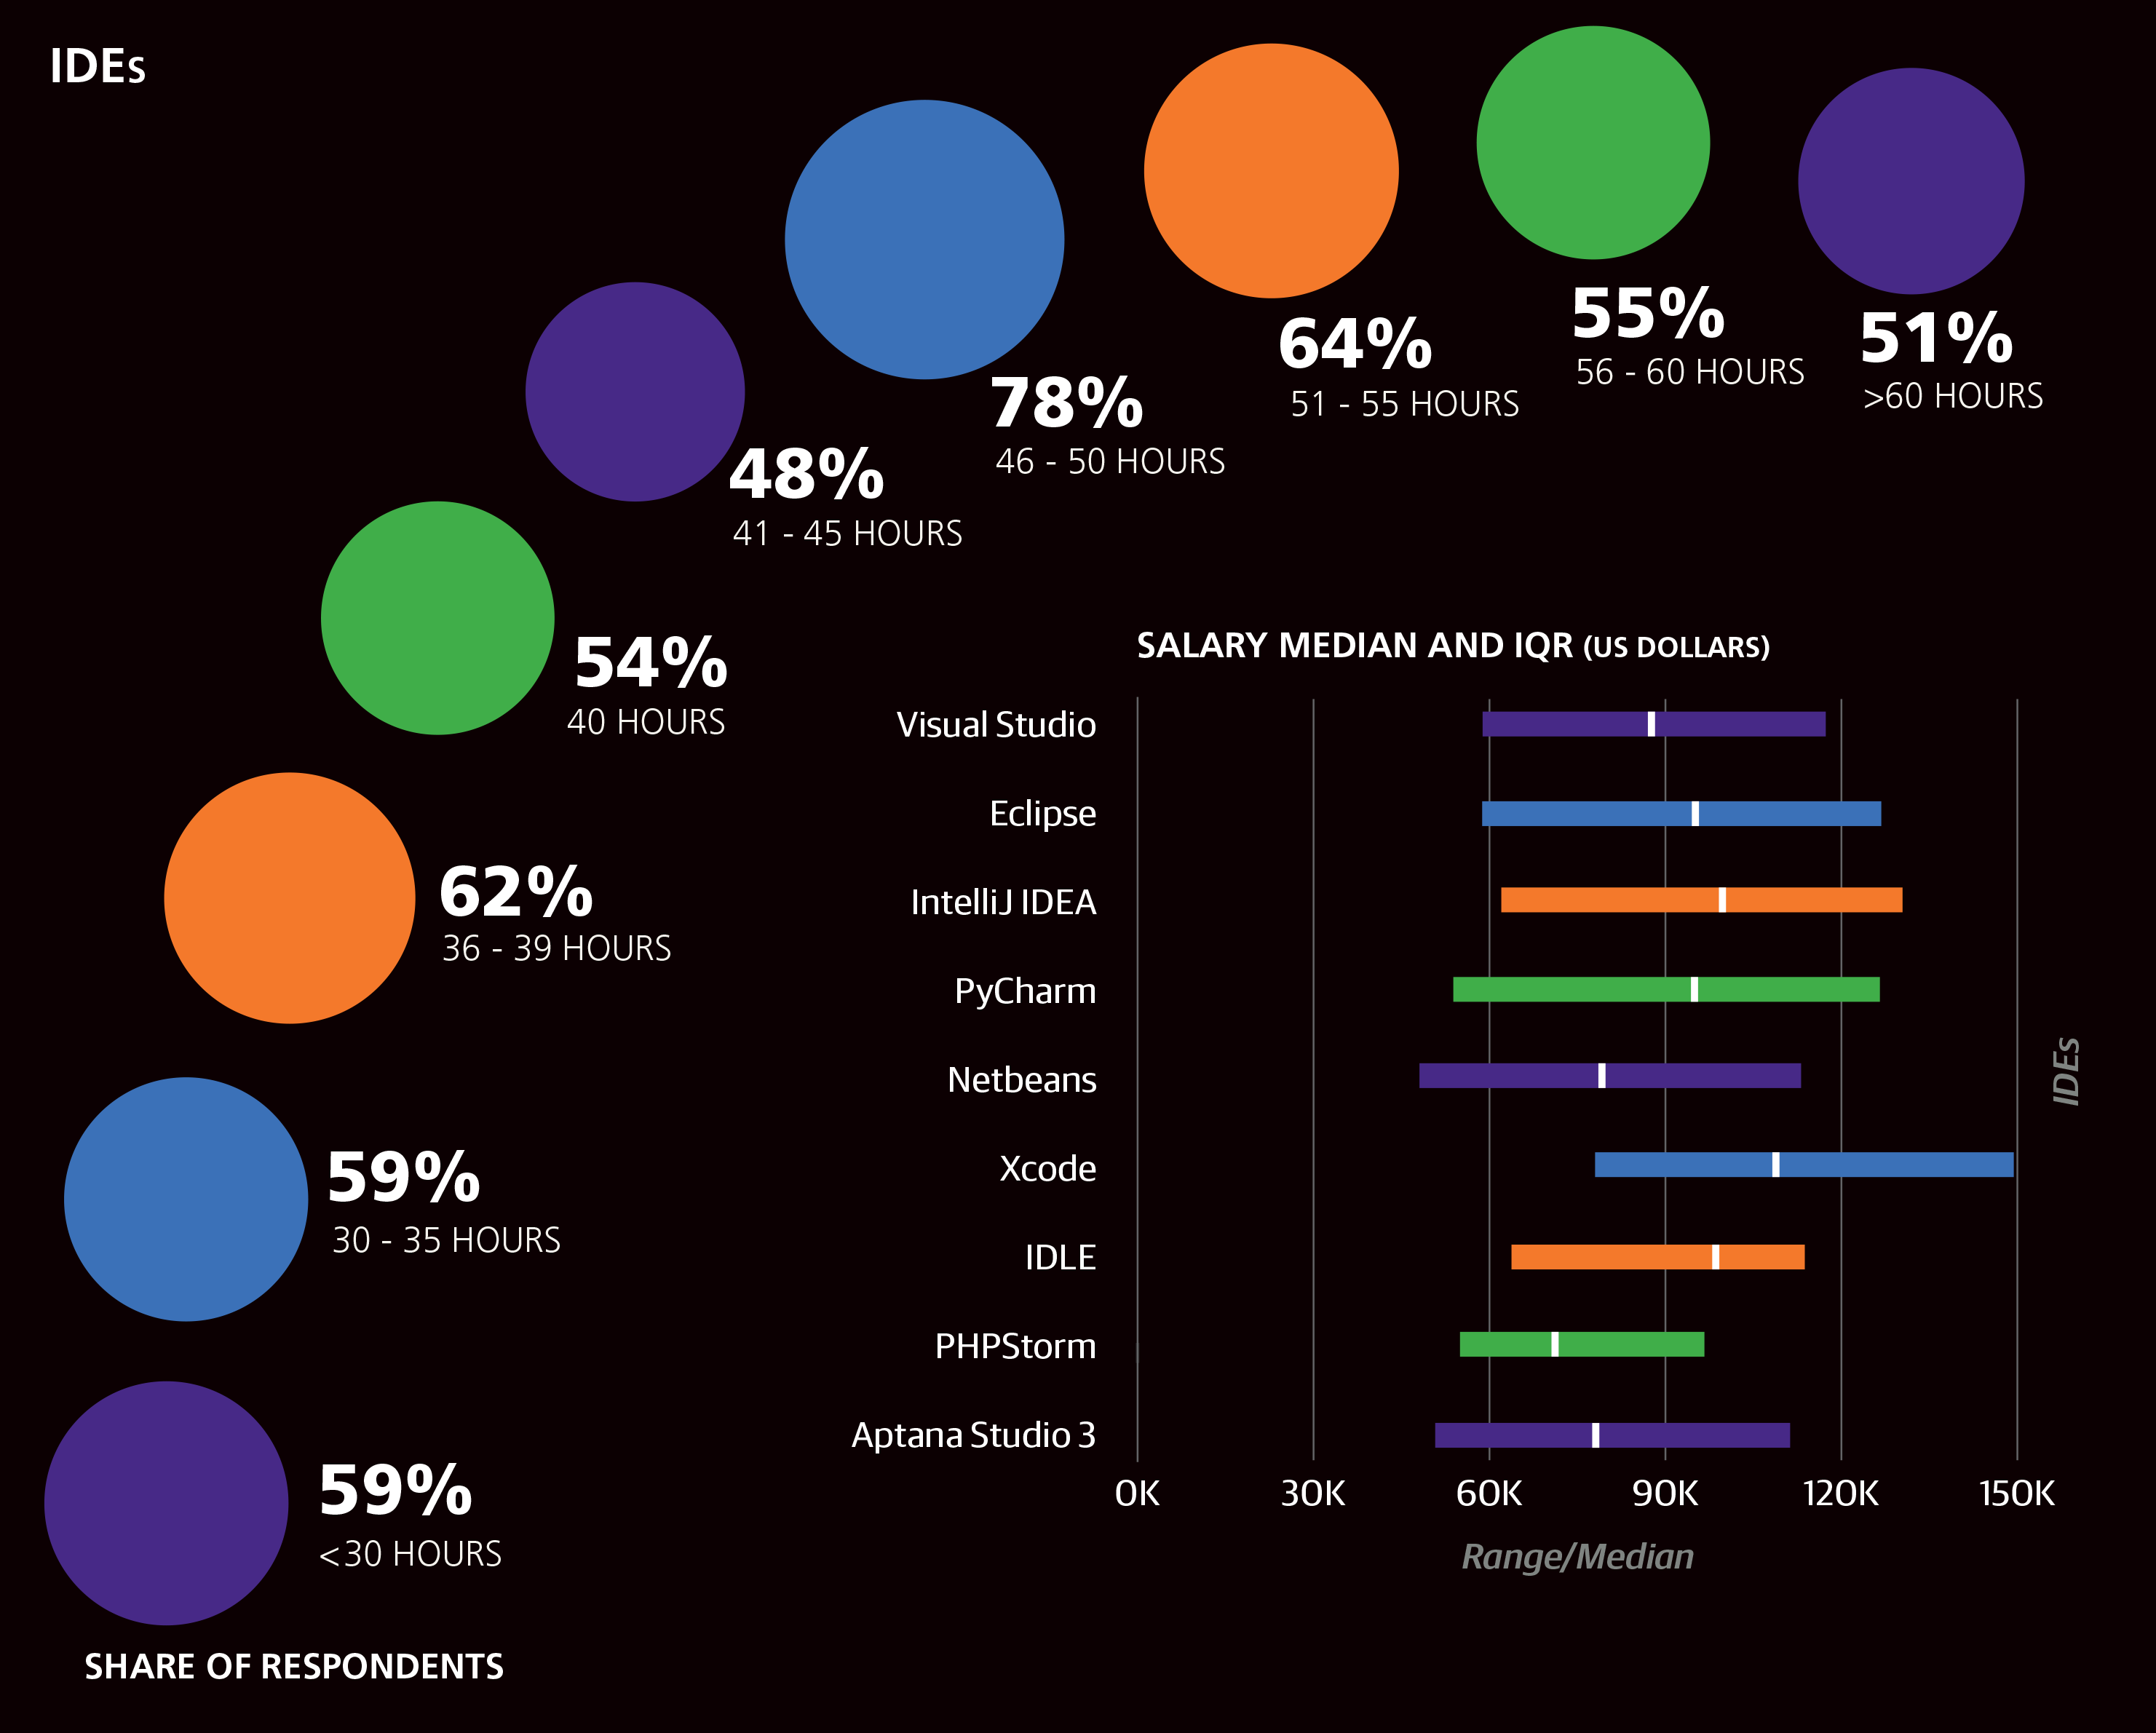
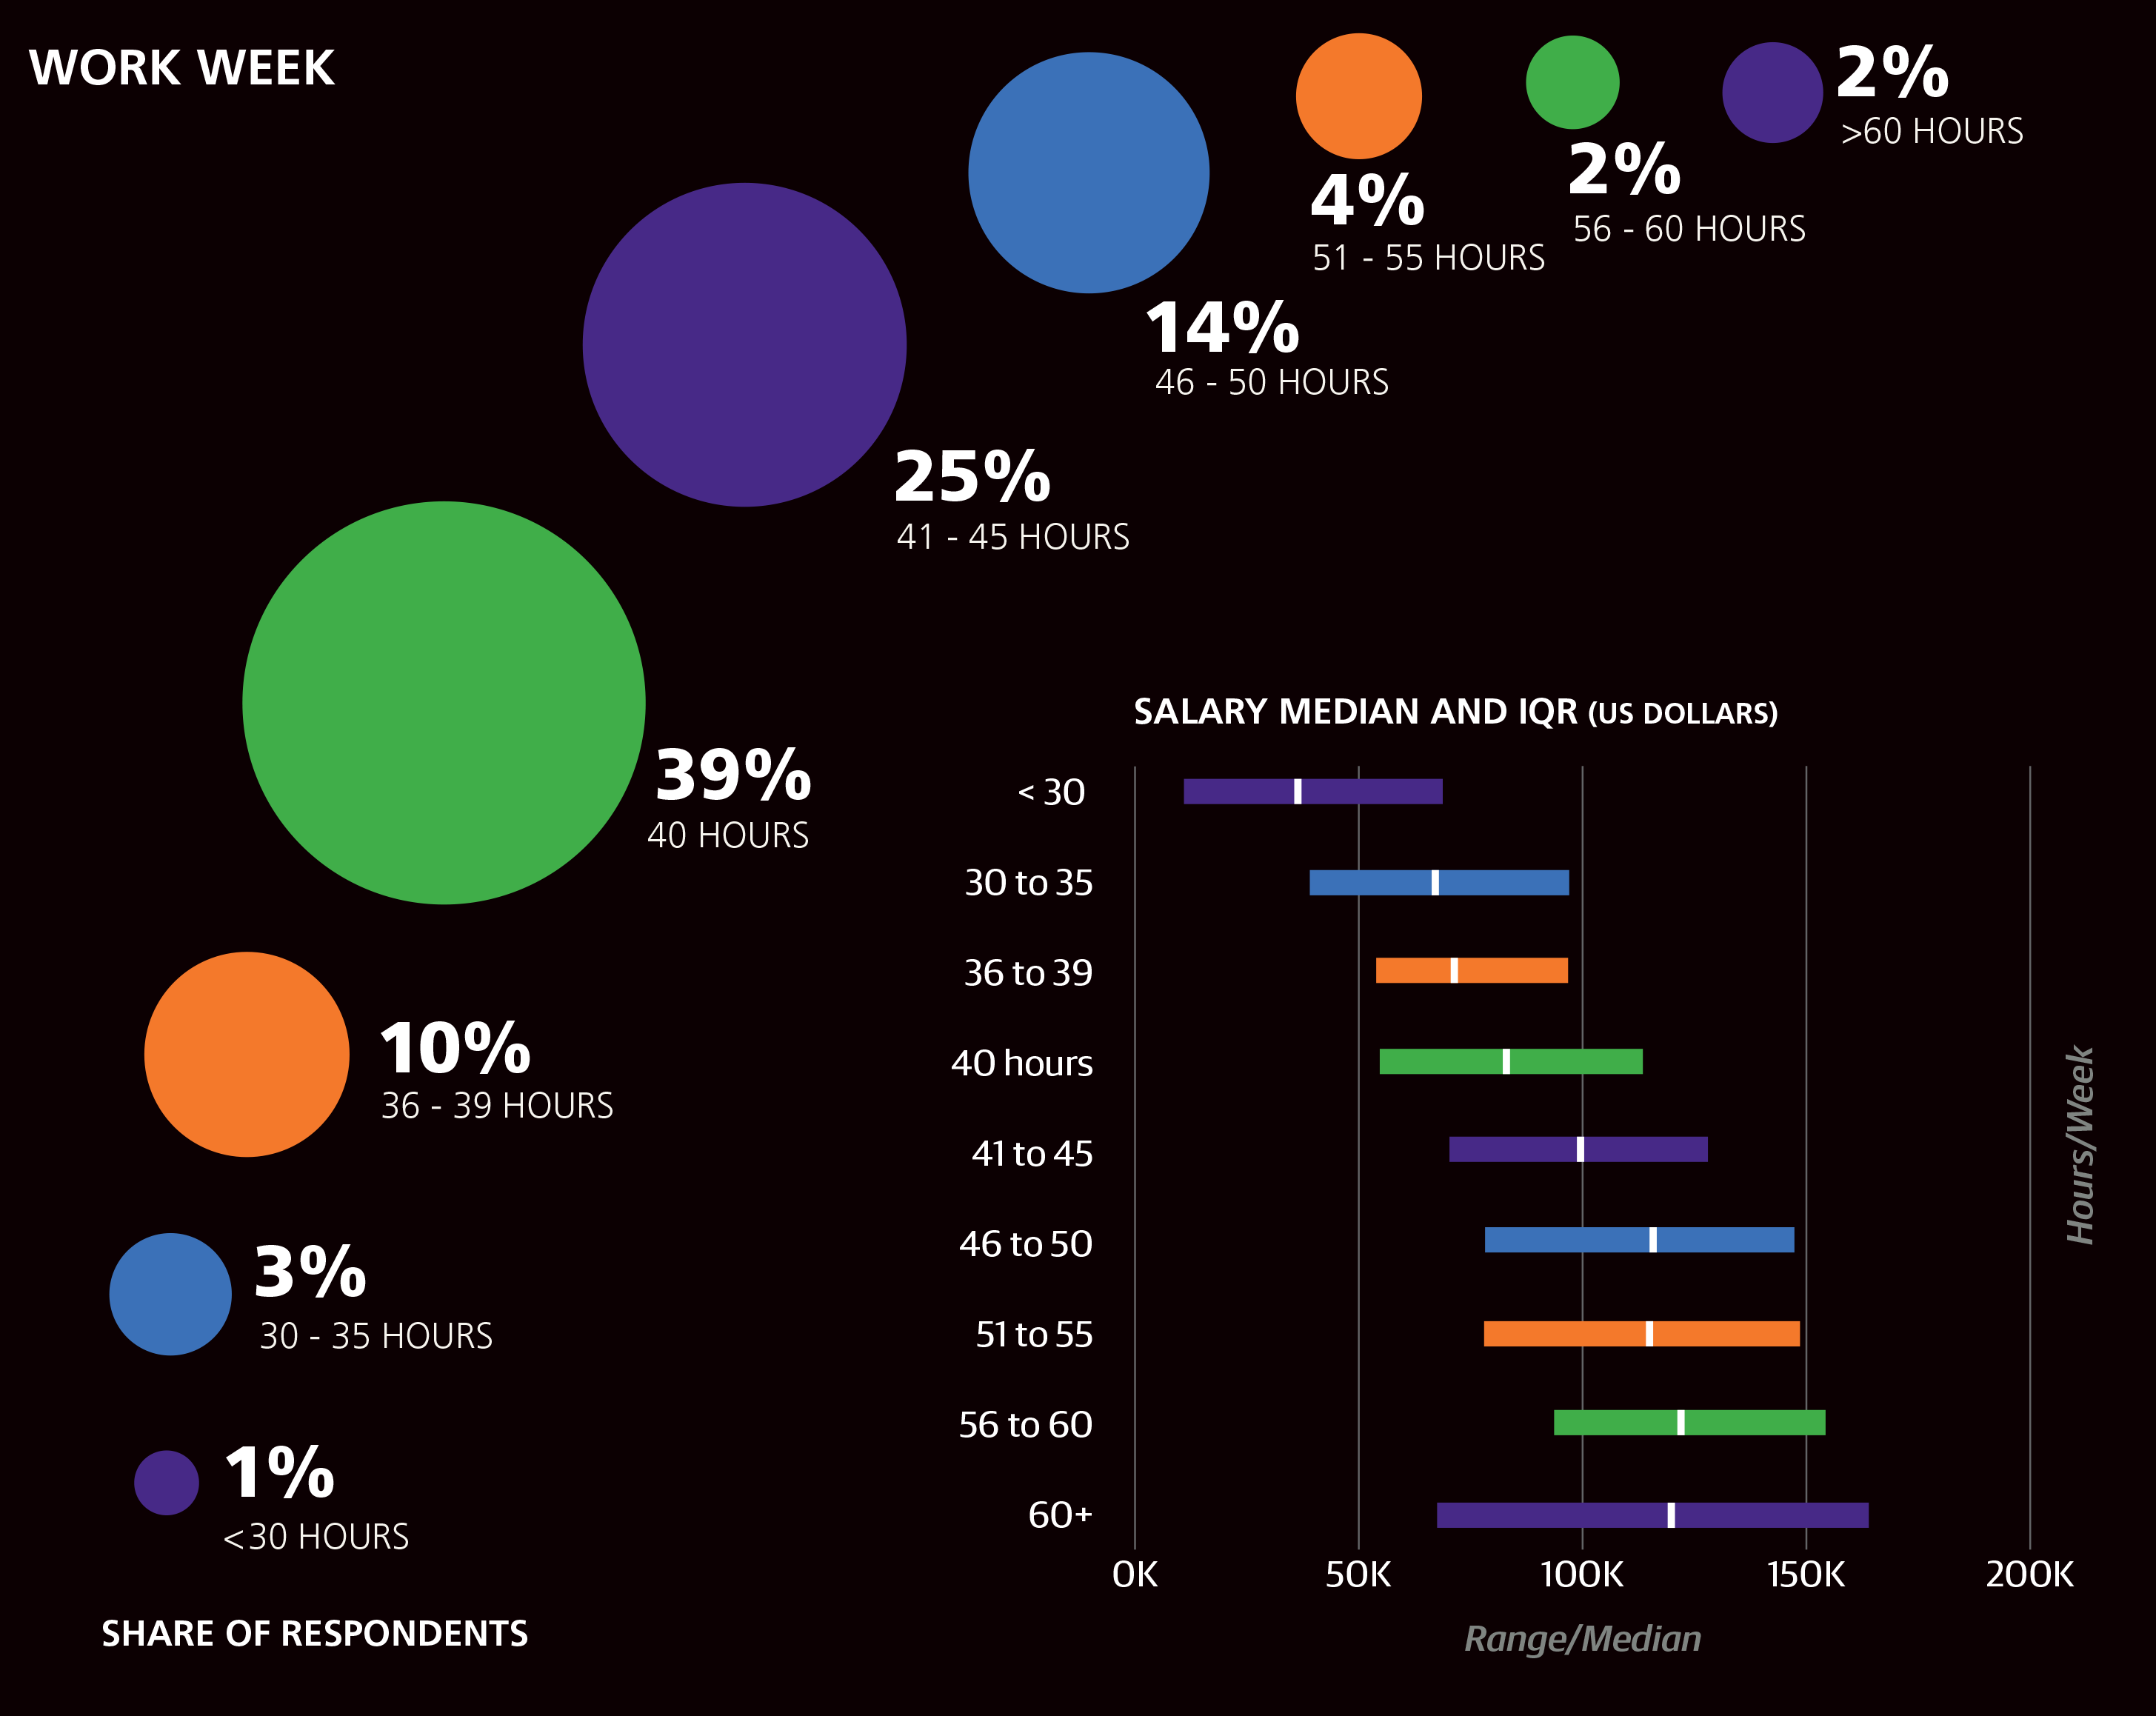
Most of the sample (63%) worked between 40 and 45 hours per week, with 4% working over 55 hours. Work week correlated well with salary and produced a coefficient of +$352 per hour. As mentioned before, those who reported a work week shorter than 30 hours were not included in the model.
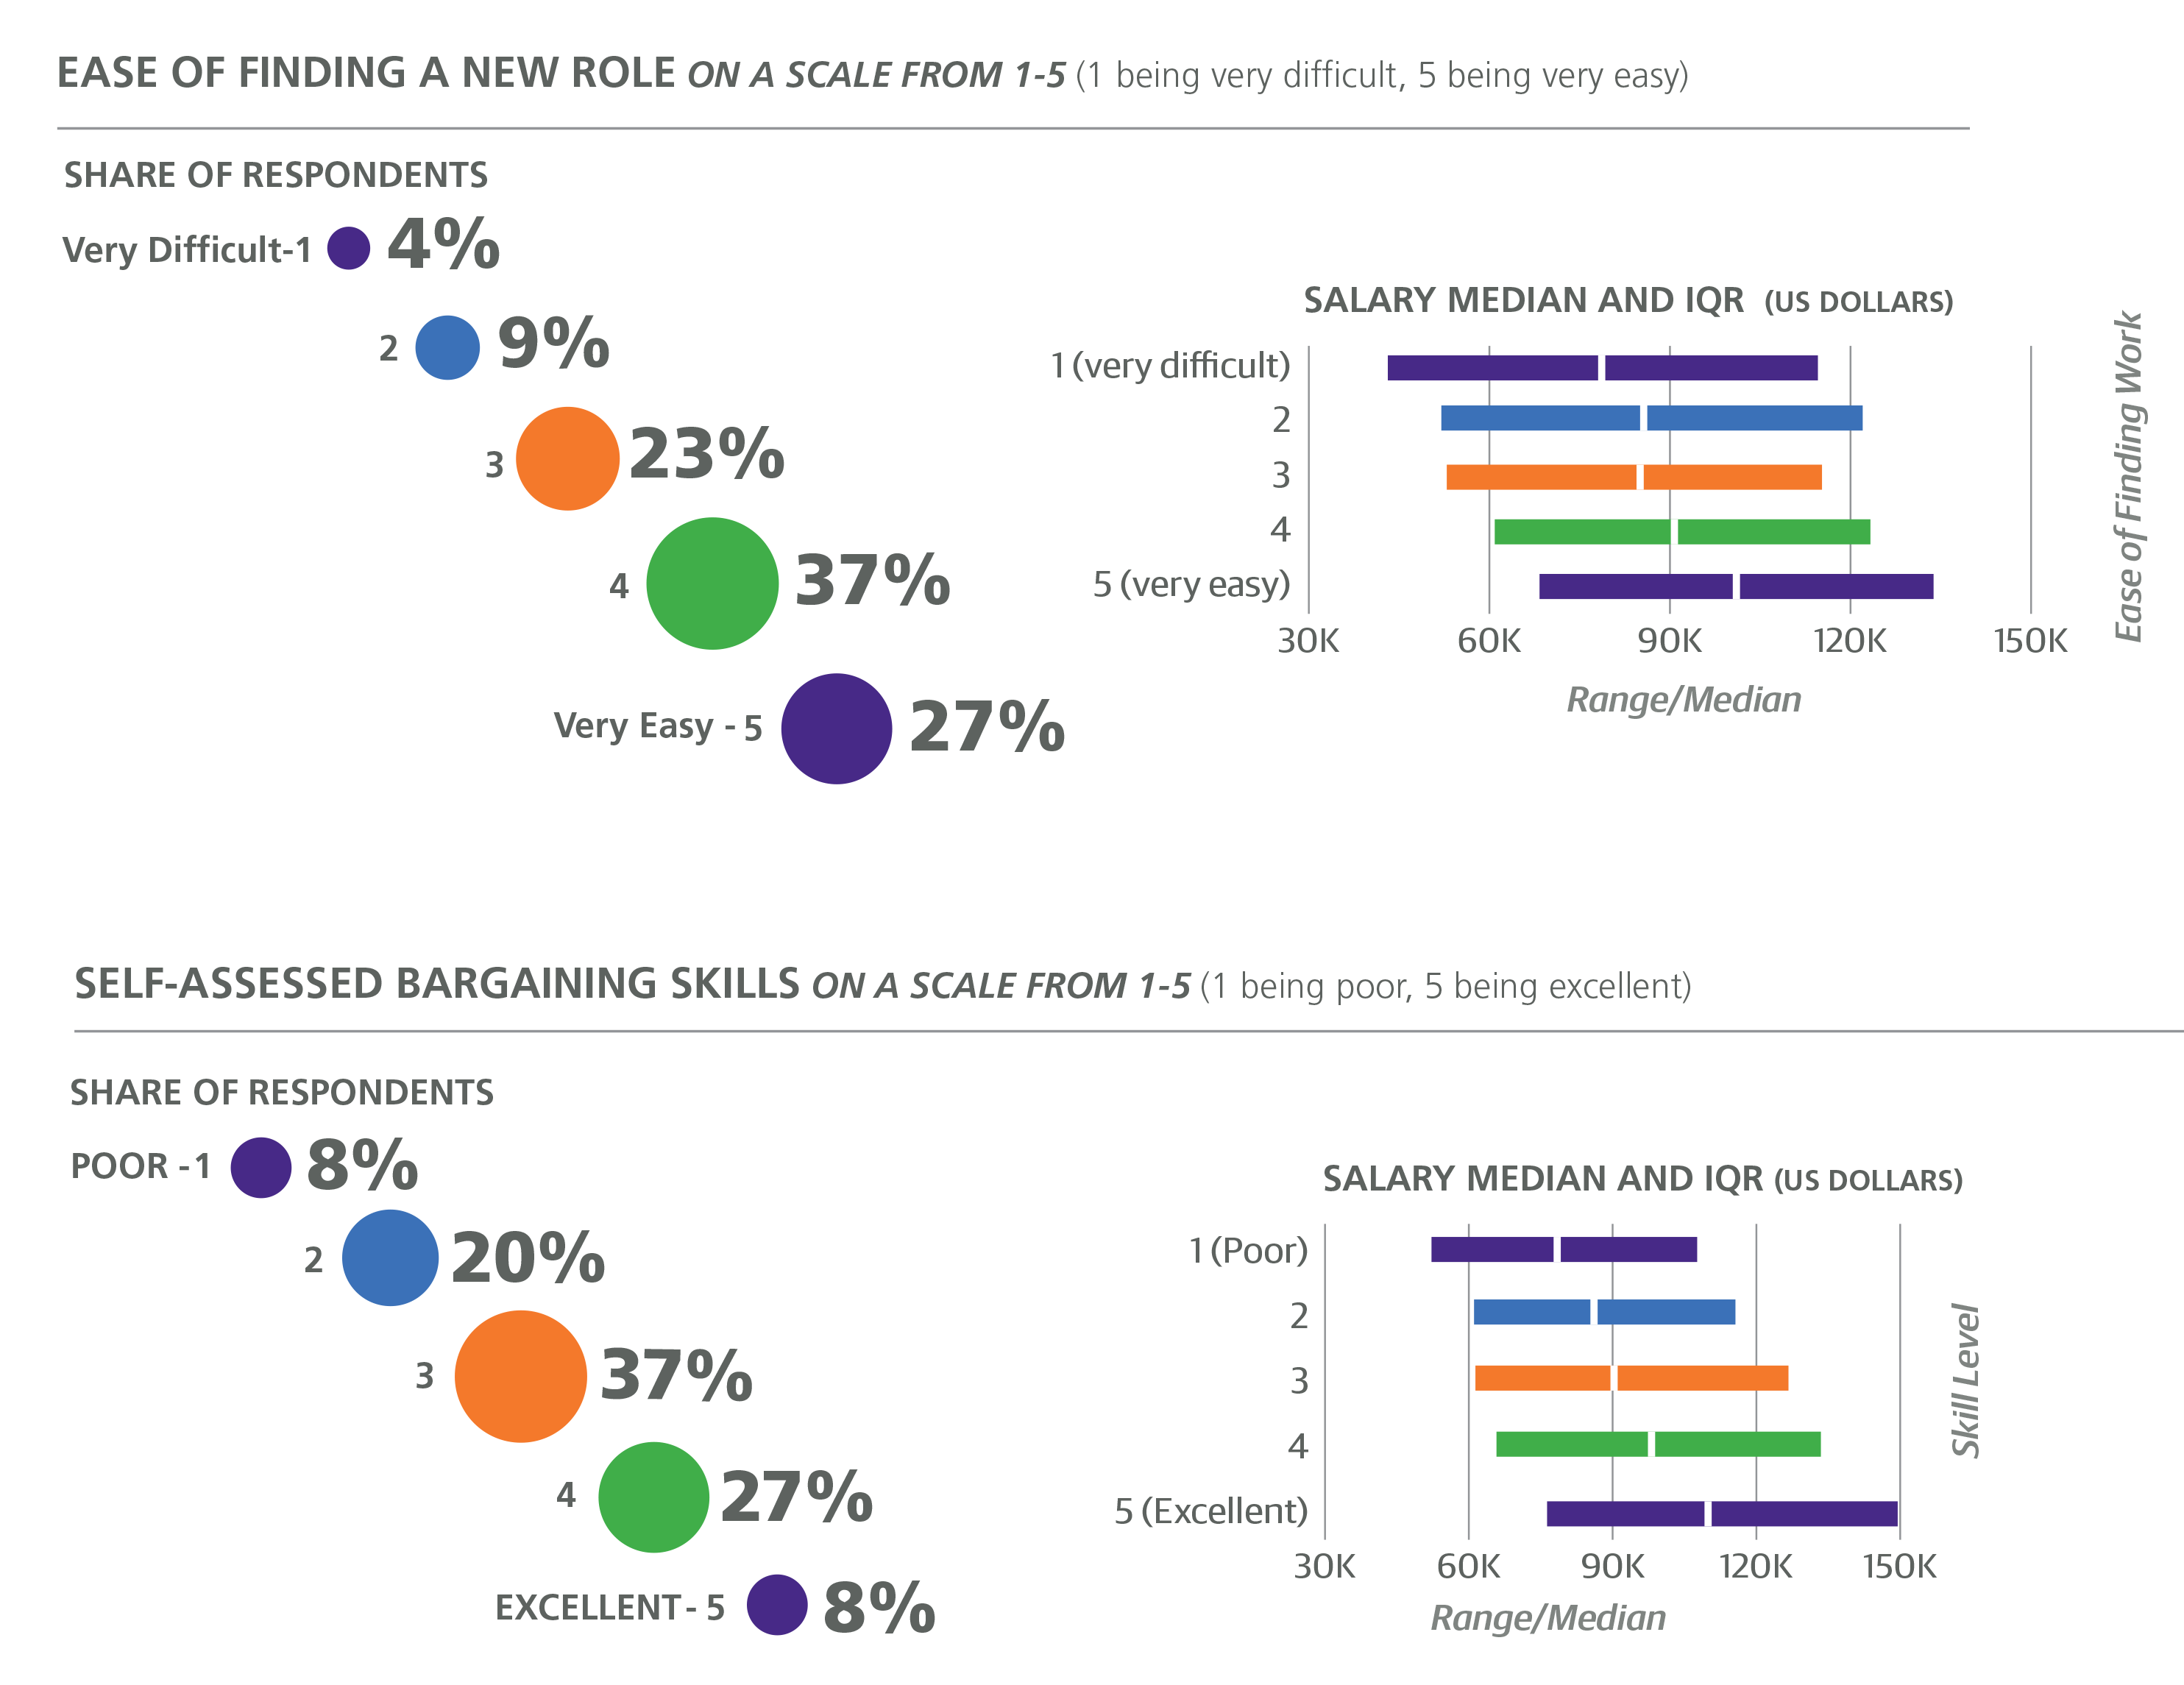
The other question was about bargaining skills: respondents were asked to rate how well they can bargain on a scale of 1 to 5. Most respondents gave themselves a 3 or 4. Although this is a highly subjective rating, we find it necessary to have some proxy for bargaining skills, since this can have a huge effect on your eventual compensation. Bargaining points correlated highly with salary, and the model predicts a salary boost of +$3,733 for each point on the scale.
Another question, similarly opinion based, was the ease of finding new work. In some cases this may be obvious (for example, if the respondent has job offers on the table, or had recently been looking for work unsuccessfully), but in most cases it is probably just as rough a measure as bargaining skills. The average score, also on a five-point scale, was 3.8. Since this is not a variable that we can change (that is, in the same way that we can move to new states or countries, learn new tools, or shift careers to new roles), this variable was not included in the model. However, the residuals of the model do correlate with the easeof- finding-work score, and correspond to about a $2K increase per point: the easier it is to find work, the higher your salary is expected to be.
The Model in Full
The model has an R2 of 0.584: this means the model explains approximately 58% of the variation in the sample salaries. The intercept has been combined with the geographical coefficients, of which you select one. Then you proceed through the coefficients, adding or subtracting the ones associated with a feature that applies to you. Once you sum up the coefficients, you will obtain an estimate for your annual total salary in US dollars.2
United Kingdom: +$25,782
Switzerland: +$53,983
France: +$2,017
Italy/Spain/Portugal/Greece/Turkey: –$5,163
Northern/Western Europe (except for countries above): +$17,443
Eastern Europe : –$14,804
Australia: +$29,636
New Zealand: +$17,443
India: –$22,064
Japan: +$36,076
Taiwan: –$14,285
Philippines: –$13,621
All other countries in Asia: +$17,443
Latin America: –$9,057
Africa (all respondents from Africa were from South Africa): –$3,766
Canada: +$17,443
US, Midwest: +$48,060
US, Pacific NW: +$57,838
US, Northeast: +$60,453
US, California: +$76,671
All other US states: +$52,778

Industry = Banking/Finance: +$11,367
Industry = Search/Social Networking: +$10,891
Industry = Education: –$11,812
Industry = Consulting (IT): +$4,528

Company size = 1: +$12,822
Company size = 10,000 or more: +$6,801
Company age = more than 20 years: –$6,279

Team size, per team member: +$445
Works with data scientists/analysts: +$2,364
Does not work with (other) programmers, project managers, designers, salespeople, or data scientists: –$6,995

Gender = Female: –$5,256
Experience, per year: +$1,194
Master’s degree: +$3,101
PhD (in addition to a Master’s): +$9,041

Title = Principal/Lead: +$11,936
Title = Consultant: +$11,867
Title = Senior Engineer/Developer: +$9,147
Title = Architect: +$15,488
Major involvement in planning large software projects: +$5,867
Minor involvement in frontend web development: –$4,194
Major involvement in frontend web development: –$6,305
Major involvement in writing documentation: –$3,036
Minor or major involvement in managing engineers: +$3,706
Hours spent in meetings, per hour/week: +$237

Cluster 3 (Vim, Bash, Python): –$61 per tool, up to 8 tools
Cluster 4 (Notepad++, Excel): –$1,227 per tool, up to 12 tools
Cluster 5 (AWS, Jenkins): +$1,549 per tool, up to 10 tools
Cluster 6 (MySQL, PHP): –$4,147 per tool, up to 5 tools
Cluster 8 (Apache Hadoop, Solr): +$427 per tool, up to 5 tools
Cluster 9 (Perl 5, Komodo Edit): +$501 per tool, up to 3 tools
Cluster 10 (TextWrangler, Objective-C): +$602 per tool, up to 4 tools
Cluster 11 (Scala, sbt): +$2,585 per tool, up to 3 tools
Cluster 12 (Emacs, Leiningen): +$2,359 per tool, up to 4 tools
Cluster 13 (Groovy, Grails): +$2,130 per tool, up to 2 tools
Cluster 14 (Erlang, Haskell): +$2,906 per tool, up to 2 tools

Past language, ASP/ASP.NET: +$2,403
Past language, Scala: +$13,920
Future language, Erlang: –$3,867
Future language, Ruby: –$5,364
Future language, C#: –$7,721

Bargaining skills, per point (scale of 1 to 5): +$4,552
Work week, per hour: +$352
Conclusion
In any industry, it is wise to keep in touch with relevant technological changes that could affect your career; in a field such as software development, where the tools change so rapidly, this becomes an increasingly challenging task. This report is intended to give a quantitative look at the various careers and profiles of software professionals, and shed some light on what your next step might be, whether it is to learn a new language or shift roles.
Surveys certainly have their drawbacks, especially when the sample is self-selected. In our conclusions here, we rely on the assumption that the people who took the survey are reasonably representative of the entire software development world, or at least some important subset of it. The O’Reilly programming audience—from which the respondents generally come—has a proclivity toward choosing open source and emerging technology, and this will affect the results: the percentages of respondents who used certain tools, for example, are probably not good estimates of the global development rates.
The correlation-causation distinction should certainly be kept in mind when reading this report, but it is worth noting that, while it does not imply causation, correlation does not deny it, either. If you were planning on learning a language anyway, it’s not a bad idea to choose one that correlates positively with salary, if it suits your professional needs. Generally speaking, a broader skillset is respected in the software world, and learning more tools always opens new doors. Taking into account the information in this report might increase the chances of opening a door with a bigger paycheck somewhere on the other side.
1Team size (number of members) and company size (number of employees at the company) correlates with a linear correlation coefficient of .25.
2Here “Eastern Europe” includes the Balkans, Baltics, and some countries more accurately described as “Central Europe”: Poland, Czech Republic, Hungary, Slovenia, and everything to the East and South (but not including Greece or Turkey).