2017 Ops Salary Survey
Get a clear picture of what operations professionals do, what they're paid, how they’re seen within their companies, and how they rate different aspects of their jobs.
 Geometric designs
Executive Summary
The operations (Ops) required to keep an organization’s increasingly important technical infrastructure up and running is a key part of any company. The roles and duties performed by those working in the Ops space vary widely by company, industry, geography, and infrastructure type. This report looks into what operations professionals do, how much they are compensated, how they are seen within their companies, and how they rate different aspects of their jobs.
Some key points include the following:

Learn faster. Dig deeper. See farther.
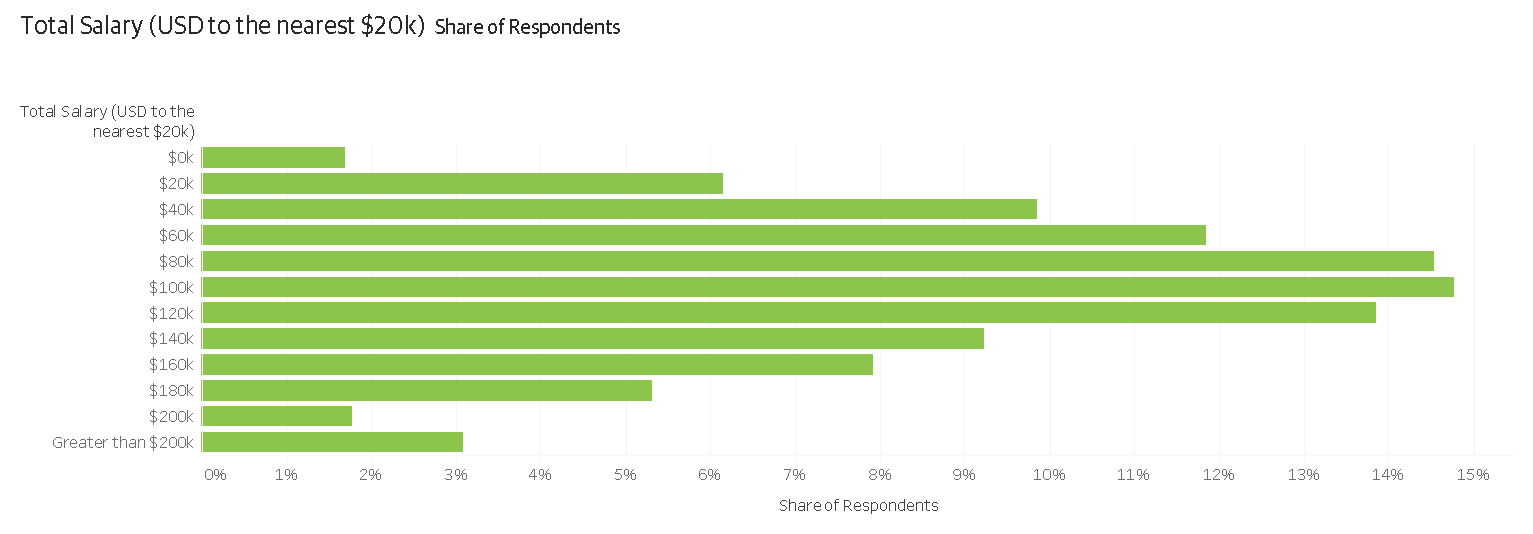
- The median salary of all respondents is $100,000.
- Ops professionals at larger companies earn more money.
- Despite working long hours, more than half of respondents said they were happy with their work–life balance.
- 21 percent of Ops professionals know the programming language Go.
- Most (>60 percent) of companies deploy to production on a daily or weekly basis.
- 58 percent of companies still use standard datacenters.
We invite you to use this report to find insights about your own career or organization, and hope that you will take the time to fill out the survey for next year’s report.
Introduction
In this, O’Reilly Media’s first Ops Salary Survey, we collected data that give us a well-rounded picture of what it’s like to work in the space between software development and IT known as Ops. More than 650 respondents from 56 different countries and 40 US states within the United States took part in the survey, answering a broad set of questions about their backgrounds and profession.
Based on the responses, we found that Ops encompasses a wide range of tasks and we saw evidence of shifting roles for Ops professionals. Infrastructure is moving to the cloud, and physical work (like laying cables and racking servers) is on the wane, giving way to tasks that require new types of skills; for example, automation, configuration, virtualization, and containerization. Our survey results provide helpful insights into the skills, tools, experience, and responsibilities that most affect Ops salaries.
Based on the information our respondents reported, the median salary of Ops professionals is $100,000, higher than what we see in our surveys that cover other disciplines, including the $80,000 median reported in the most recent Software Development Salary Survey. Although knowing the median salary of an Ops professional is an excellent baseline for any hiring discussion, it is worth looking in detail at the various factors that affect salary.
Salary
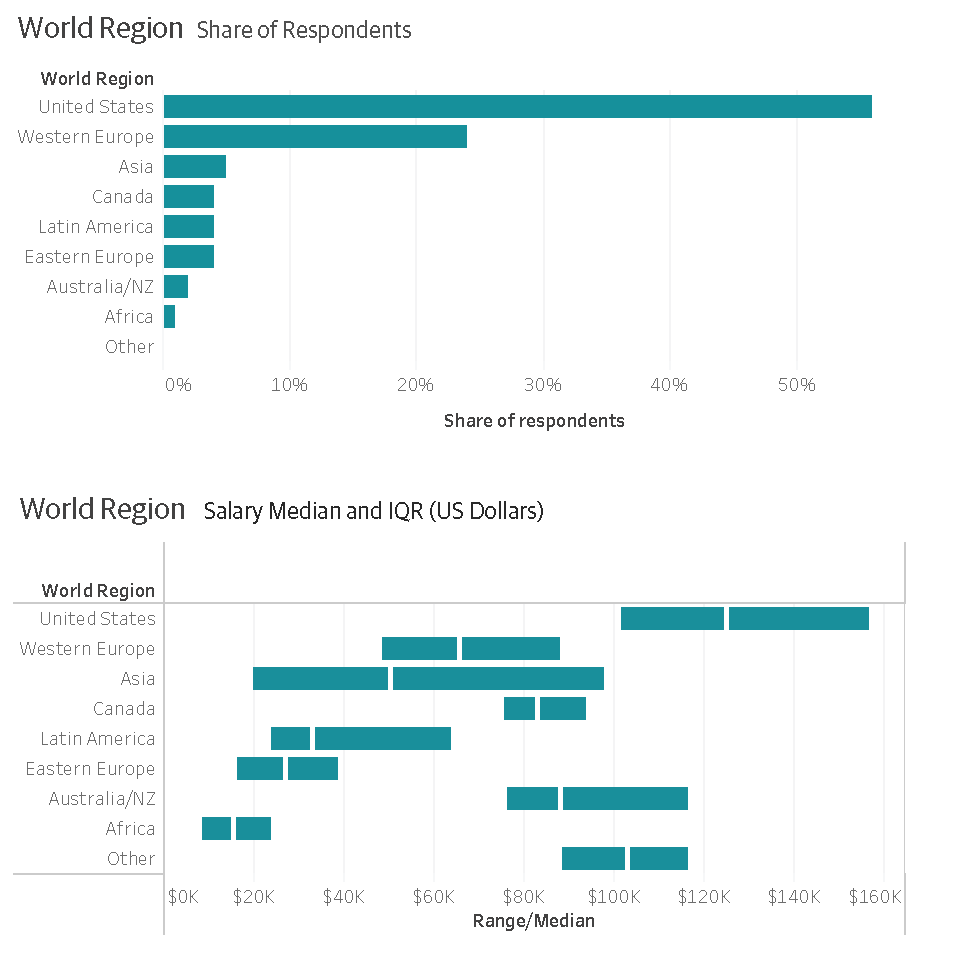
More than half of the survey respondents are from the United States. The second largest group (24 percent) are from Western Europe. Aside from that, no region represented more than 5 percent of our sample group. This means that these results are weighted nearly three to one in favor of US and Western European responses and trends. This is important to keep in mind if you work outside of these regions.
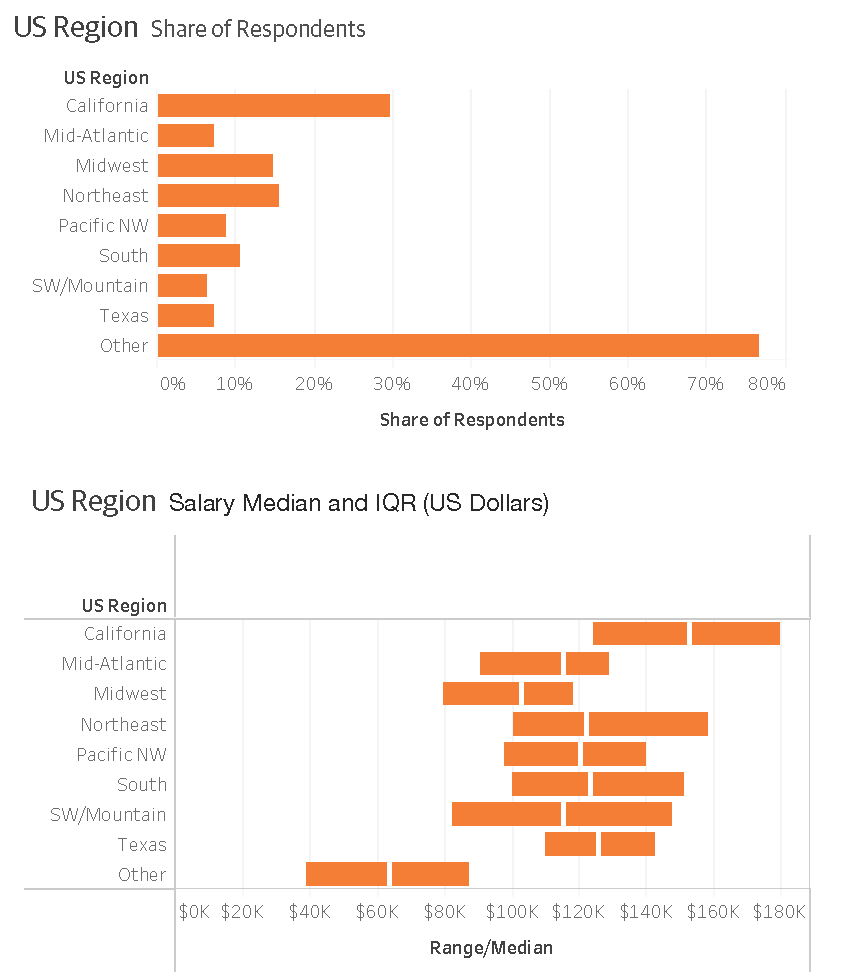
Looking at US-based respondents, about 30 percent work in California, 16 percent in the Northeast, and 15 percent in the Midwest. The salaries for these three regions vary widely and seem to reflect costs-of-living differences: California has the highest median salary at $152,000 (and the highest cost of living), followed by the Northeast at $122,000, with the Midwest at $102,000.
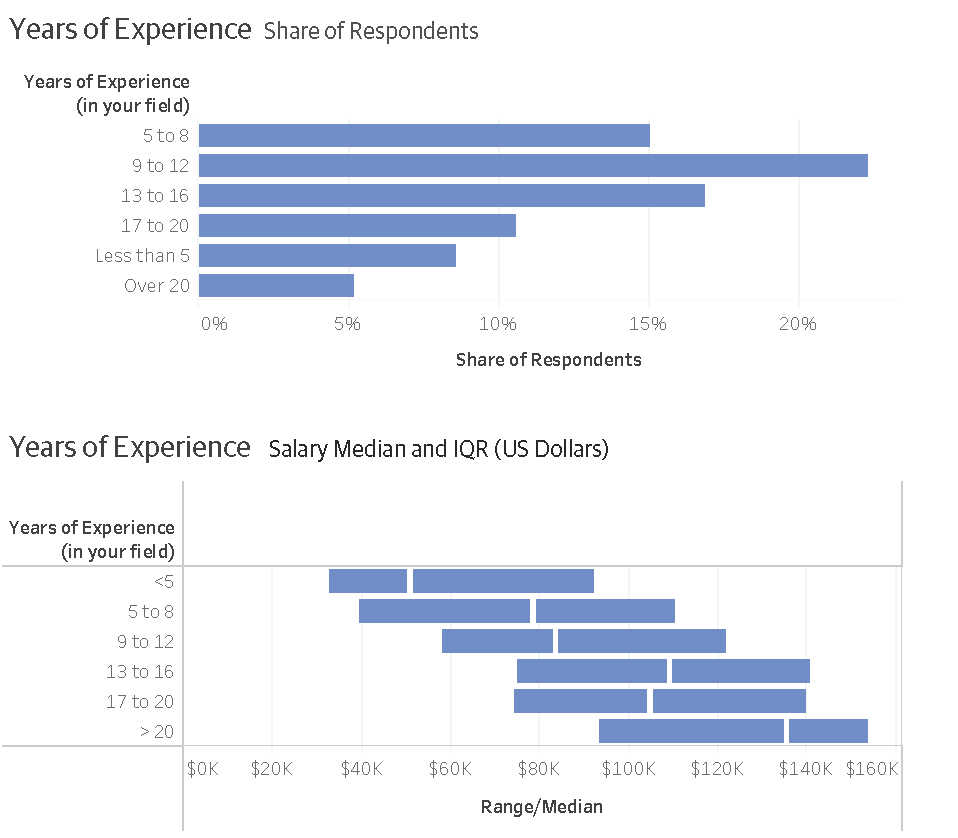
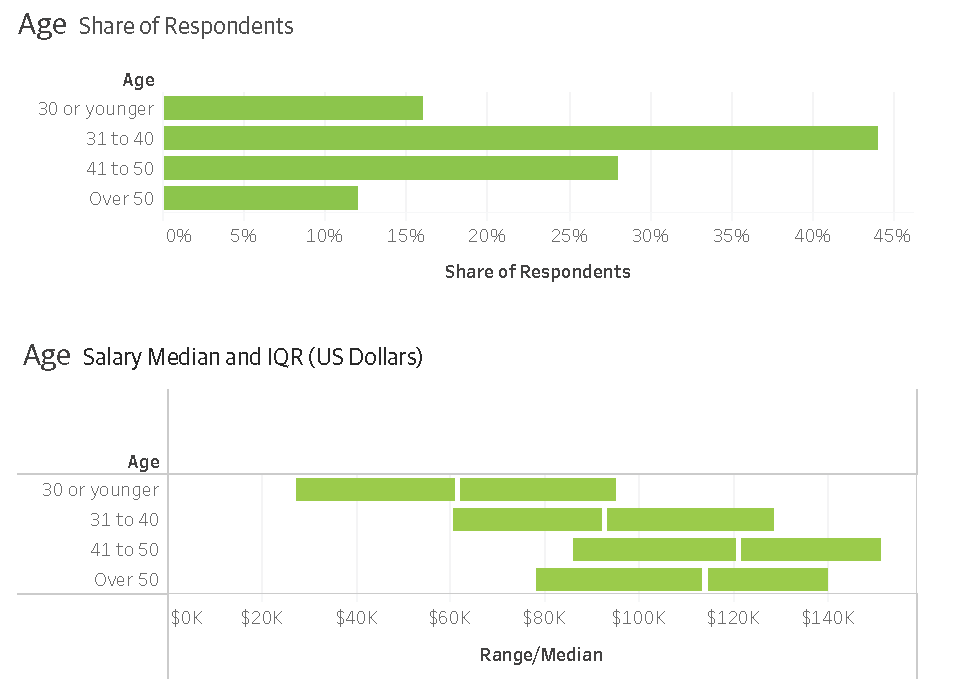
Not surprisingly, salaries tend to increase with both age and experience. Those with less than five years’ experience make around $51,000, whereas those with more than 20 years’ experience earn a median income of $135,000. Clearly, within our survey cohort, time spent learning the tricks of the trade for automating daily scripts provides the types of skills and experience to take on the complex, difficult, and demanding roles that lead to higher compensation.
As for age, the older you are, the more experience you have probably accrued, which feeds back into the experience factor and an increased salary. Sixty percent of our respondents are under the age of 40 and nearly 90 percent are under the age of 50. The biggest cohort (44 percent) is between the ages of 31 and 40. There were few respondents under age 30—only 16 percent.
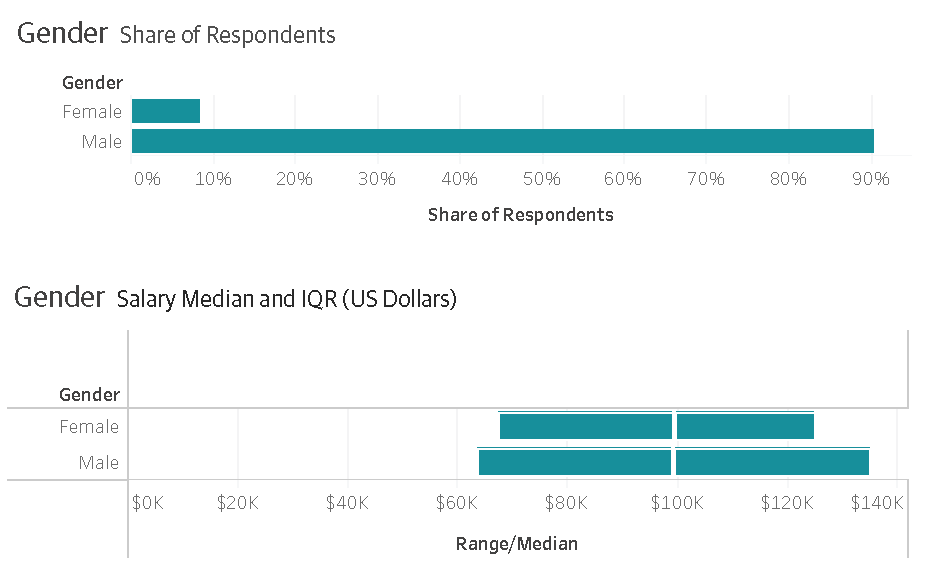
The gender split was around 8 percent female and 92 percent male. This is similar to what we saw in the Software Development Salary Survey and elsewhere in the computer industry. The median salaries between men and women were nearly the same: men make $99,000, and women $99,400.
Company Size
Less than two percent of Ops companies are one-person operations. Ignoring these, the remaining organizations were split nearly 50/50 between companies smaller and larger than 1,000 employees.
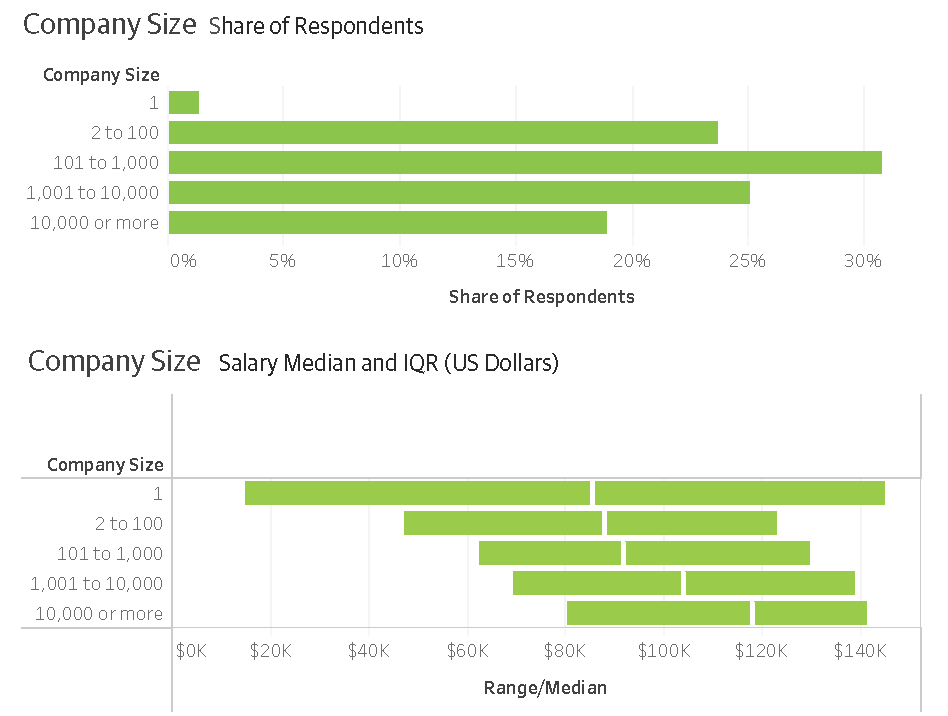
As we see in other surveys, the larger the company, the better the pay. Companies in the range of 2 to 100 employees have a median salary of $88,000, whereas respondents from companies with more than 10,000 employees have a median salary of $118,000—a $30,000 difference!
Company Age
Unlike in other technology industries O’Reilly has surveyed, Ops salaries do not increase over time as companies age. In fact, companies that are only two to five years old are paying the most for Ops talent, around $108,000. This might imply that startup companies place a high value on Ops and are willing to pay higher salaries to attract the best people for the most challenging roles. It could also be that young companies have a lot of groundwork that needs to be set up, but once the systems and infrastructure are running and as the company ages, roles and needs shift.
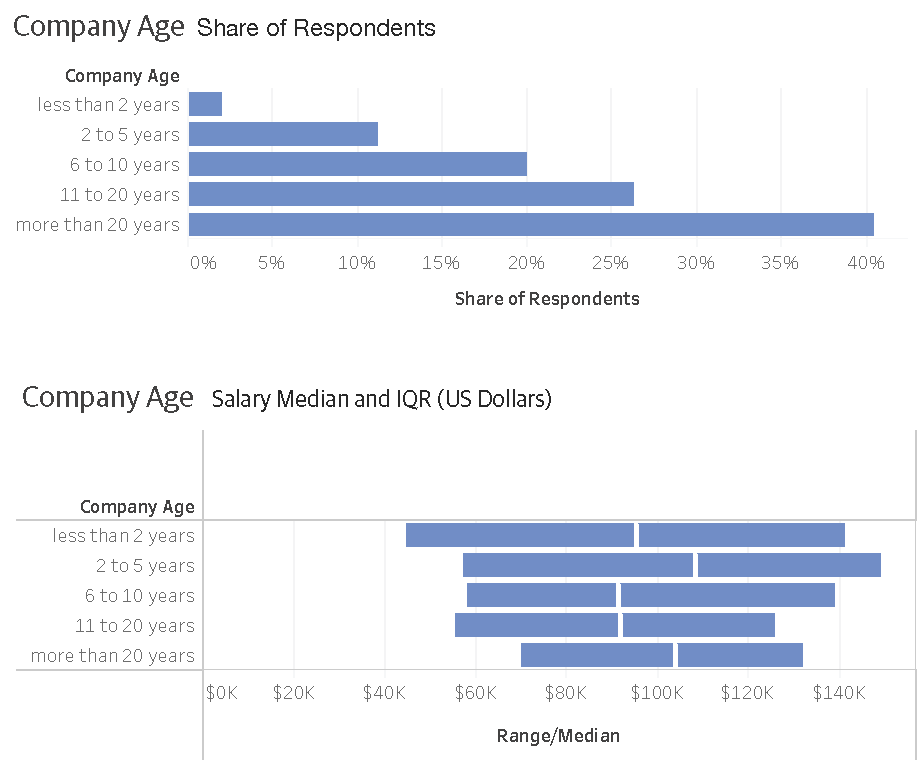
Companies between 6 and 20 years of age pay around $91,000, and those that have been around for longer than 20 years pay around $104,000.
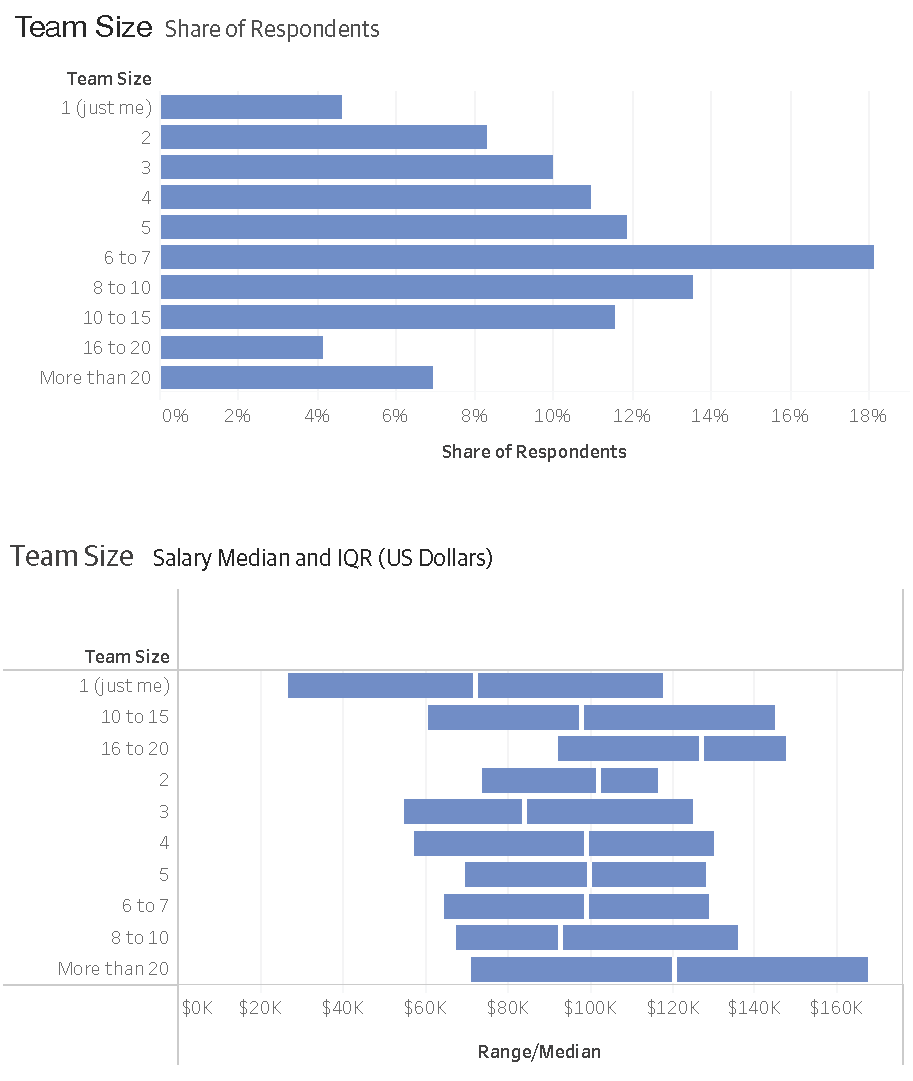
Team Size
Forty-five percent of the respondents work in small Ops teams of five people or fewer. Larger team size doesn’t necessarily equate to higher salaries. Overall, one-person teams had a median salary of only $72,000, whereas two-person teams had median salaries of $102,000. That’s a 30,000 jump just by the presence of another team member! Then, salaries drop with three-person teams and level out around 100,000 for 4-to-15 person teams. Members of larger teams (those with 16 or more members) earn $120,000. Teams this large likely correlate with larger companies that require a core Ops competency.
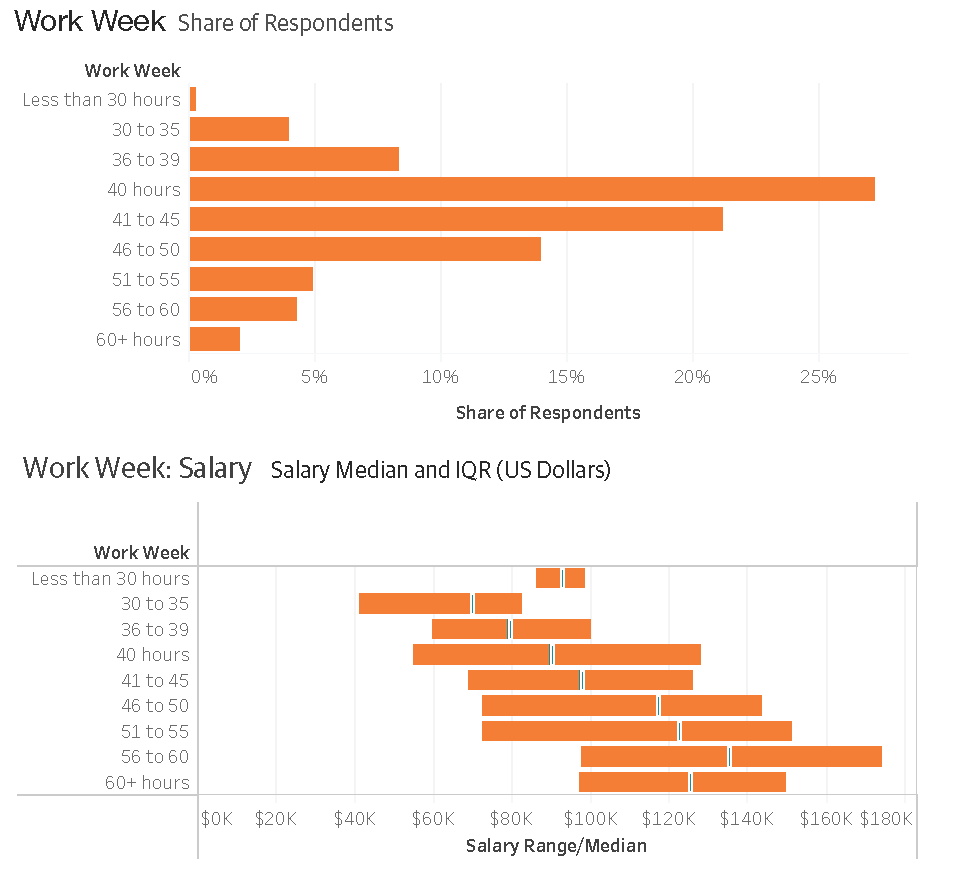
Work Week
The work week for Ops professionals is more than the normal 9-to-5 grind. More than half of our respondents work in excess of 40 hours per week. Furthermore, more respondents said they put in 60-hour weeks than work less than 30 hours per week.
Based on the data we collected, it appears that salary increases with the number of hours worked, although this might indicate seniority or key personnel who are highly compensated. The long hours might also be a byproduct of responsibility: just because you log lots of hours doesn’t mean you’ll see a raise any time soon.
A few respondents work fewer than 30 hours per week but have high salaries. This could be due to people splitting roles. For example, small companies might have a CTO working part-time on Ops and part-time writing code or performing other duties.
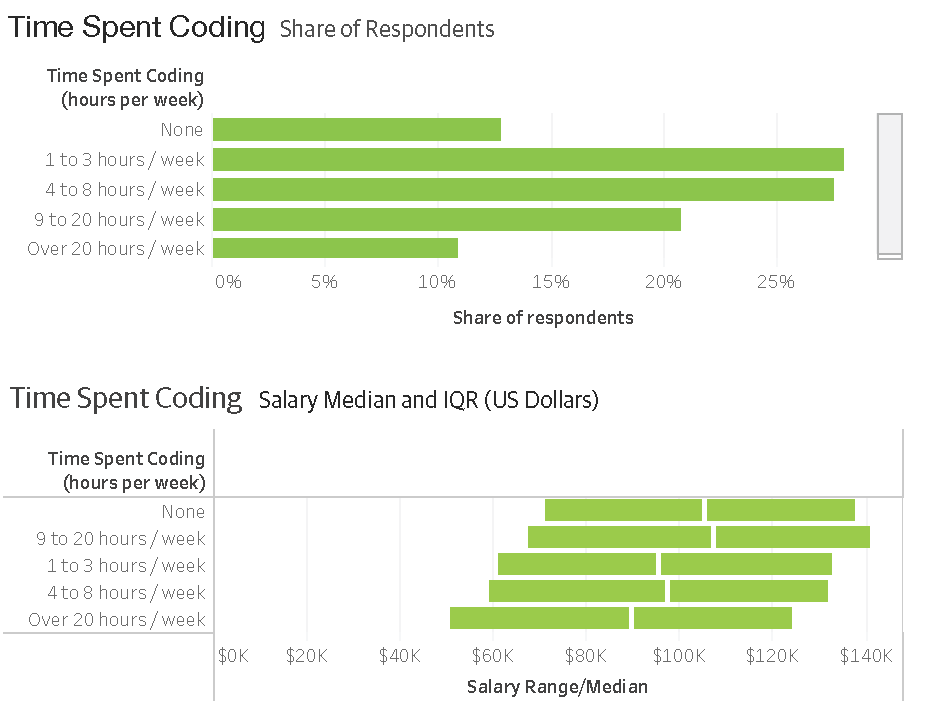
Time Spent Coding
When asked about coding, 13 percent of people responded that they don’t do any coding; their median salary is $105,000. We then see a curious trend upward. If you code a little (one to three hours per week), your median salary is 95,000. The more hours per week you spend coding, the more your salary increases—that is, until you reach 20-plus hours per week, at which point it drops dramatically from $107,000 to only $89,000.
There could be several underlying reasons for this. As we’ve seen in other surveys, time spent in meetings is a good proxy for responsibility, which correlates to higher salary. Respondents who spend the vast majority of their week with their heads down coding are less likely to be in leadership roles, and thus tend to earn less.
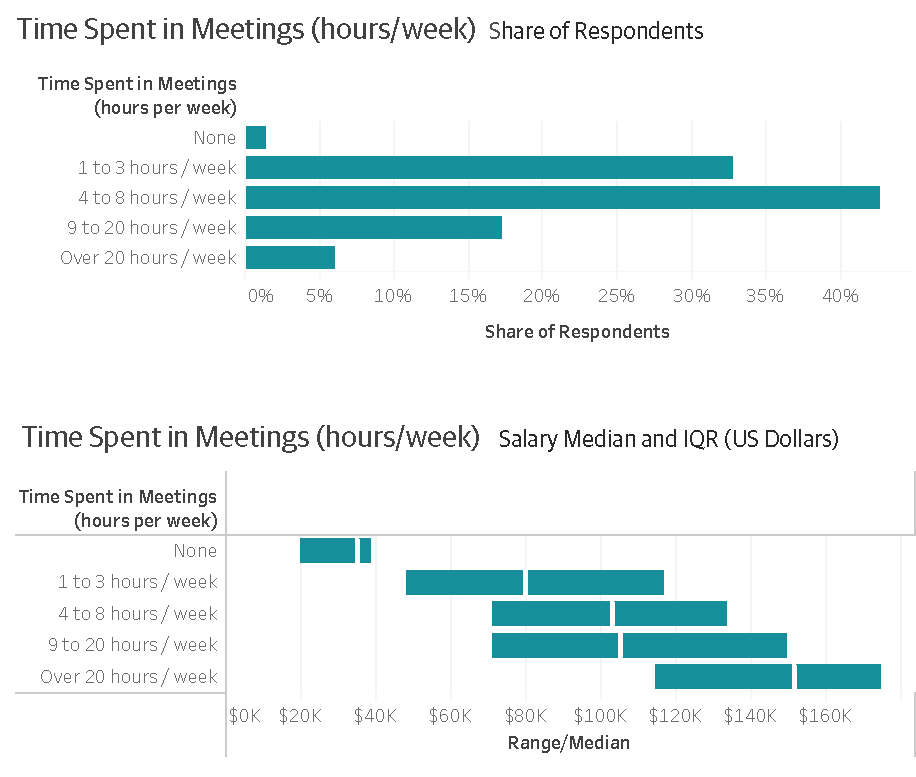
Time Spent in Meetings
As we noted earlier, meetings tend to serve as a proxy for responsibility, with more meetings correlating with higher pay. People who spend one to three hours per week in meetings have a median salary of $80,000, those who spend four to eight hours in meetings make $103,000, and those who spend 9 to 20 hours in meetings make $105,000. The six percent of respondents who spend more than half their weeks in meetings show a big jump in pay with a median salary of $151,000.
While an outlier, one percent of respondents claim to attend no meetings and report a median salary of $35,000.
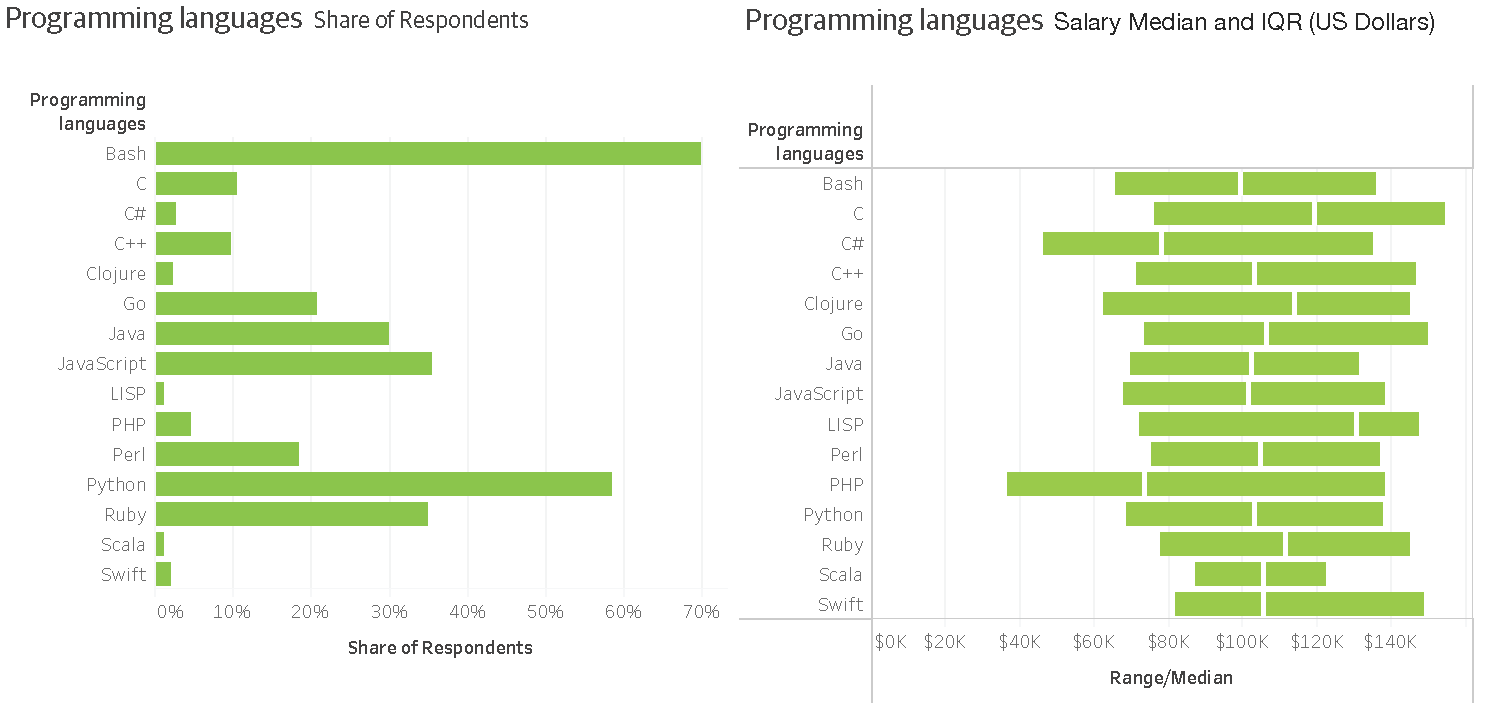
Programming Languages
Scripts rule the Ops world. The top four programming languages used by people who took this survey are all scripting languages: 70 percent of respondents know Bash, 58 percent Python, 35 percent JavaScript, and 35 percent Ruby.
Java is the first compiled language to appear on the list at only 30 percent response rate. Only 18 percent of the sample claimed to know Perl.
A surprisingly large share of users, 21 percent, use Go. In other O’Reilly salary surveys, many respondents wanted to learn Go, but very few (two to four percent) actually reported knowing Go. Maybe the language has found its niche in Ops. When we look at responses by company size, it isn’t just that a few large companies are using Go; rather, it’s a variety of organizations across broad spectrum of industries.
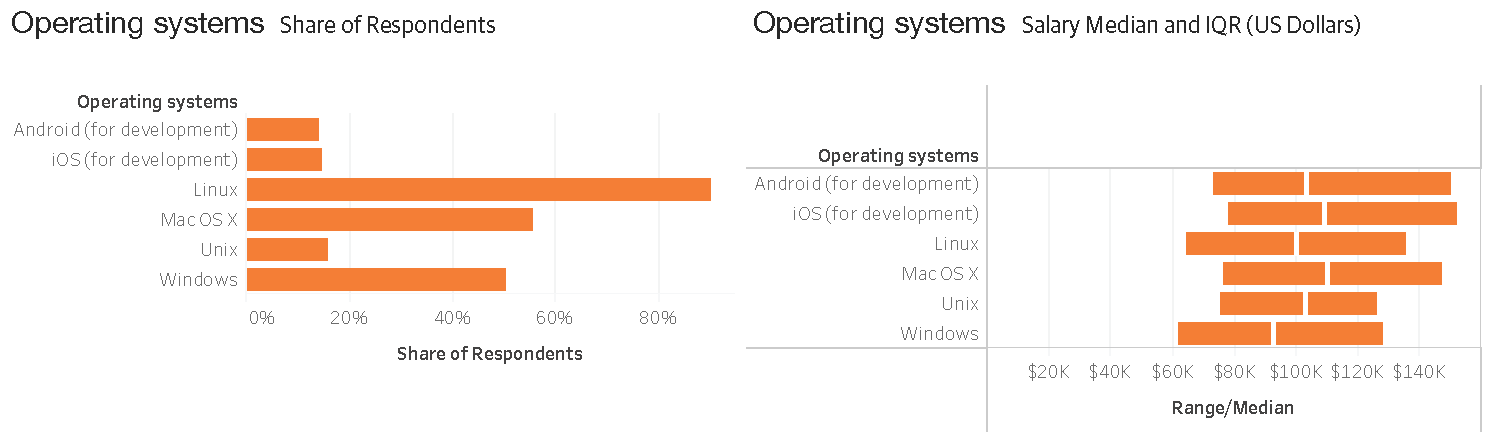
Operating Systems
We see a mix of different systems used regularly, but Linux tops the charts with 90 percent usage: almost everyone in Ops uses Linux to some extent. macOS, a Unix variant, had a 56 percent share, whereas Unix itself was used by 16 percent of the sample. Half of the respondents use Windows for Ops, likely as a mix between workstations and servers, in some cases as frontends to Linux/Unix servers. Roughly 15 percent of the respondents use iOS for development and 14 percent use Android for development.
Education
Fifty-seven percent of our respondents specialized in computer science, mathematics, or statistics. The other 43 percent either studied something else or did not attend university.
Twenty-eight percent of the respondents completed a master’s degree (this group had a median salary of $95,000) and two percent have completed a PhD (and had a median salary of $111,000). In general, the higher your level of education, the more you tend to earn. Those with advanced degrees might have acquired specialized skills that are in higher demand.
Industry
A third of our respondents work in the software industry and earn about $113,000. Other industries with fewer respondents show higher salaries: media and entertainment ($114,000), computers/hardware ($118,000), and healthcare/medical ($121,000).
The second most common industry among our respondents was retail/ecommerce, with 11 percent of the sample. The median salary for this group is $82,500.
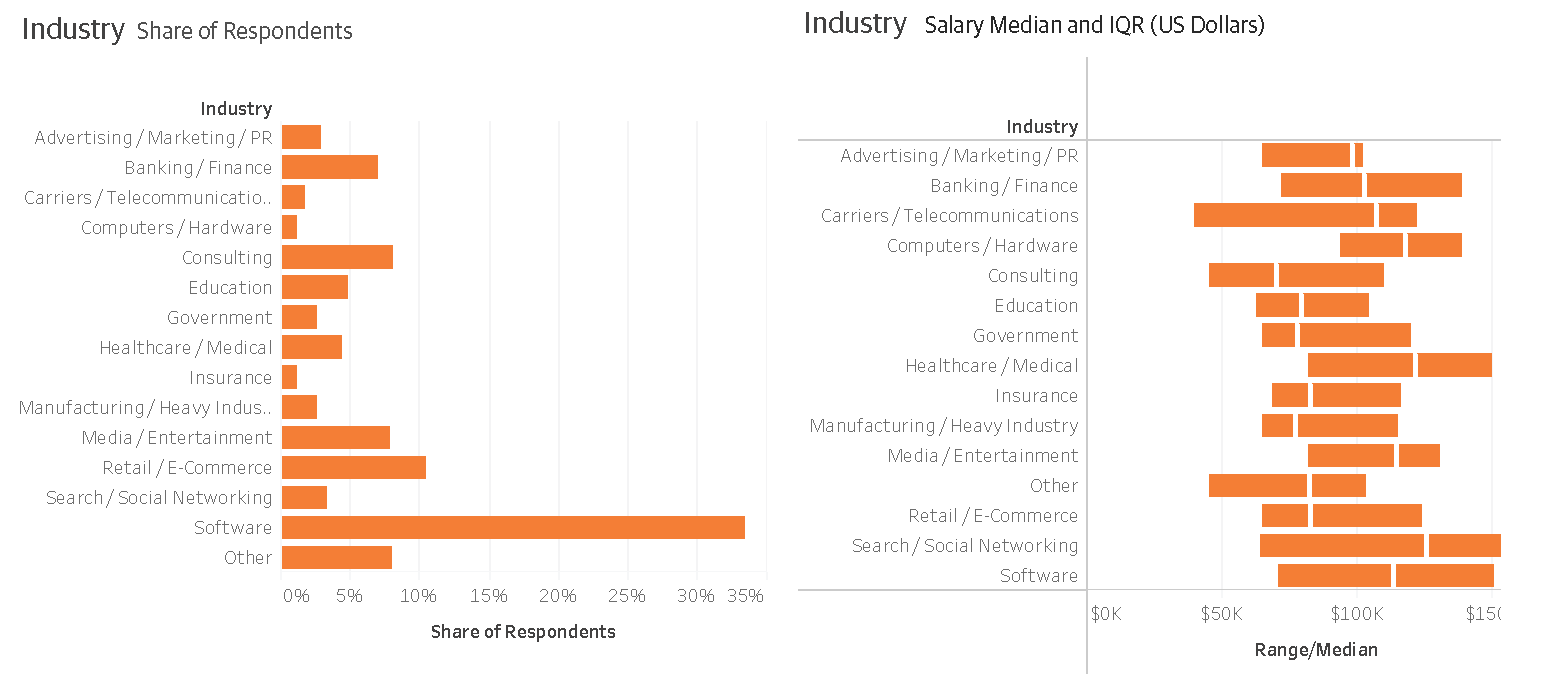
It does seem that software is eating the world, and where it does, Ops is there to make sure it keeps running smoothly.
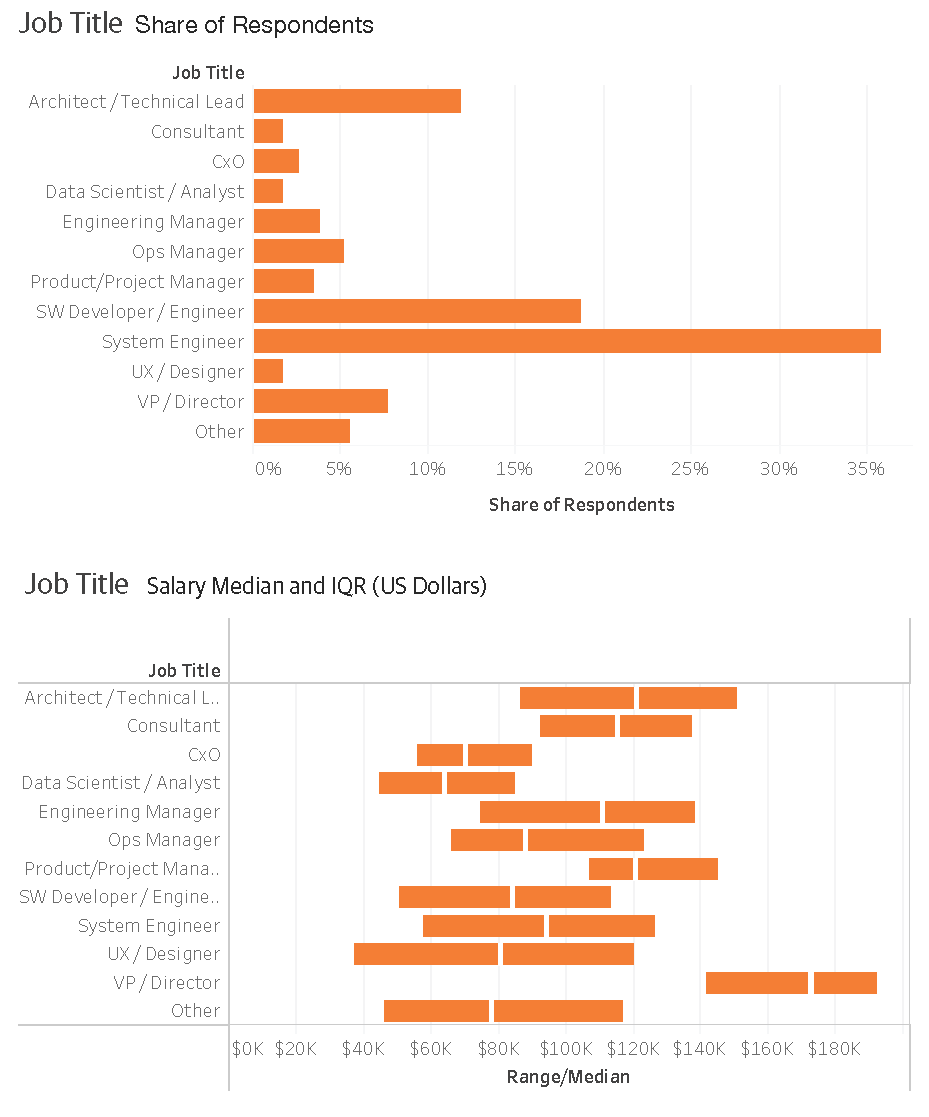
Job Title
The roles that Ops professionals take on are varied, but the most common job title, at 36 percent, is systems engineer, followed by software developer/engineer, at 19 percent. The third category, architect/technical lead, covers 12 percent of our respondents.
Eight percent of our respondents had VP/director roles, and earned an impressive $173,000 median salary.
A deeper dive into job titles shows that around seven percent of respondents list themselves as site reliability engineers (SREs)—a relatively new role that’s becoming more common in the industry, and which we plan on tracking over the next few years.
It appears that there are many flavors of Ops. Thirteen percent of our respondents have the term Ops somewhere in their job titles: WebOps, CloudOps, DevOps, and so on. Of course, this isn’t unexpected in an Ops salary survey. We plan on watching for trends in such titles over time.
Collaboration
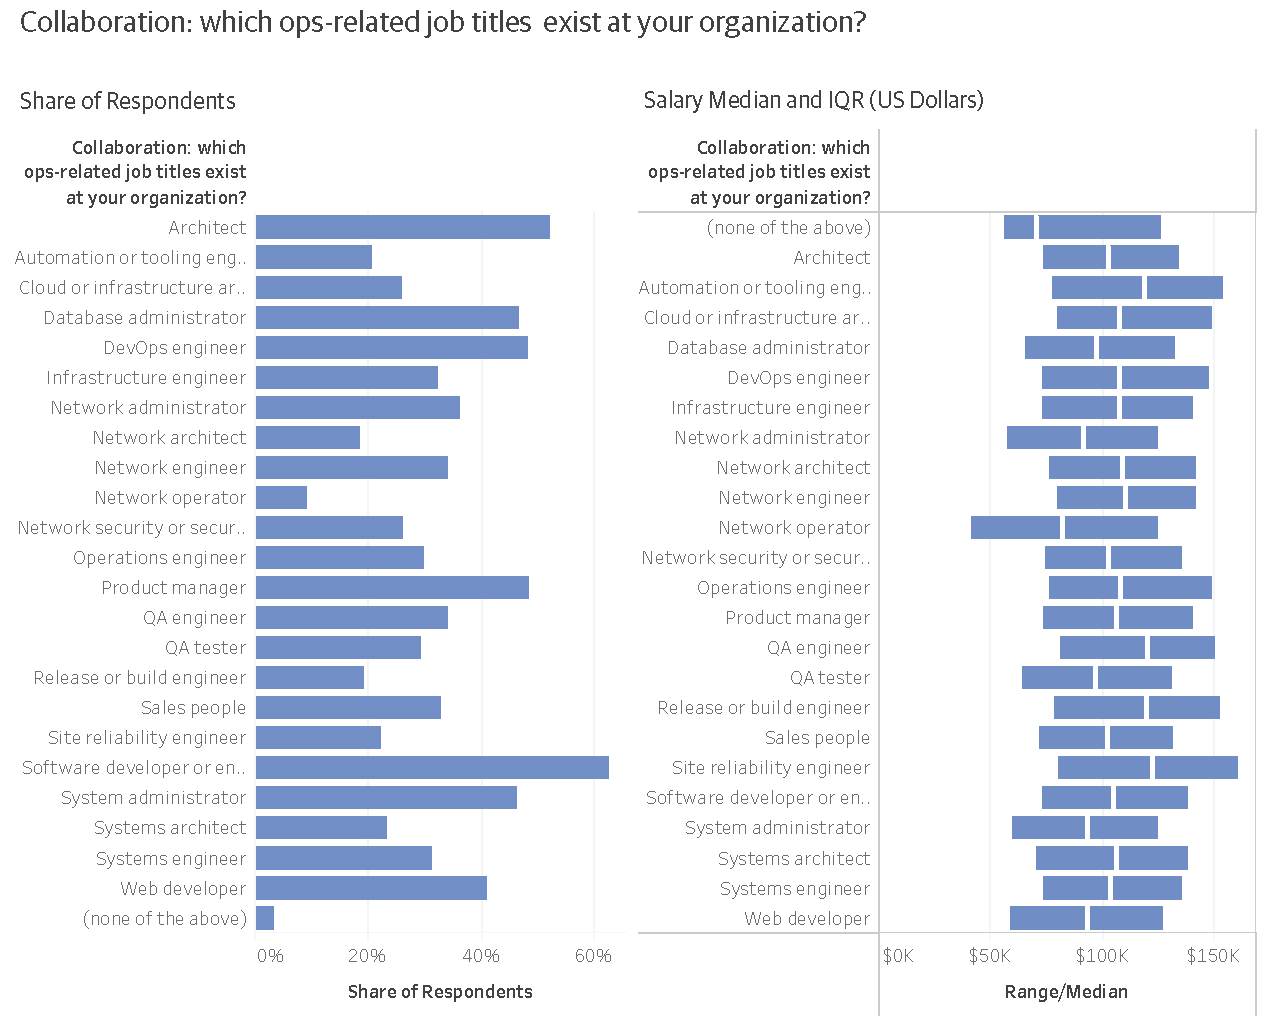
When we look at the roles that Ops professionals work most closely with, we see several standout job titles. Sixty-three percent of the time, Ops people are working with software developers or engineers; 52 percent of the time with architects. Both of these connections make sense, given that Ops folks are there to keep software builds and deployments running smoothly, but they are also part of the bigger organizational picture in the infrastructure and architecture, such as choice of cloud providers, PaaS and IaaS.
A little less than half the time, Ops professionals work with product managers (48 percent), DevOps engineers (48 percent), database administrators (47 percent), or system administrators (46 percent). These connections to the technical roles are expected and make sense. The surprising finding is the high share of Ops folks working with product managers, although maybe this shouldn’t be too surprising: as Ops and performance becomes more and more critical to what companies sell and how they sell it, Ops becomes an important resource for product managers to interact with and include in product planning and roadmaps. This is yet another manifestation of software eating the world.
Career Advancement
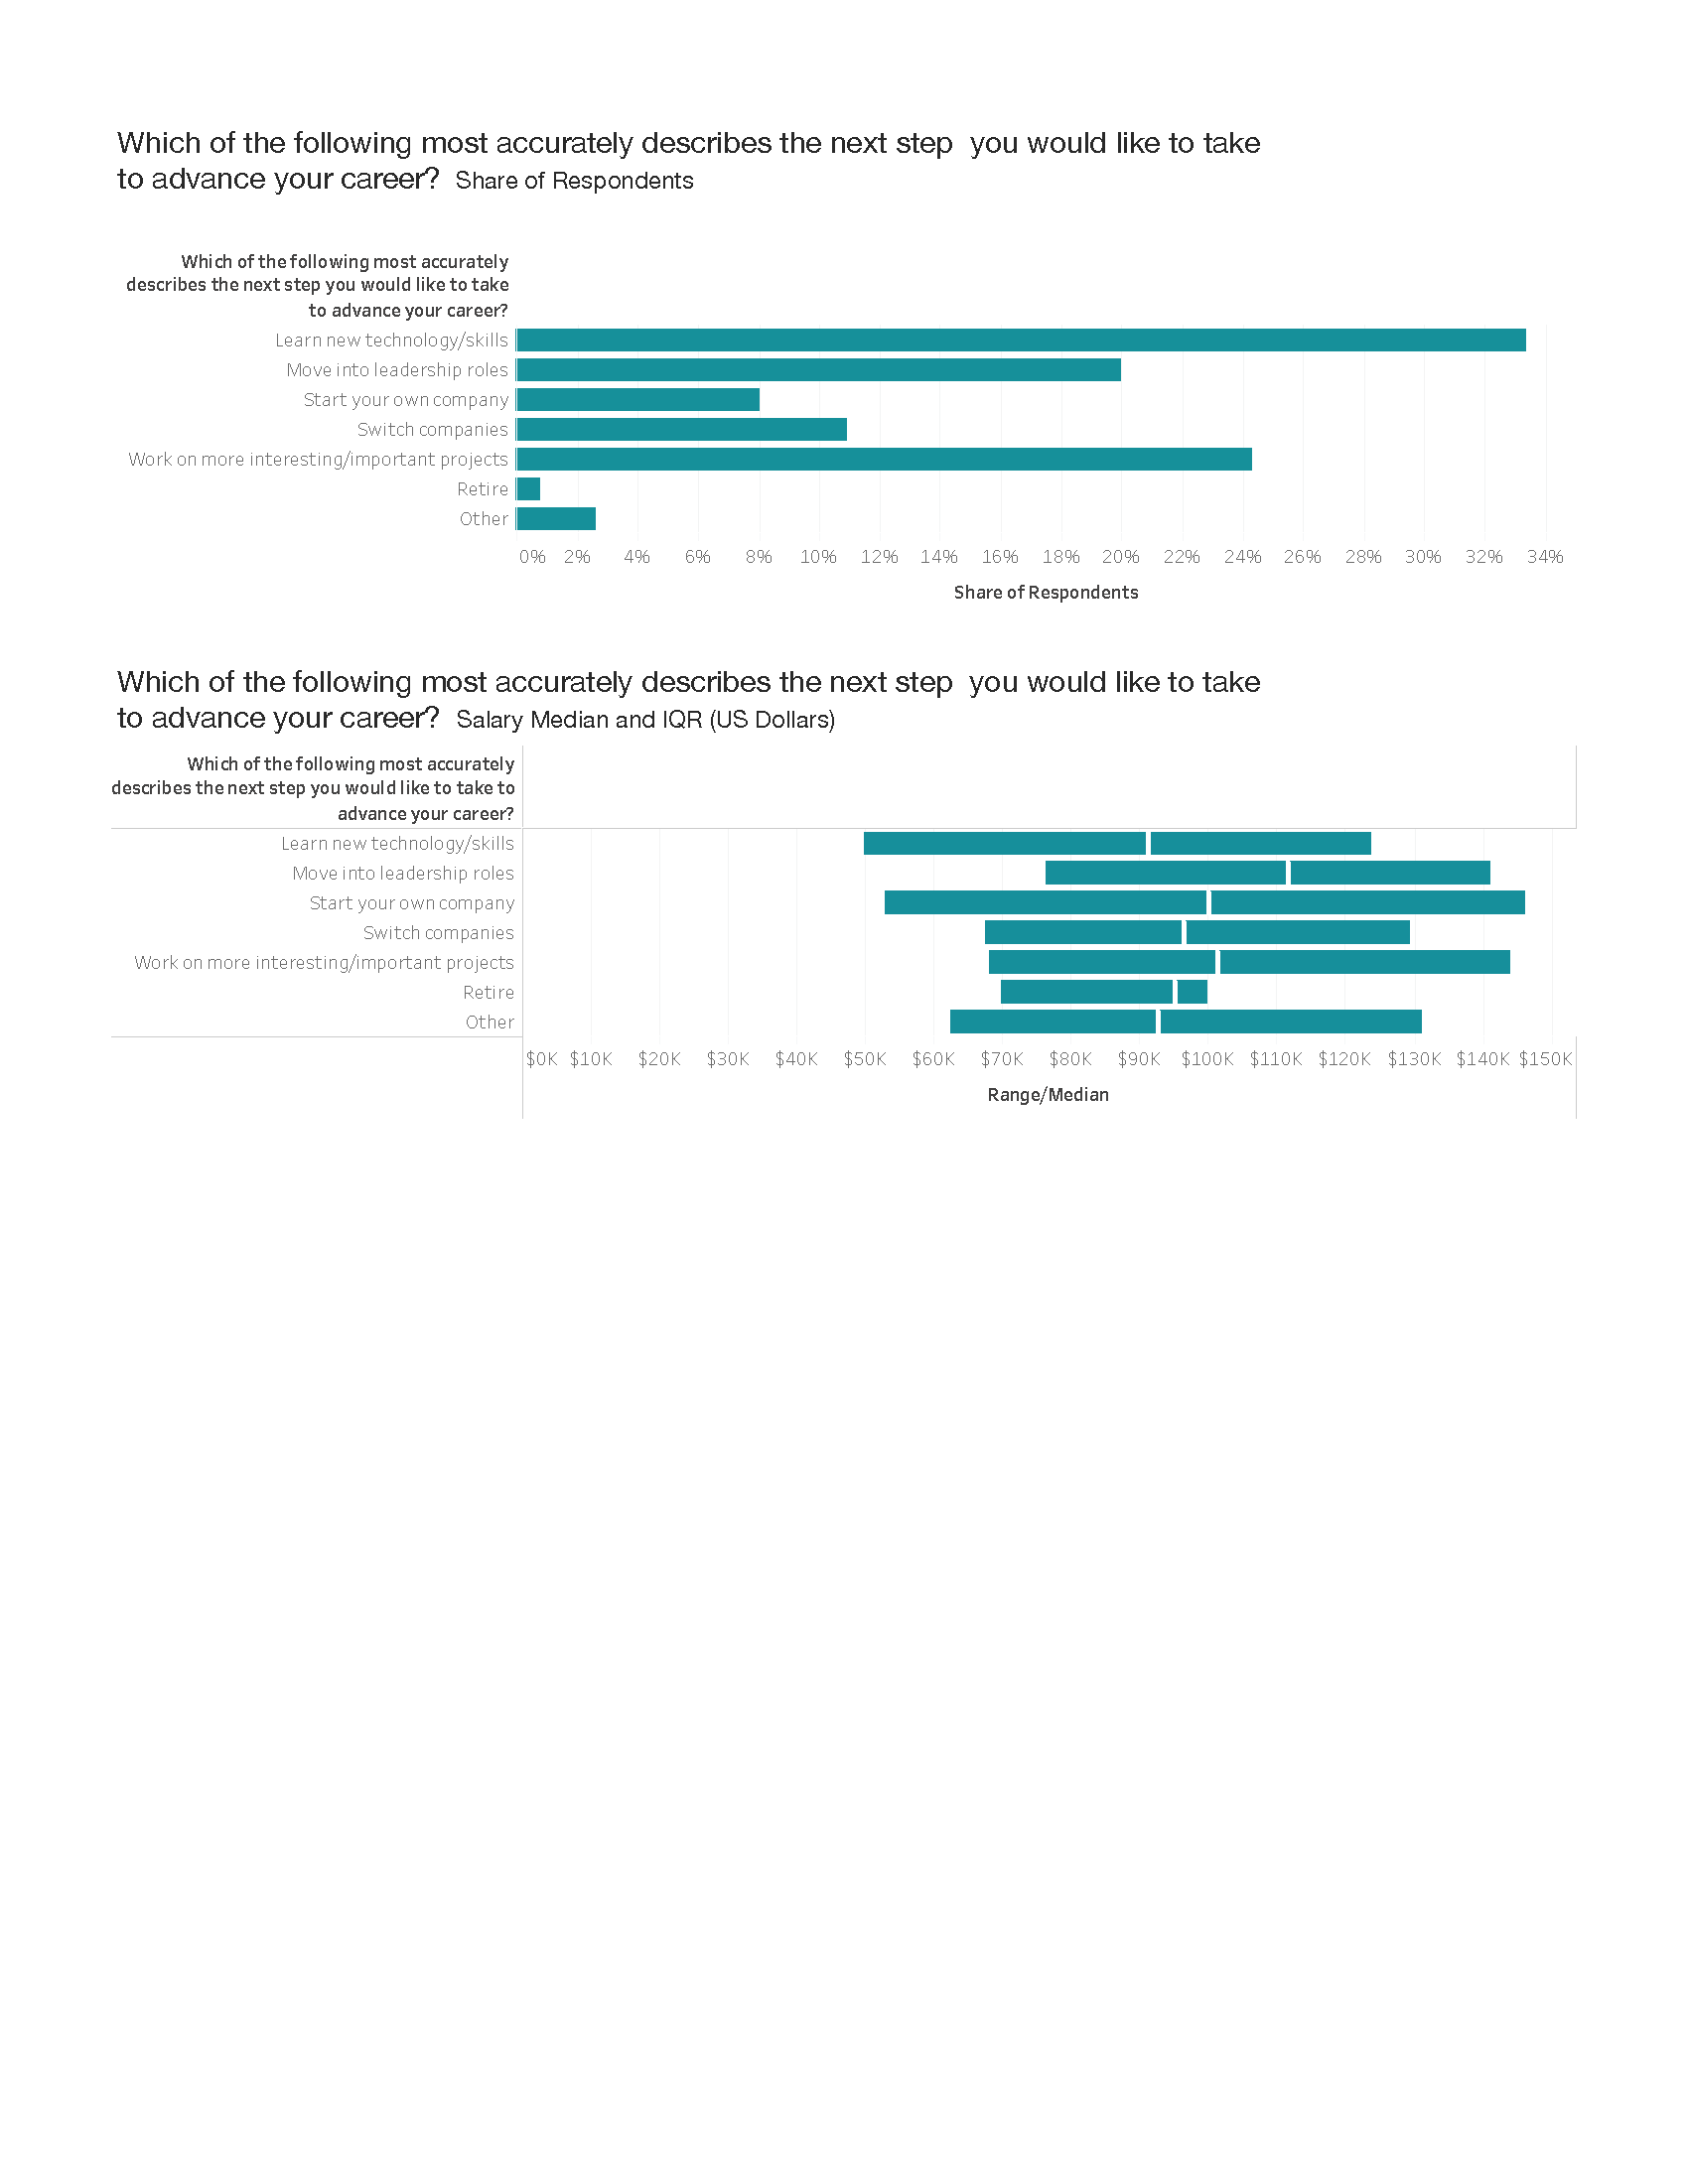
There are lots of ways in which you can advance your career, depending on what motivates you: wanting more responsibility, less stress, an easier commute, or more flexibility, for example. When we asked our respondents what next step they would take to advance their careers, a third of them answered that they want to learn new technologies or skills.
Twenty percent of the respondents thought that leaving their company was the next logical move. Eleven percent saw switching companies as the only way to advance their careers, and eight percent thought that starting their own company was the best option. Only one percent were looking to retirement as their next career move.
One quarter of respondents want primarily to work on something interesting or important, whereas another 20 percent want to move into leadership roles.
Of all the options (learn new technology/skills, work on more interesting/important projects, switch companies, start your own company, retirement, move into leadership roles, and other), the respondents who were thinking of moving into leadership roles had the highest salaries at $112,000.
Work Evaluation
There were several questions in the survey that asked respondents to rate their feelings about their jobs on a scale of 1 to 5 (1 being lowest, 3 being neutral, and 5 being highest).
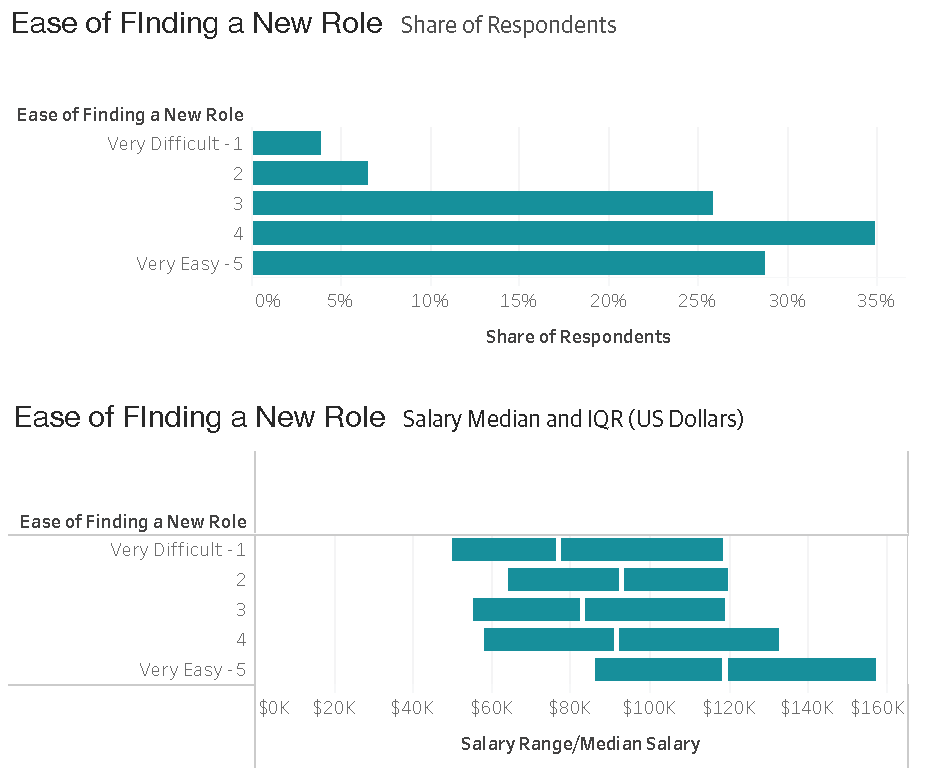
Ease of Finding a New Role
Only 11 percent of the respondents rated themselves low (1 or 2) in their ability to find a new role. A quarter were neutral, and 64 percent had high confidence in their ability to find a new role. This likely reflects the high demand for Ops skills and indicates that movement between positions and companies is relatively fluid.
Bargaining Skills
Twenty-seven percent of the respondents rated themselves low in their ability to bargain, 38 percent were neutral, and only 9 percent rated themselves a 5. The difference between the salaries of those with a self-reported rating of 5 ($124,000) and those who rated themselves a 4 was nearly $17,000.
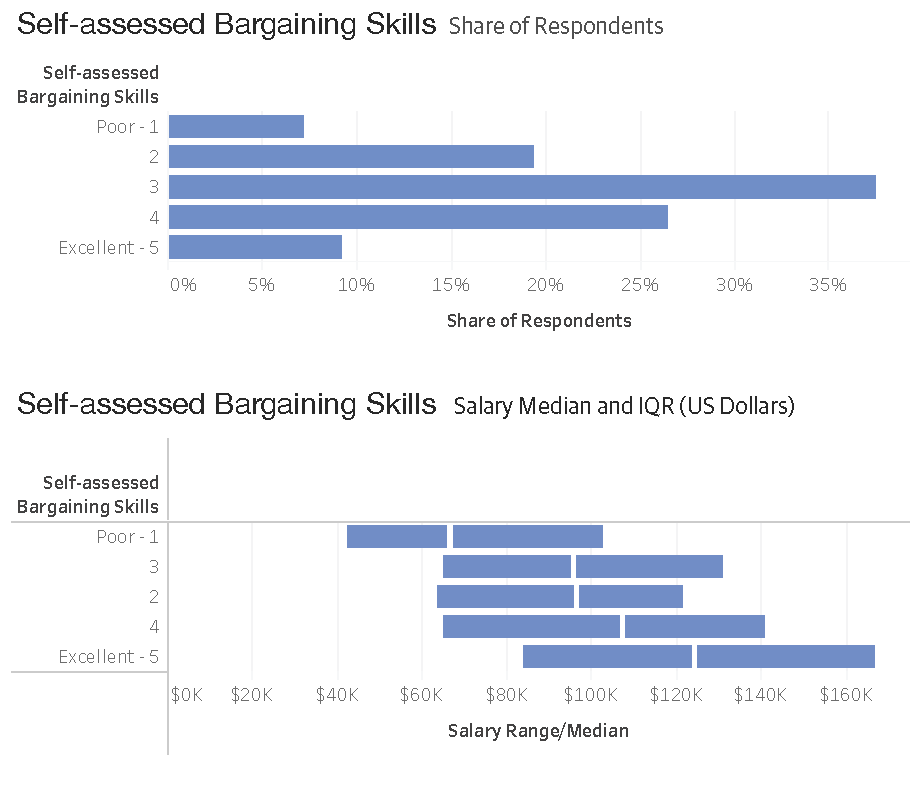
If there is only one thing that you can do to improve your salary situation, it would be to take a course in bargaining! The payoff can be lucrative.
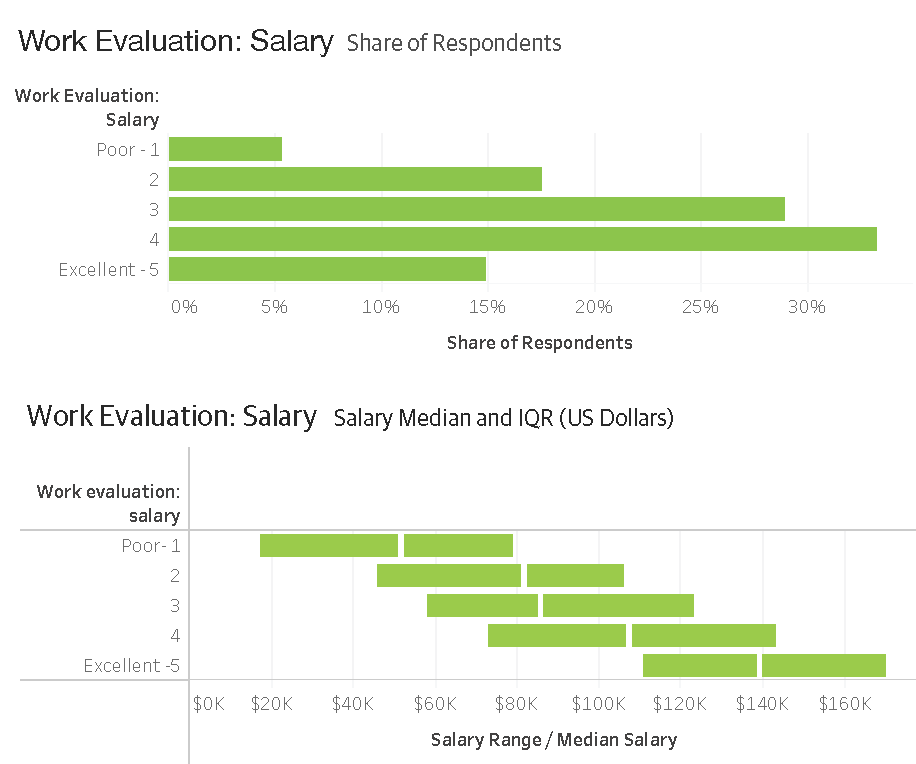
Salary
Five percent of respondents are very unhappy (a 1-rating) with their salary. Their median average salary is $51,000, nearly half of the overall median salary. Forty-eight percent of respondents are happy with their salary (rating it 4 or 5); they are paid $107,000 and $139,000, respectively. Nearly three times the number of respondents are very happy with their salaries compared to those who are very unhappy.
Nonmonetary Compensation
Besides salary, we also looked at other aspects of compensation, such as quality-of-life variables. Sometimes, people are willing to sacrifice a higher salary for a better work–life balance, but this is not supported by the data. According to our results, all of the following factors increase with pay. Companies that are willing to respect their employees’ time and talents also reward them well.
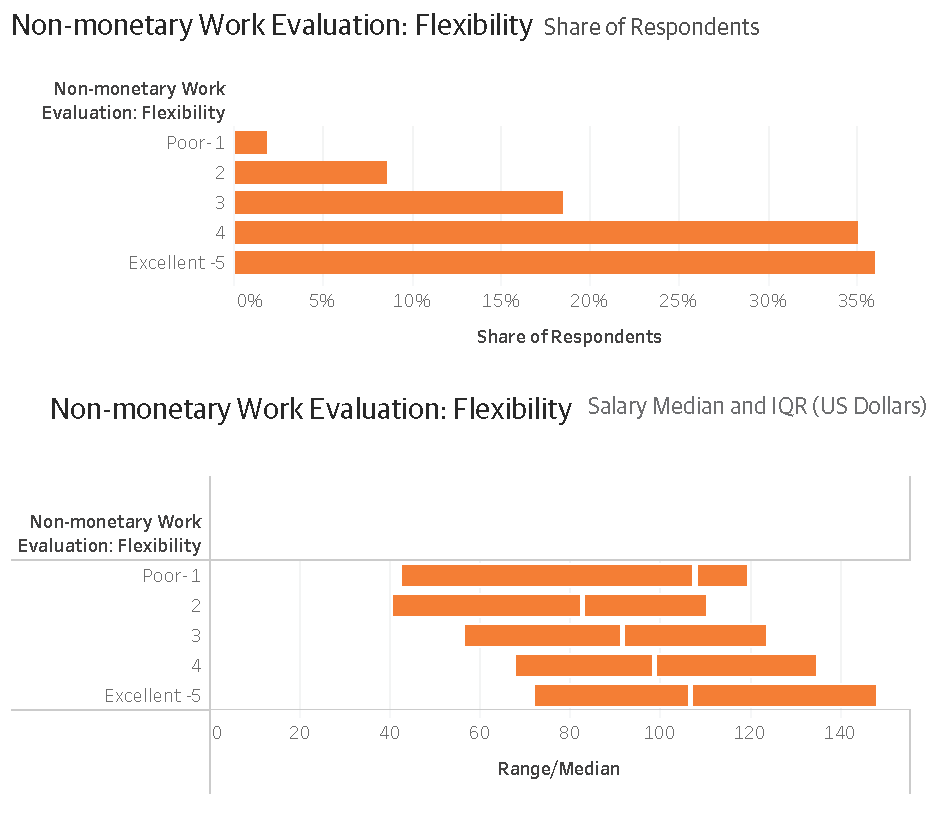
Flexibility
Nearly three-quarters of our respondents are happy (4 or 5 rating) with their work flexibility. In the 24-hour world of Ops, in which downtime can make or break a company, it’s great to see that flexibility hasn’t been forgotten. Only 10 percent of our respondents are unhappy (1 or 2) with their flexibility situation.
On the other hand, as discussed earlier in this report, a high proportion of people are working much more than the regular 40 hours per week. Maybe flexibility is the only way to compensate for the long hours.
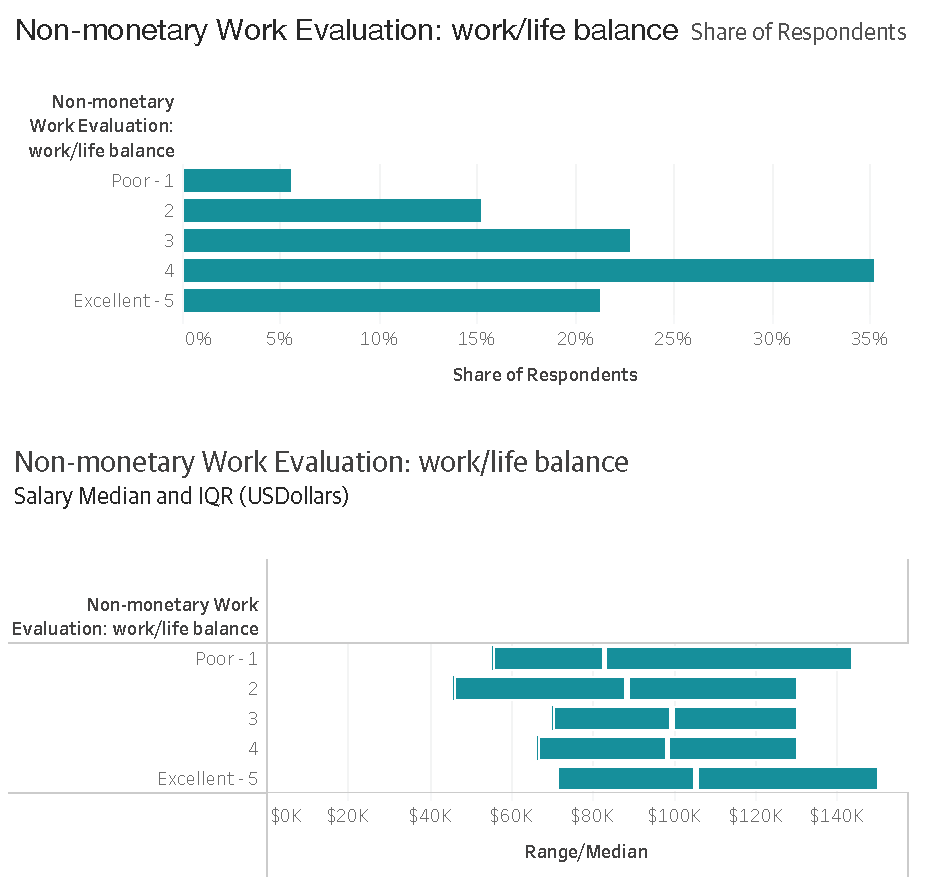
Work–life balance
Fifty-six percent of our respondents are happy (4 or 5 rating) with their work–life balance. This goes hand-in-hand with flexibility. When your employer is flexible, employees use that time to keep a healthy balance. Of the respondents who responded that they are happy with their work–life balance (4 or 5 rating), 86 percent also responded that they are happy with their flexibility (4 or 5 rating).
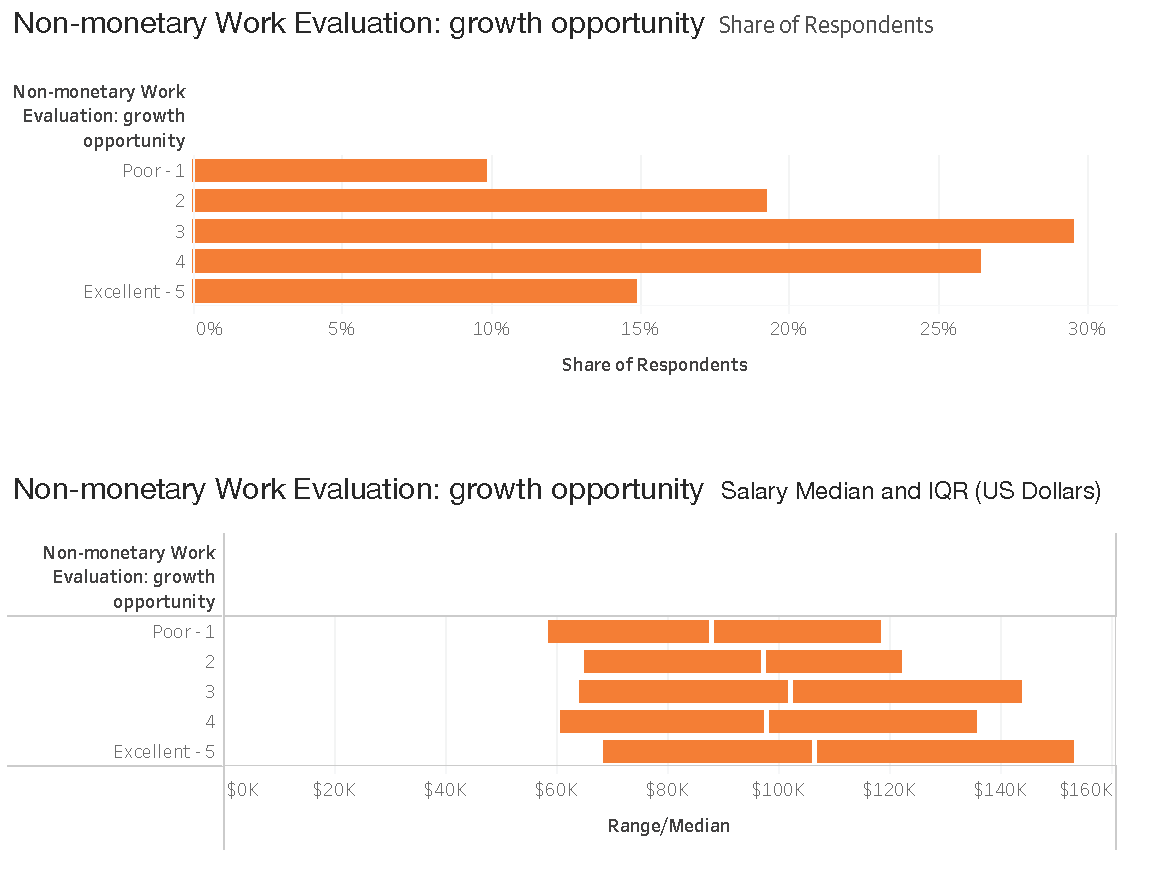
Growth opportunities
Respondents are slightly less optimistic about their growth opportunities than they are regarding other areas of nonmonetary compensation: only 41 percent responded positively to this question and 30 percent are neutral (rated 3). That left 29 percent of respondents reporting they are unhappy (rated 1 or 2).
Company culture
With such positive responses to life–work balance and flexibility, it’s no surprise that fewer than 25 percent of our respondents are unhappy with their company culture.
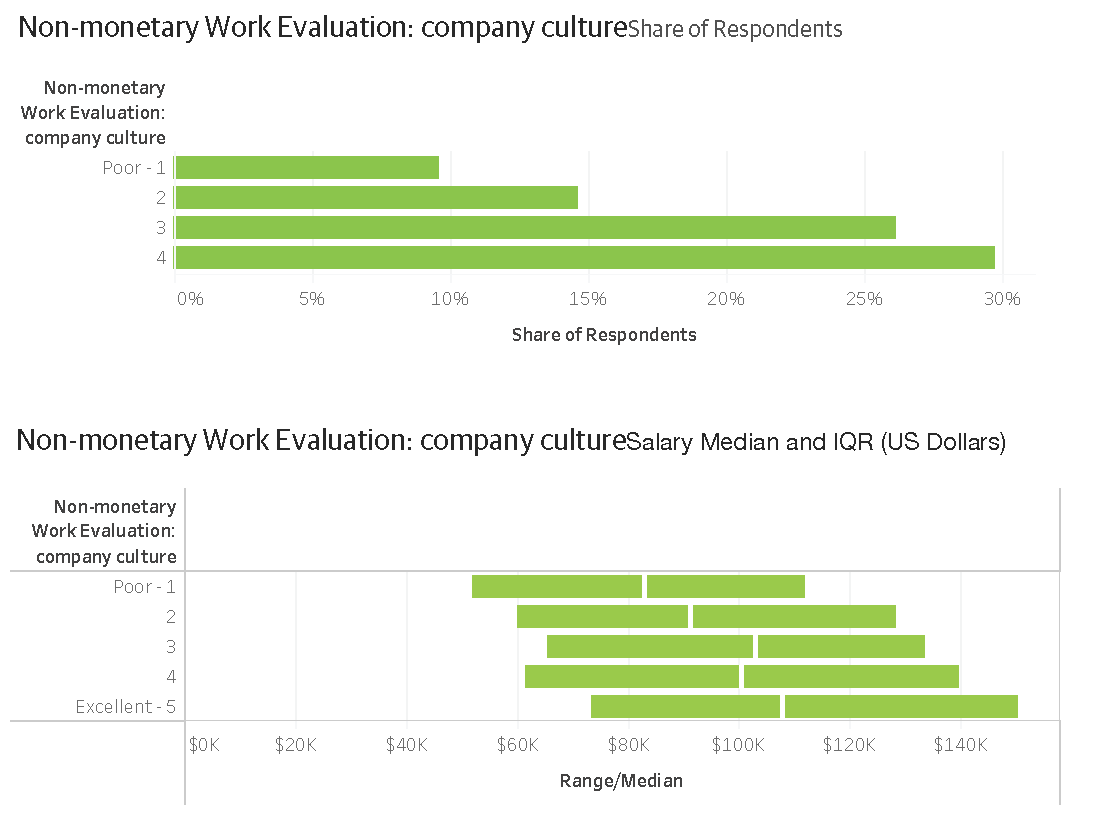
Company culture comes in many different forms, but given the odd number of hours Ops professionals work each week, it seems that our respondents value what their companies have to offer.
Scorecards
Beyond the demographic, salary, and workplace factors we asked about, we also dug a little deeper into the life and inner workings of what it’s like to be in Ops. We wanted to know what technologies are being used and deployed, and how often and how successfully.
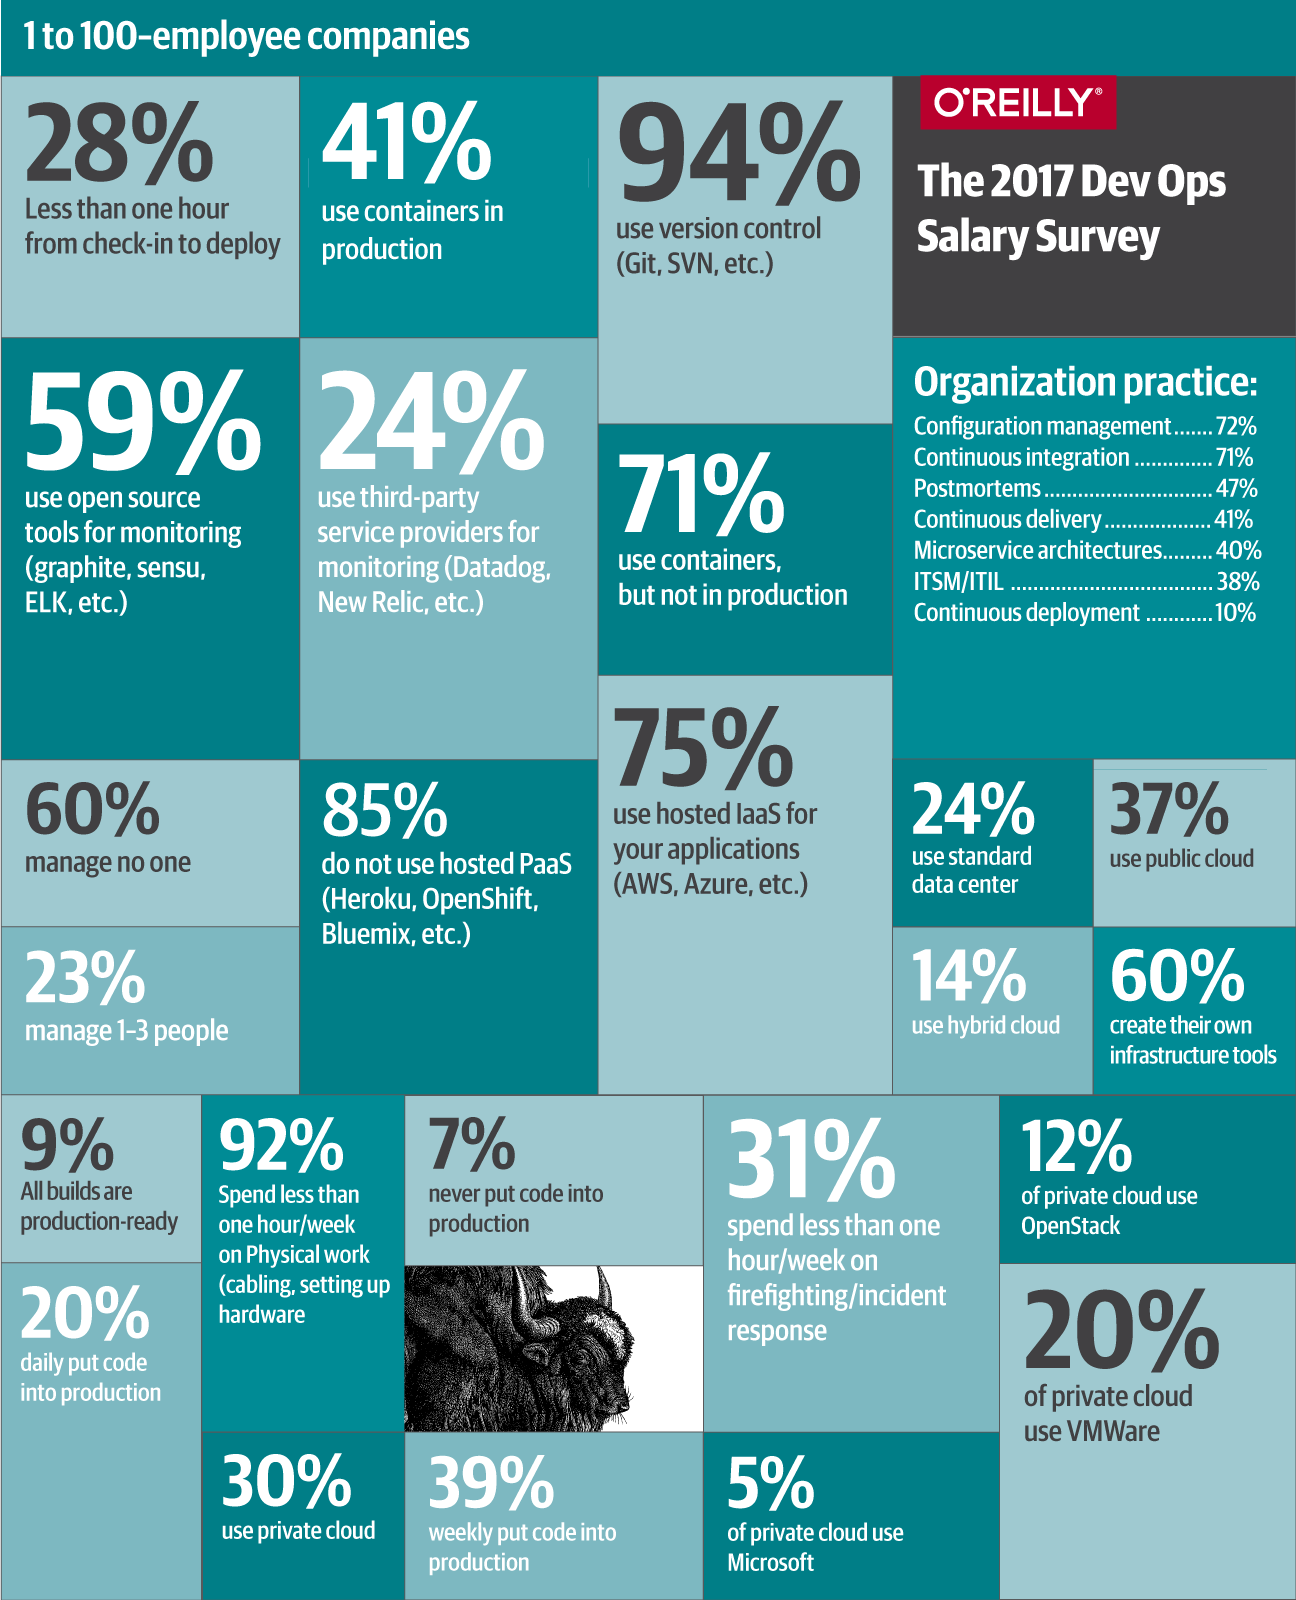
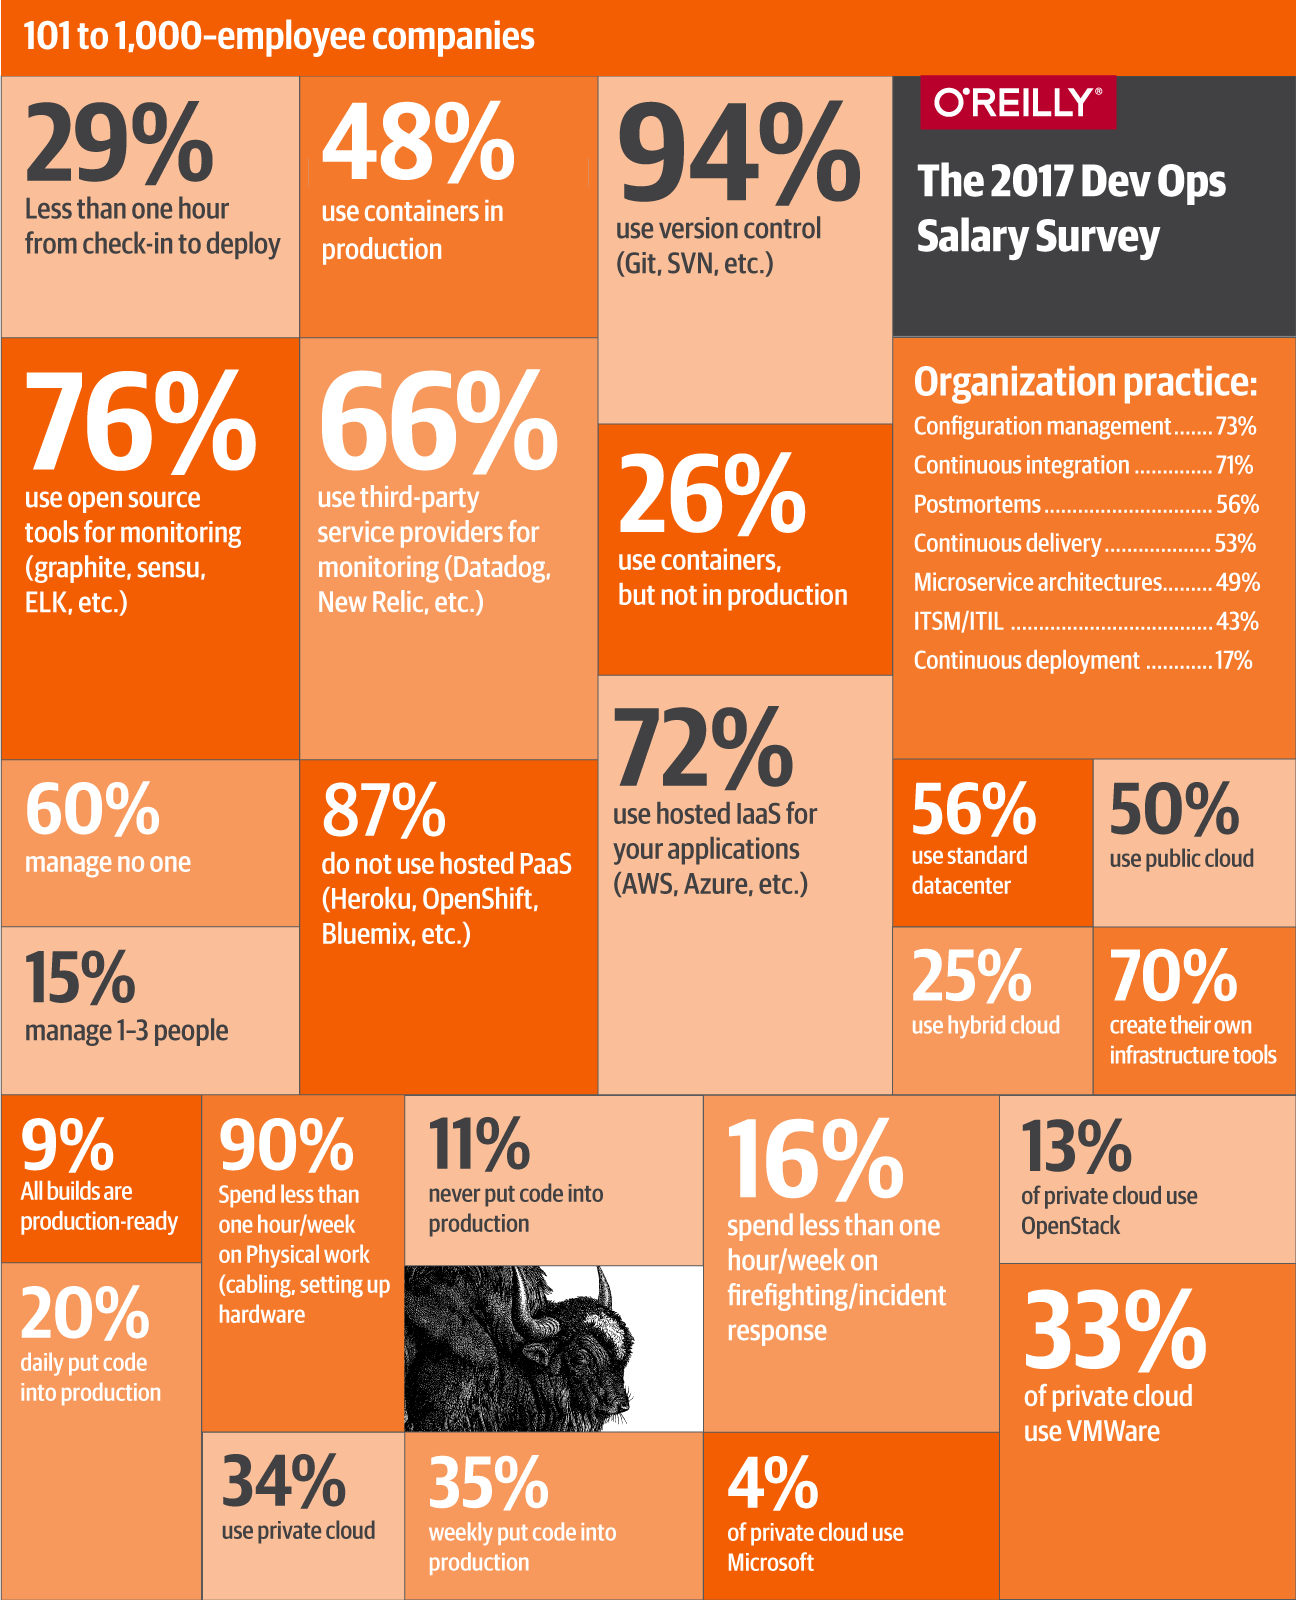
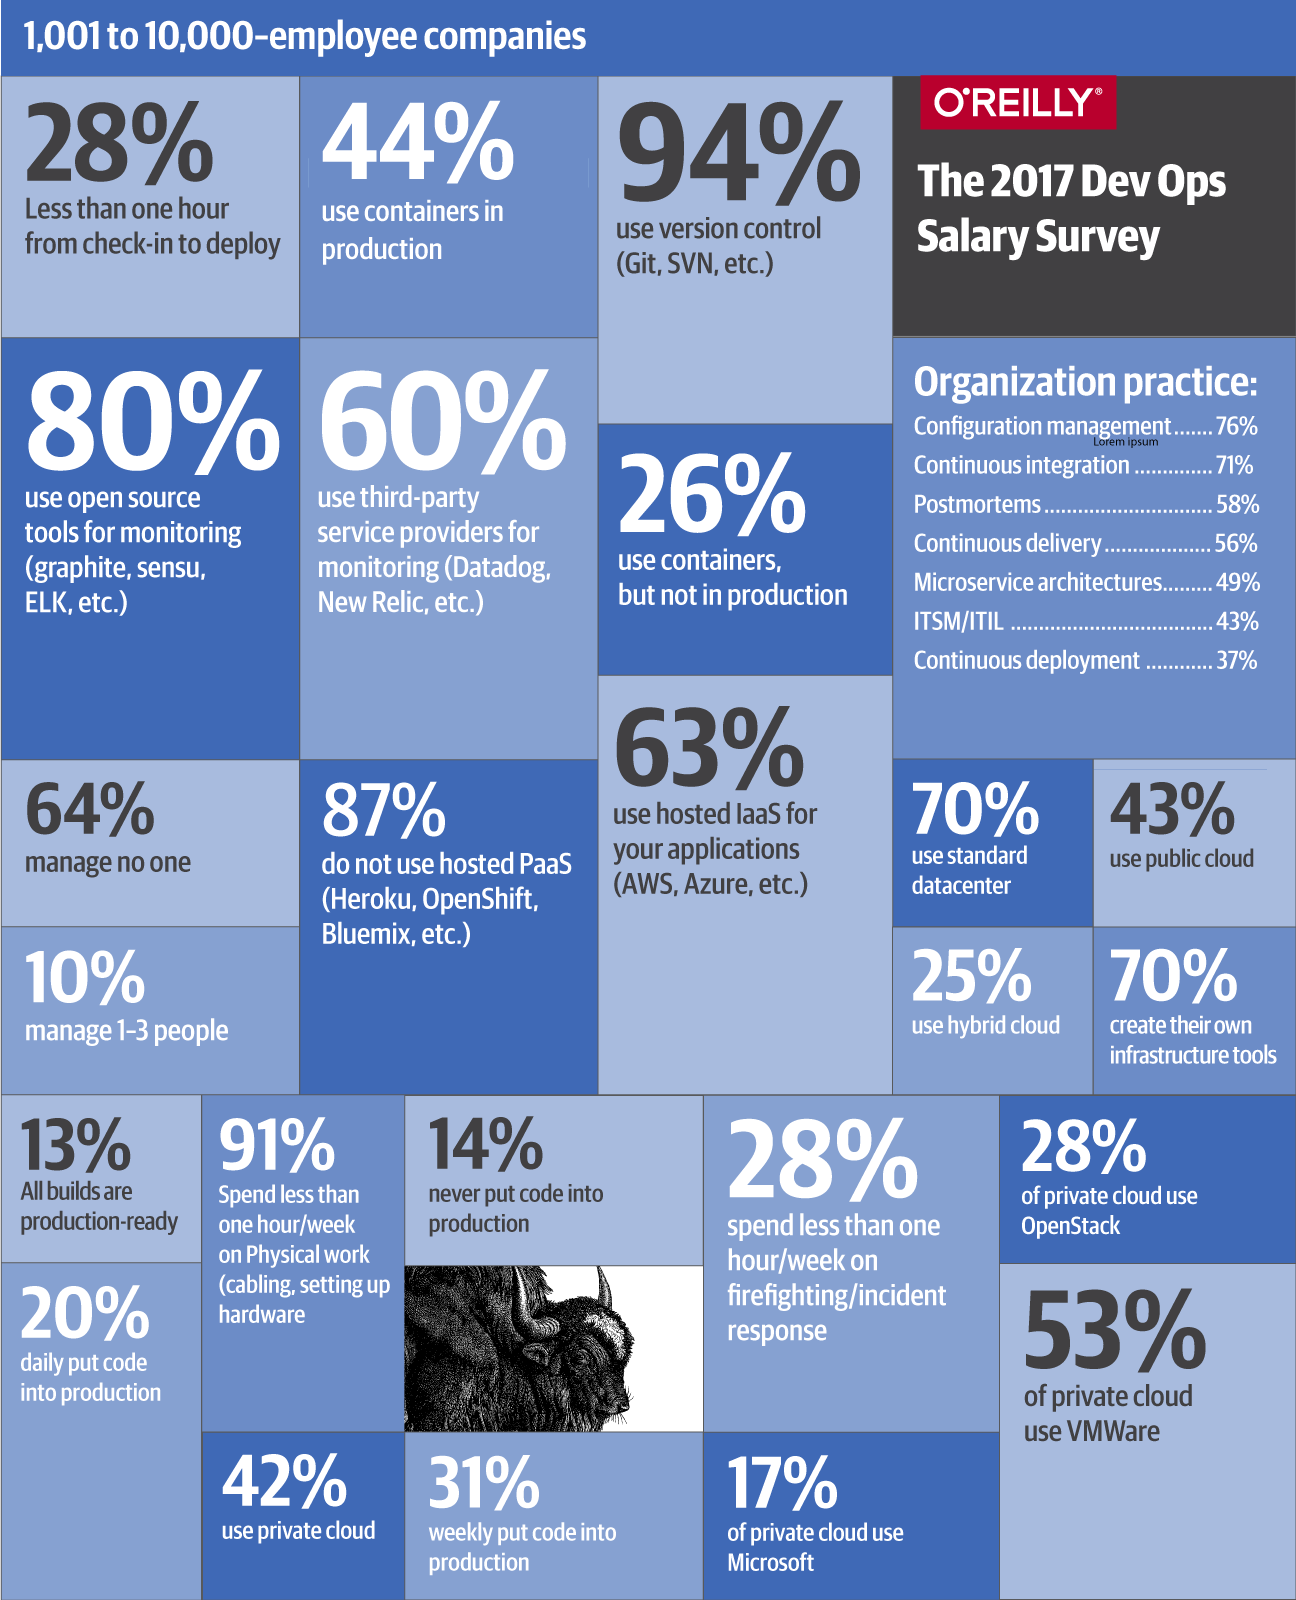
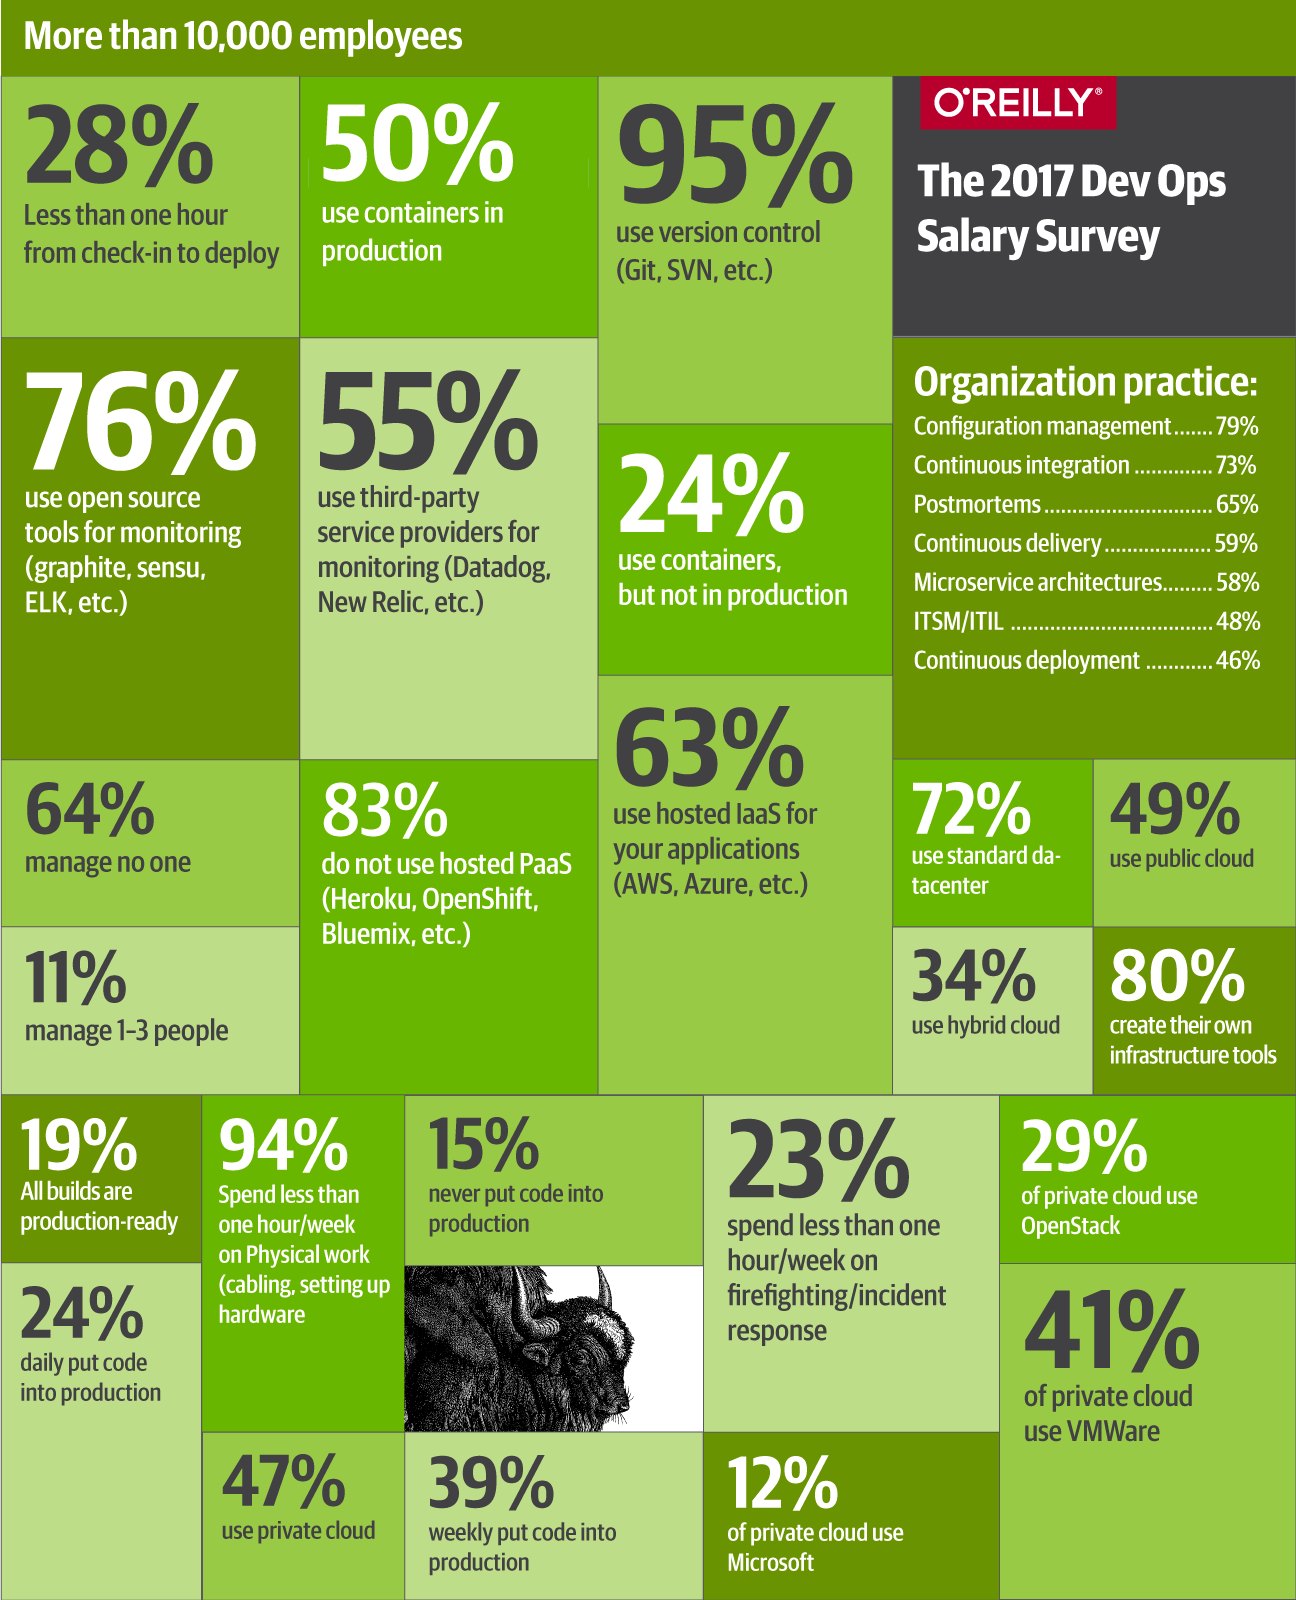
We created a scorecard for each of our company sizes (see Tables 1 through 4): 1–100 employees; 101–1,000; 1,001–10,000; and more than 10,000. You can skip to the table that matches your company size to get a sense of what things are like at similar sized companies and what technologies, problems, and solutions they are dealing with.
Model
The model has an R-squared of 0.65. This means that the model explains approximately 65 percent of the variation in the sample salaries. Geography is used as the Y-axis intercept of the model; select the appropriate location and then proceed through the coefficients, adding or subtracting the ones associated with a feature that applies to you. After you sum up the coefficients, you will obtain the model’s estimate for your annual total salary in US dollars.
Location:
- California: $122,458
- Texas: $97,597
- Northeast: $97,039
- Mid Atlantic: $95,757
- Pacific Northwest: $92,959
- Southwest Mountain: $92,927
- South: $89,354
- Midwest: $75,648
- Australia/New Zealand: $75,059
- Canada: $64,059
- Western Europe: $49,537
- Asia: $43,461
- Latin America: $29,861
- Eastern Europe: $15,522
- Africa: $13,376
Experience:
- $1,526 (per year)
Gender:
- Male: +$8,799
Company Size:
- 2–25: –$21,597
- 26–100: –$16,141
- 101–500: –$98,45
- 501–1,000: –$10,978
- 1,001–2,500: –$16,276
Education:
- PhD: +$16,726
Job Title:
- Ops manager: +$9,255
- Consultant: +$22,871
- Product project manager: +$27,196
- Architect/technical lead: +$18,614
- Data scientist/analyst: –$15,935
- VP/director: +$42,365
Industry:
- Education: –$27,610
- Government: –$27,376
- Manufacturing/heavy industry: –$24,968
- Legal: –$59,280
Conclusion
This report, our first Ops salary survey, has uncovered some interesting aspects of operations roles that we did not anticipate. For example, Ops professionals are generally happy with their situations but also confident in their job mobility. Plenty of people do work long hours but often according to a flexible schedule.
Another important takeaway from this research is that there are fundamental differences between how Ops works at companies of different sizes. As companies grow, tools become more specific and are built more in-house, and private clouds are more common among larger companies.
When using information in this report to construct your own sense of what your salary should be or what you can do to increase it, remember that the survey data we collected is observational, not experimental. There are no guarantees that changing one variable will cause your salary to rise (immediately or eventually). Many attributes of a particular job are interconnected, and simply focusing on a single attribute and improving that as best as possible might not be the quickest way to achieve a pay raise. Furthermore, there are likely underlying factors not addressed in this survey that contribute to success and pay.
Although a sample of 650 Ops professionals is enough to draw some conclusions, keep in mind that the survey was online, open, and self-reporting. We should not expect the respondents to be an unbiased sample of the Ops community. For example, people familiar with O’Reilly Media are more likely to take one of our surveys and are more likely to have an interest in learning about new technology—although this bias is probably not enough to disqualify the conclusions presented in this report.
This survey aims to be a starting point that you can use to compare yourself and your situation to the general pool of respondents or to guide you on ways to improve your career, or to start a discussion with your team about what sorts of things you should be focusing on to both improve yourself and the company. We hope that however you use the survey, you find the results helpful. And, please, take the survey yourself: your perspective is crucial to continuing this research and improving our results. Thank you!