 Grant mechanical calculation machine, 1877
 Accessing Data with Type Providers
Working with data was not always as easy as nowadays. For example, processing the data from the decennial 1880 US Census took eight years. For the 1890 census, the United States Census Bureau hired Herman Hollerith, who invented a number of devices to automate the process. A pantograph punch was used to punch the data on punch cards, which were then fed to the tabulator that counted cards with certain properties, or to the sorter for filtering. The census still required a large amount of clerical work, but Hollerith’s machines sped up the process eight times to just one year.1
These days, filtering and calculating sums over hundreds of millions of rows (the number of forms received in the 2010 US Census) can take seconds. Much of the data from the US Census, various Open Government Data initiatives, and from international organizations like the World Bank is available online and can be analyzed by anyone. Hollerith’s tabulator and sorter have become standard library functions in many programming languages and data analytics libraries.
Making data analytics easier no longer involves building new physical devices, but instead involves creating better software tools and programming languages. So, let’s see how the F# language and its unique features like type providers make the task of modern data analysis even easier!
Data Science Workflow
Data science is an umbrella term for a wide range of fields and disciplines that are needed to extract knowledge from data. The typical data science workflow is an iterative process. You start with an initial idea or research question, get some data, do a quick analysis, and make a visualization to show the results. This shapes your original idea, so you can go back and adapt your code. On the technical side, the three steps include a number of activities:
- Accessing data. The first step involves connecting to various data sources, downloading CSV files, or calling REST services. Then we need to combine data from different sources, align the data correctly, clean possible errors, and fill in missing values.
- Analyzing data. Once we have the data, we can calculate basic statistics about it, run machine learning algorithms, or write our own algorithms that help us explain what the data means.
- Visualizing data. Finally, we need to present the results. We may build a chart, create interactive visualization that can be published, or write a report that represents the results of our analysis.
If you ask any data scientist, she’ll tell you that accessing data is the most frustrating part of the workflow. You need to download CSV files, figure out what columns contain what values, then determine how missing values are represented and parse them. When calling REST-based services, you need to understand the structure of the returned JSON and extract the values you care about. As you’ll see in this chapter, the data access part is largely simplified in F# thanks to type providers that integrate external data sources directly into the language.
Why Choose F# for Data Science?
There are a lot of languages and tools that can be used for data science. Why should you choose F#? A two-word answer to the question is type providers. However, there are other reasons. You’ll see all of them in this report, but here is a quick summary:
- Data access. With type providers, you’ll never need to look up column names in CSV files or country codes again. Type providers can be used with many common formats like CSV, JSON, and XML, but they can also be built for a specific data source like Wikipedia. You will see type providers in this and the next chapter.
- Correctness. As a functional-first language, F# is excellent at expressing algorithms and solving complex problems in areas like machine learning. As you’ll see in Implementing Machine Learning Algorithms, the F# type system not only prevents bugs, but also helps us understand our code.
- Efficiency and scaling. F# combines the simplicity of Python with the efficiency of a JIT-based compiled language, so you do not have to call external libraries to write fast code. You can also run F# code in the cloud with the MBrace project. We won’t go into details, but I’ll show you the idea in Implementing Machine Learning Algorithms.
- Integration. In Conclusions and Next Steps, we see how type providers let us easily call functions from R (a statistical software with rich libraries). F# can also integrate with other ecosystems. You get access to a large number of .NET and Mono libraries, and you can easily interoperate with FORTRAN and C.
Enough talking, let’s look at some code! To set the theme for this chapter, let’s look at the forecasted temperatures around the world. To do this, we combine data from two sources. We use the World Bank2 to access information about countries, and we use the Open Weather Map3 to get the forecasted temperature in all the capitals of all the countries in the world.
Getting Data from the World Bank
To access information about countries, we use the World Bank type provider. This is a type provider for a specific data source that makes accessing data as easy as possible, and it is a good example to start with. Even if you do not need to access data from the World Bank, this is worth exploring because it shows how simple F# data access can be. If you frequently work with another data source, you can create your own type provider and get the same level of simplicity.
The World Bank type provider is available as part of the F# Data library.4 We could start by referencing just F# Data, but we will also need a charting library later, so it is better to start by referencing FsLab, which is a collection of .NET and F# data science libraries. The easiest way to get started is to download the FsLab basic template from http://fslab.org/download.
The FsLab template comes with a sample script file (a file with the .fsx extension) and a project file. To download the dependencies, you can either build the project in Visual Studio or Xamarin Studio, or you can invoke the Paket package manager directly. To do this, run the Paket bootstrapper to download Paket itself, and then invoke Paket to install the packages (on Windows, drop the mono prefix):
mono .paket\paket.bootstrapper.exe
mono .paket\paket.exe install
Once you have all the packages, you can replace the sample script file with the following simple code snippet:
#load "packages/FsLab/FsLab.fsx"
open FSharp.Data

let wb = WorldBankData.GetDataContext()
The first line loads the FsLab.fsx file, which comes from the FsLab package, and loads all the libraries that are a part of FsLab, so you do not have to reference them one by one. The last line uses GetDataContext to to create an instance that we’ll need in the next step to fetch some data.
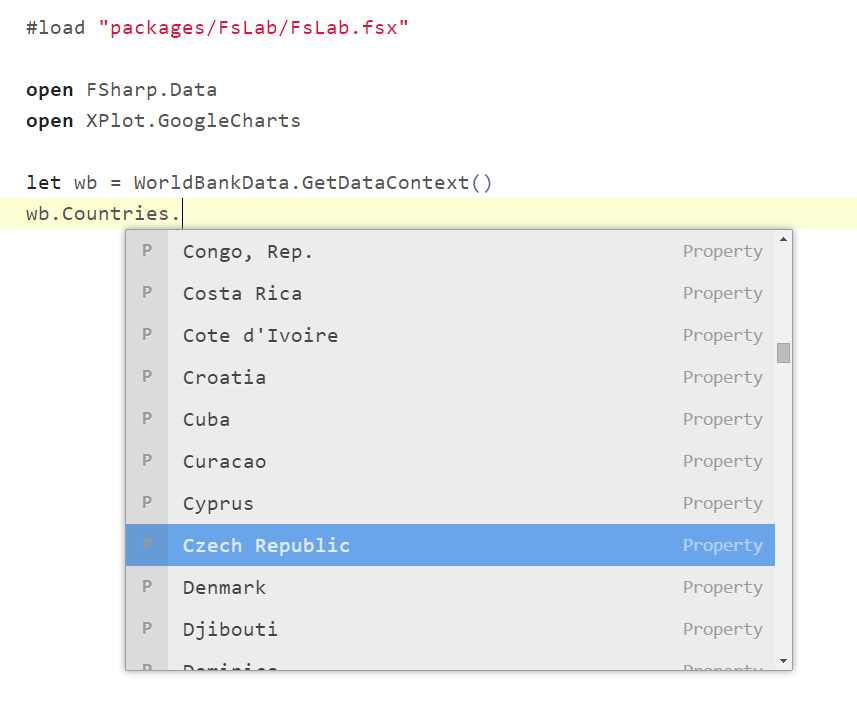
The next step is to use the World Bank type provider to get some data. Assuming everything is set up in your editor, you should be able to type wb.Countries followed by . (a period) and get auto-completion on the country names as shown in Figure 1-1. This is not a magic! The country names, are just ordinary properties. The trick is that they are generated on the fly by the type provider based on the schema retrieved from the World Bank.
Feel free to explore the World Bank data on your own! The following snippet shows two simple things you can do to get the capital city and the total population of the Czech Republic:
wb.Countries.``Czech Republic``.CapitalCity
wb.Countries.``Czech Republic``.Indicators
  .`` CO2 emissions (kt)``.[2010]
On the first line, we pick a country from the World Bank and look at one of the basic properties that are available directly on the country object. The World Bank also collects numerous indicators about the countries, such as GDP, school enrollment, total population, CO2 emissions, and thousands of others. In the second example, we access the CO2 emissions using the Indicators property of a country. This returns a provided object that is generated based on the indicators that are available in the World Bank database. Many of the properties contain characters that are not valid identifiers in F# and are wrapped in ``. As you can see in the example, the names are quite complex. Fortunately, you are not expected to figure out and remember the names of the properties because the F# editors provide auto-completion based on the type information.
A World Bank indicator is returned as an object that can be turned into a list using List.ofSeq. This list contains values for all of the years for which a value is available. As demonstrated in the example, we can also invoke the indexer of the object using .[2010] to find a value for a specific year.
The typical data science workflow requires a quick feedback loop. In F#, you get this by using F# Interactive, which is the F# REPL. In most F# editors, you can select a part of the source code and press Alt+Enter (or Ctrl+Enter) to evaluate it in F# Interactive and see the results immediately.
The one thing to be careful about is that you need to load all dependencies first, so in this example, you first need to evaluate the contents of the first snippet (with #load, open, and let wb = ...), and then you can evaluate the two commands from the above snippets to see the results. Now, let’s see how we can combine the World Bank data with another data source.
Calling the Open Weather Map REST API
For most data sources, because F# does not have a specialized type provider like for the World Bank, we need to call a REST API that returns data as JSON or XML.
Working with JSON or XML data in most statically typed languages is not very elegant. You either have to access fields by name and write obj.GetField<int>("id"), or you have to define a class that corresponds to the JSON object and then use a reflection-based library that loads data into that class. In any case, there is a lot of boilerplate code involved!
Dynamically typed languages like JavaScript just let you write obj.id, but the downside is that you lose all compile-time checking. Is it possible to get the simplicity of dynamically typed languages, but with the static checking of statically typed languages? As you’ll see in this section, the answer is yes!
To get the weather forecast, we’ll use the Open Weather Map service. It provides a daily weather forecast endpoint that returns weather information based on a city name. For example, if we request http://api.openweathermap.org/data/2.5/forecast/daily?q=Cambridge, we get a JSON document that contains the following information. I omitted some of the information and included the forecast just for two days, but it shows the structure:
{ "city":
   { "id": 2653941,
     "name": "Cambridge",
     "coord": { "lon": 0.11667, "lat": 52.200001 },
     "country": "GB" },
  "list":
   [ { "dt": 1439380800,
       "temp": { "min": 14.12, "max": 15.04 } },
     { "dt": 1439467200,
       "temp": { "min": 15.71, "max": 22.44 } } ] }
As mentioned before, we could parse the JSON and then write something like json.GetField("list").AsList() to access the list with temperatures, but we can do much better than that with type providers.
The F# Data library comes with JsonProvider, which is a parameterized type provider that takes a sample JSON. It infers the type of the sample document and generates a type that can be used for working with documents that have the same structure. The sample can be specified as a URL, so we can get a type for calling the weather forecast endpoint as follows:
type Weather = JsonProvider<"http://api.openweathermap
  .org/data/2.5/forecast/daily?units=metric&q=Prague">
Warning
Because of the width limitations, we have to split the URL into multiple lines in the report. This won’t actually work, so make sure to keep the sample URL on a single line when typing the code!
The parameter of a type provider has to be a constant. In order to generate the Weather type, the F# compiler needs to be able to get the value of the parameter at compile-time without running any code. This is also the reason why we are not allowed to use string concatenation with a + here, because that would be an expression, albeit a simple one, rather than a constant.
Now that we have the Weather type, let’s see how we can use it:
let w = Weather.GetSample()
printfn "%s" w.City.Country
for day in w.List do
  printfn "%f" day.Temp.Max
The first line calls the GetSample method to obtain the forecast using the sample URL—in our case, the temperature in Prague in metric units. We then use the F# printfn function to output the country (just to check that we got the correct city!) and a for loop to iterate over the seven days that the forecast service returns.
As with the World Bank type provider, you get auto-completion when accessing. For example, if you type day.Temp and ., you will see that the service the returns forecasted temperature for morning, day, evening, and night, as well as maximal and minimal temperatures during the day. This is because Weather is a type provided based on the sample JSON document that we specified.
Tip
When you use the JSON type provider to call a REST-based service, you do not even need to look at the documentation or sample response. The type provider brings this directly into your editor.
In this example, we use GetSample to request the weather forecast based on the sample URL, which has to be constant. But we can also use the Weather type to get data for other cities. The following snippet defines a getTomorrowTemp function that returns the maximal temperature for tomorrow:
let baseUrl = "http://api.openweathermap.org/data/2.5"
let forecastUrl = baseUrl + "/forecast/daily?units=metric&q="

let getTomorrowTemp place =
  let w = Weather.Load(forecastUrl + place)
  let tomorrow = Seq.head w.List
  tomorrow.Temp.Max

getTomorrowTemp "Prague"
getTomorrowTemp "Cambridge,UK"
The Open Weather Map returns the JSON document with the same structure for all cities. This means that we can use the Load method to load data from a different URL, because it will still have the same properties. Once we have the document, we call Seq.head to get the forecast for the first day in the list.
As mentioned before, F# is statically typed, but we did not have to write any type annotations for the getTomorrowTemp function. That’s because the F# compiler is smart enough to infer that place has to be a string (because we are appending it to another string) and that the result is float (because the type provider infers that based on the values for the max field in the sample JSON document).
A common question is, what happens when the schema of the returned JSON changes? For example, what if the service stops returning the Max temperature as part of the forecast? If you specify the sample via a live URL (like we did here), then your code will no longer compile. The JSON type provider will generate type based on the response returned by the latest version of the API, and the type will not expose the Max member. This is a good thing though, because we will catch the error during development and not later at runtime.
If you use type providers in a compiled and deployed code and the schema changes, then the behavior is the same as with any other data access technology—you’ll get a runtime exception that you have to handle. Finally, it is worth noting that you can also pass a local file as a sample, which is useful when you’re working offline.
Plotting Temperatures Around the World
Now that we’ve seen how to use the World Bank type provider to get information about countries and the JSON type provider to get the weather forecast, we can combine the two and visualize the temperatures around the world!
To do this, we iterate over all the countries in the world and call getTomorrowTemp to get the maximal temperature in the capital cities:
let worldTemps =
  [ for c in wb.Countries ->
      let place = c.CapitalCity + "," + c.Name
      printfn "Getting temperature in: %s" place
      c.Name, getTomorrowTemp place ]
If you are new to F#, there is a number of new constructs in this snippet:
[ for .. in .. -> .. ]is a list expression that generates a list of values. For every item in the input sequencewb.Countries, we return one element of the resulting list.c.Name, getTomorrowTemp placecreates a pair with two elements. The first is the name of the country and the second is the temperature in the capital.- We use
printfin the list expression to print the place that we are processing. Downloading all data takes a bit of time, so this is useful for tracking progress.
To better understand the code, you can look at the type of the worldTemps value that we are defining. This is printed in F# Interactive when you run the code, and most F# editors also show a tooltip when you place the mouse pointer over the identifier. The type of the value is (string * float) list, which means that we get a list of pairs with two elements: the first is a string (country name) and the second is a floating-point number (temperature).5
After you run the code and download the temperatures, you’re ready to plot the temperatures on a map. To do this, we use the XPlot library, which is a lightweight F# wrapper for Google Charts:
open XPlot.GoogleCharts
Chart.Geo(worldTemps)
The Chart.Geo function expects a collection of pairs where the first element is a country name or country code and the second element is the value, so we can directly call this with worldTemps as an argument. When you select the second line and run it in F# Interactive, XPlot creates the chart and opens it in your default web browser.
To make the chart nicer, we’ll need to use the F# pipeline operator |>. The operator lets you use the fluent programming style when applying a chain of operations or transformations. Rather than calling Chart.Geo with worldTemps as an argument, we can get the data and pass it to the charting function as worldTemps |> Chart.Geo.
Under the cover, the |> operator is very simple. It takes a value on the left, a function on the right, and calls the function with the value as an argument. So, v |> f is just shorthand for f v. This becomes more useful when we need to apply a number of operations, because we can write g (f v) as v |> f |> g.
The following snippet creates a ColorAxis object to specify how to map temperatures to colors (for more information on the options, see the XPlot documentation). Note that XPlot accepts parameters as .NET arrays, so we use the notation [| .. |] rather than using a plain list expression written as [ .. ]:
let colors = [| "#80E000";"#E0C000";"#E07B00";"#E02800" |]
let values = [| 0;+15;+30;+45 |]
let axis = ColorAxis(values=values, colors=colors)

worldTemps
|> Chart.Geo
|> Chart.WithOptions(Options(colorAxis=axis))
|> Chart.WithLabel "Temp"
The Chart.Geo function returns a chart object. The various Chart.With functions then transform the chart object. We use WithOptions to set the color axis and WithLabel to specify the label for the values. Thanks to the static typing, you can explore the various available options using code completion in your editor.
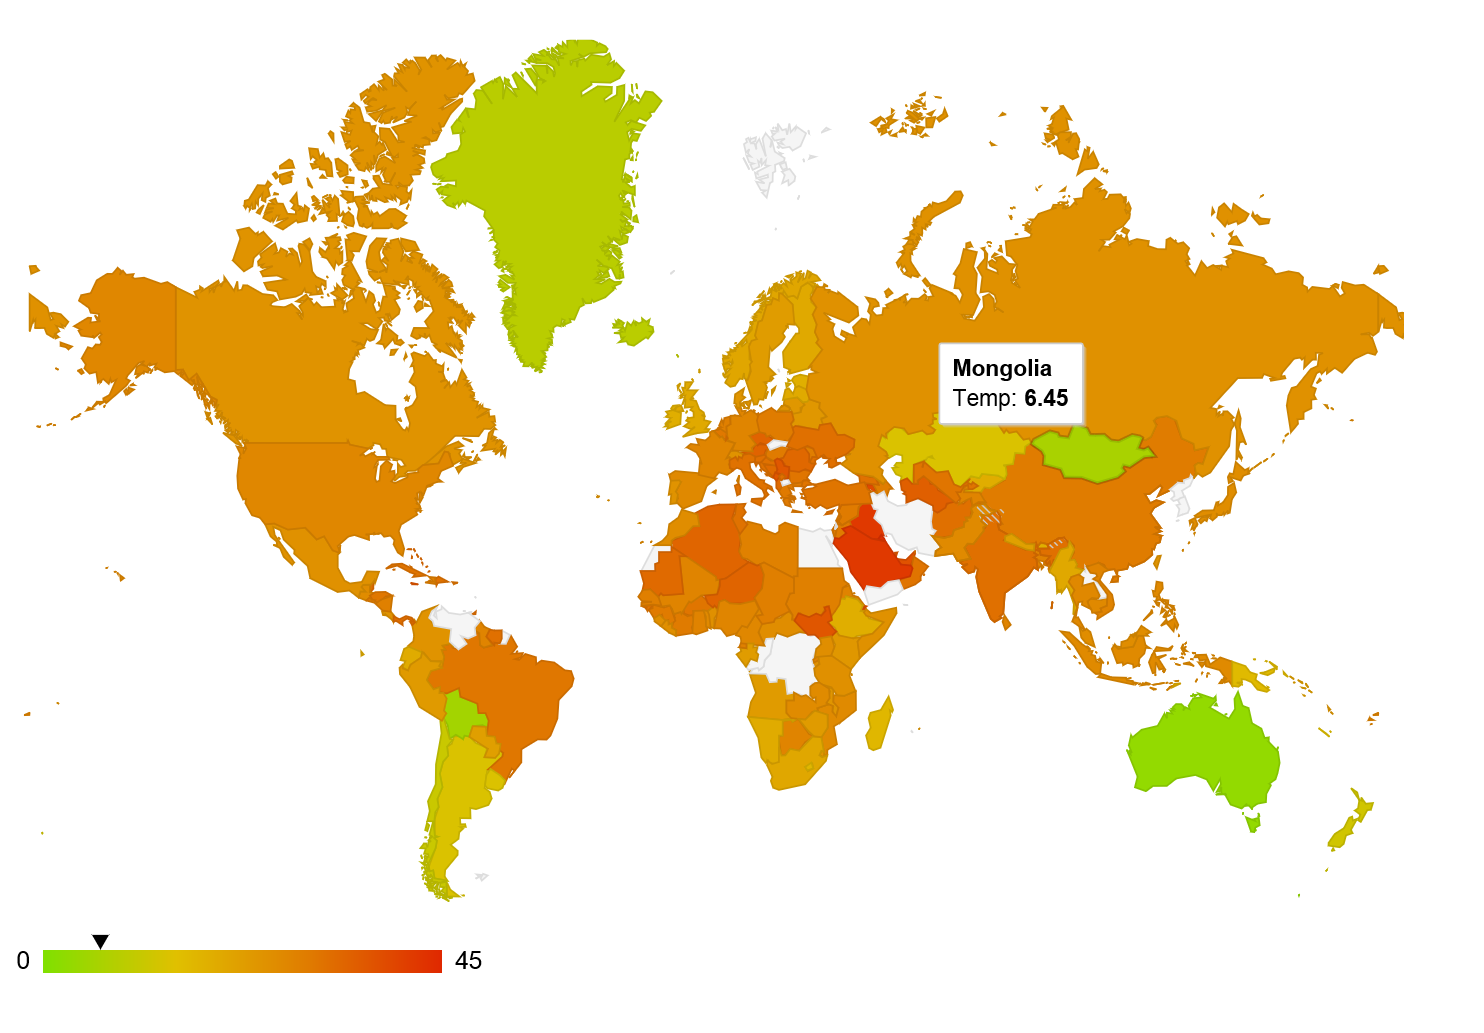
The resulting chart should look like the one in Figure 1-2. Just be careful, if you are running the code in the winter, you might need to tweak the scale!
Conclusions
The example in this chapter focused on the access part of the data science workflow. In most languages, this is typically the most frustrating part of the access, analyze, visualize loop. In F#, type providers come to the rescue!
As you could see in this chapter, type providers make data access simpler in a number of ways. Type providers integrate external data sources directly into the language, and you can explore external data inside your editor. You could see this with the specialized World Bank type provider (where you can choose countries and indicators in the completion list), and also with the general-purpose JSON type provider (which maps JSON object fields into F# types). However, type providers are not useful only for data access. As we’ll see in the next chapter, they can also be useful for calling external non-F# libraries.
To build the visualization in this chapter, we needed to write just a couple of lines of F# code. In the next chapter, we download larger amounts of data using the World Bank REST service and preprocess it to get ready for the simple clustering algorithm implemented in Implementing Machine Learning Algorithms.
1Hollerith’s company later merged with three other companies to form a company that was renamed International Business Machines Corporation (IBM) in 1924. You can find more about Hollerith’s machines in Mark Priestley’s excellent book, A Science of Operations (Springer).
2The World Bank is an international organization that provides loans to developing countries. To do so effectively, it also collects large numbers of development and financial indicators that are available through a REST API at http://data.worldbank.org/.
3See http://openweathermap.org/.
4See http://fslab.org/FSharp.Data.
5If you are coming from a C# background, you can also read this as List<Tuple<string, float>>.