
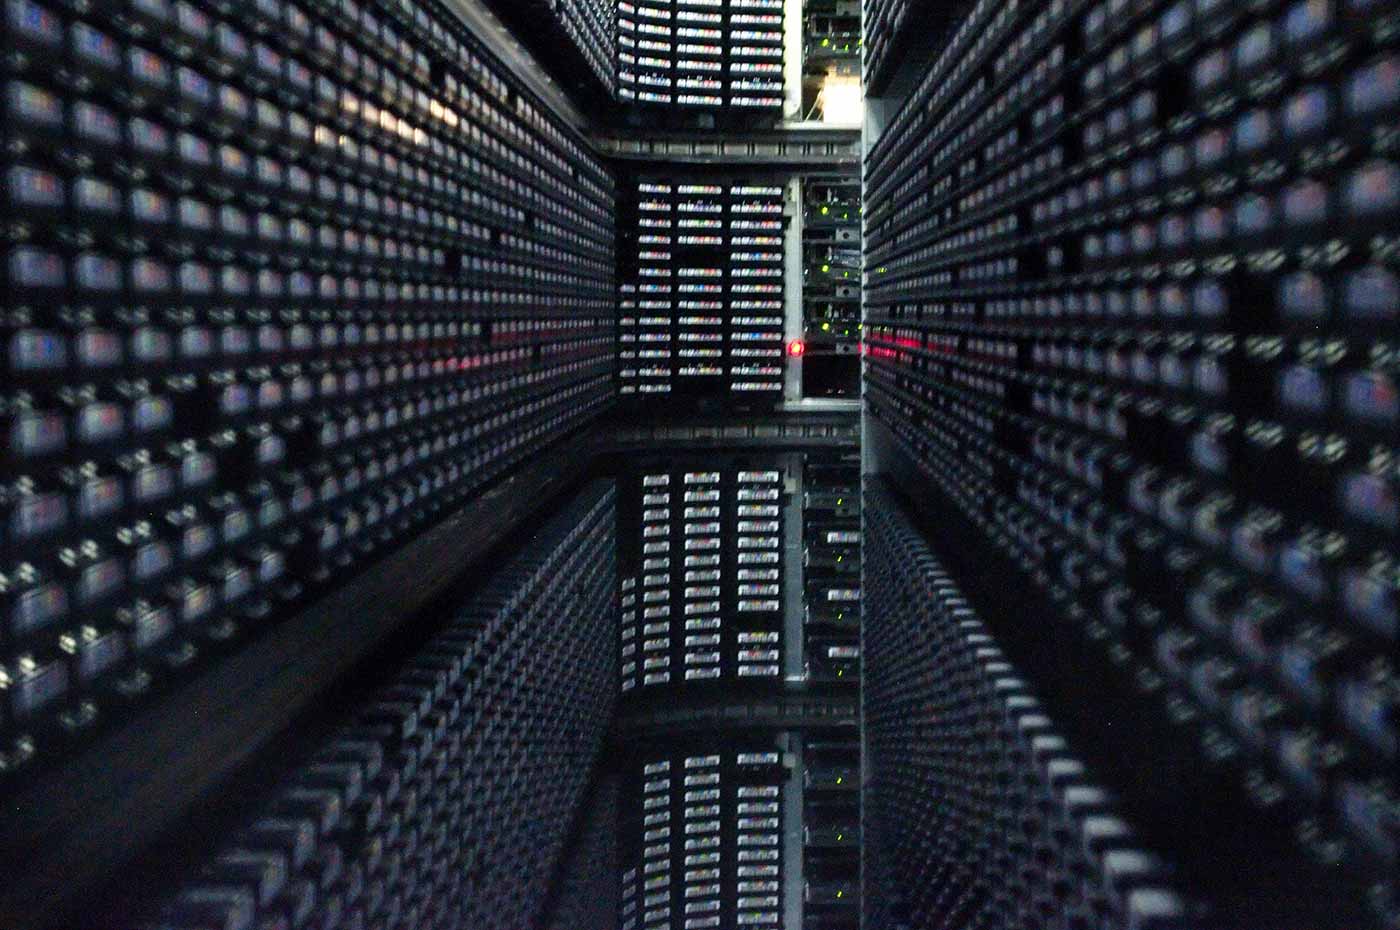
 Interior of StorageTek tape library at NERSC. (source: By Derrick Coetzee on Wikimedia Commons.)
 I lead the Data and Analytics group at National Energy Research Scientific Computing Center (NERSC), Lawrence Berkeley National Lab’s supercomputing center. In this role, I track the frontier of scientific problems that require big data analytics solutions. More than 6,000 users employ NERSC’s supercomputing platforms to tackle problems across the sciences, ranging in scale from astronomical to organismal, from molecular all the way down to subatomic physics. Typical data set sizes range from 100 gigabytes to petabytes.
While NERSC has state-of-the-art computational and storage resources to handle the logistics, the real challenge is in determining scalable analytics methods and software frameworks. In this post, my science collaborators and I have commented on the top problems in scientific data analytics, with the hope of inviting the broader data science community to participate in their ongoing scientific research endeavors.
Problem 1: Creating a catalog of all objects in the universe
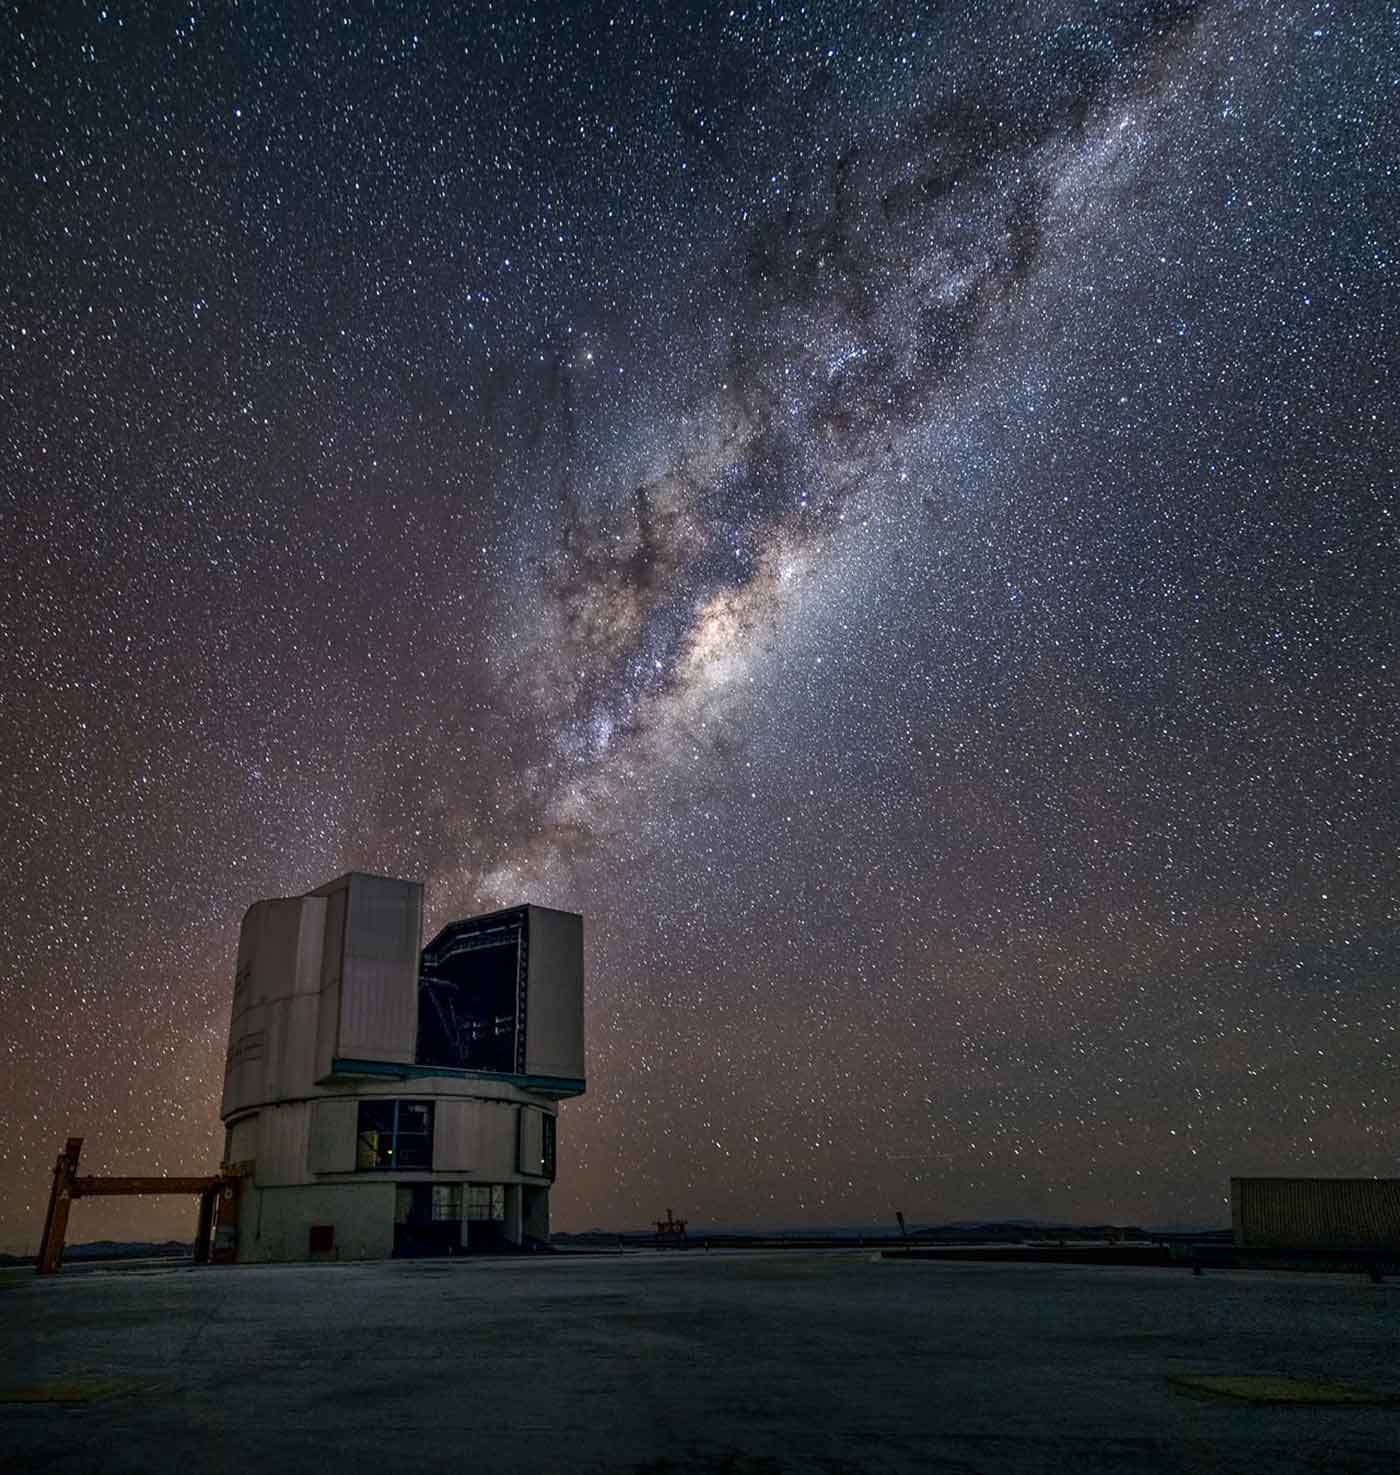
Each day, telescopes around the world collect image data sets in the form of “sky surveys.” These data sets contain valuable information about the location and structure of a large number of objects in the universe, including stars, galaxies, and quasars. Unfortunately, these data sets are not easy to access or share among scientists.
A collaboration of astrophysicists, statisticians, and computer scientists at Lawrence Berkeley National Laboratory are developing a new, fully generative model of the universe — termed Celeste — that seeks to solve what they believe to be the largest graphical model problem in science. Using stochastic variational inference (a highly scalable algorithm) and distributed MCMC inference for large graphical models, the Celeste project aims to create a unified catalog of all celestial bodies in the visible universe. This means inferring O(100B) parameters from some 500 terabytes of image data, or about one trillion pixels.
Primary collaborators: David Schlegel (LBNL), Jon McAuliffe (UC Berkeley), and Ryan Adams (Harvard).
Problem 2: Determining the fundamental constants of cosmology
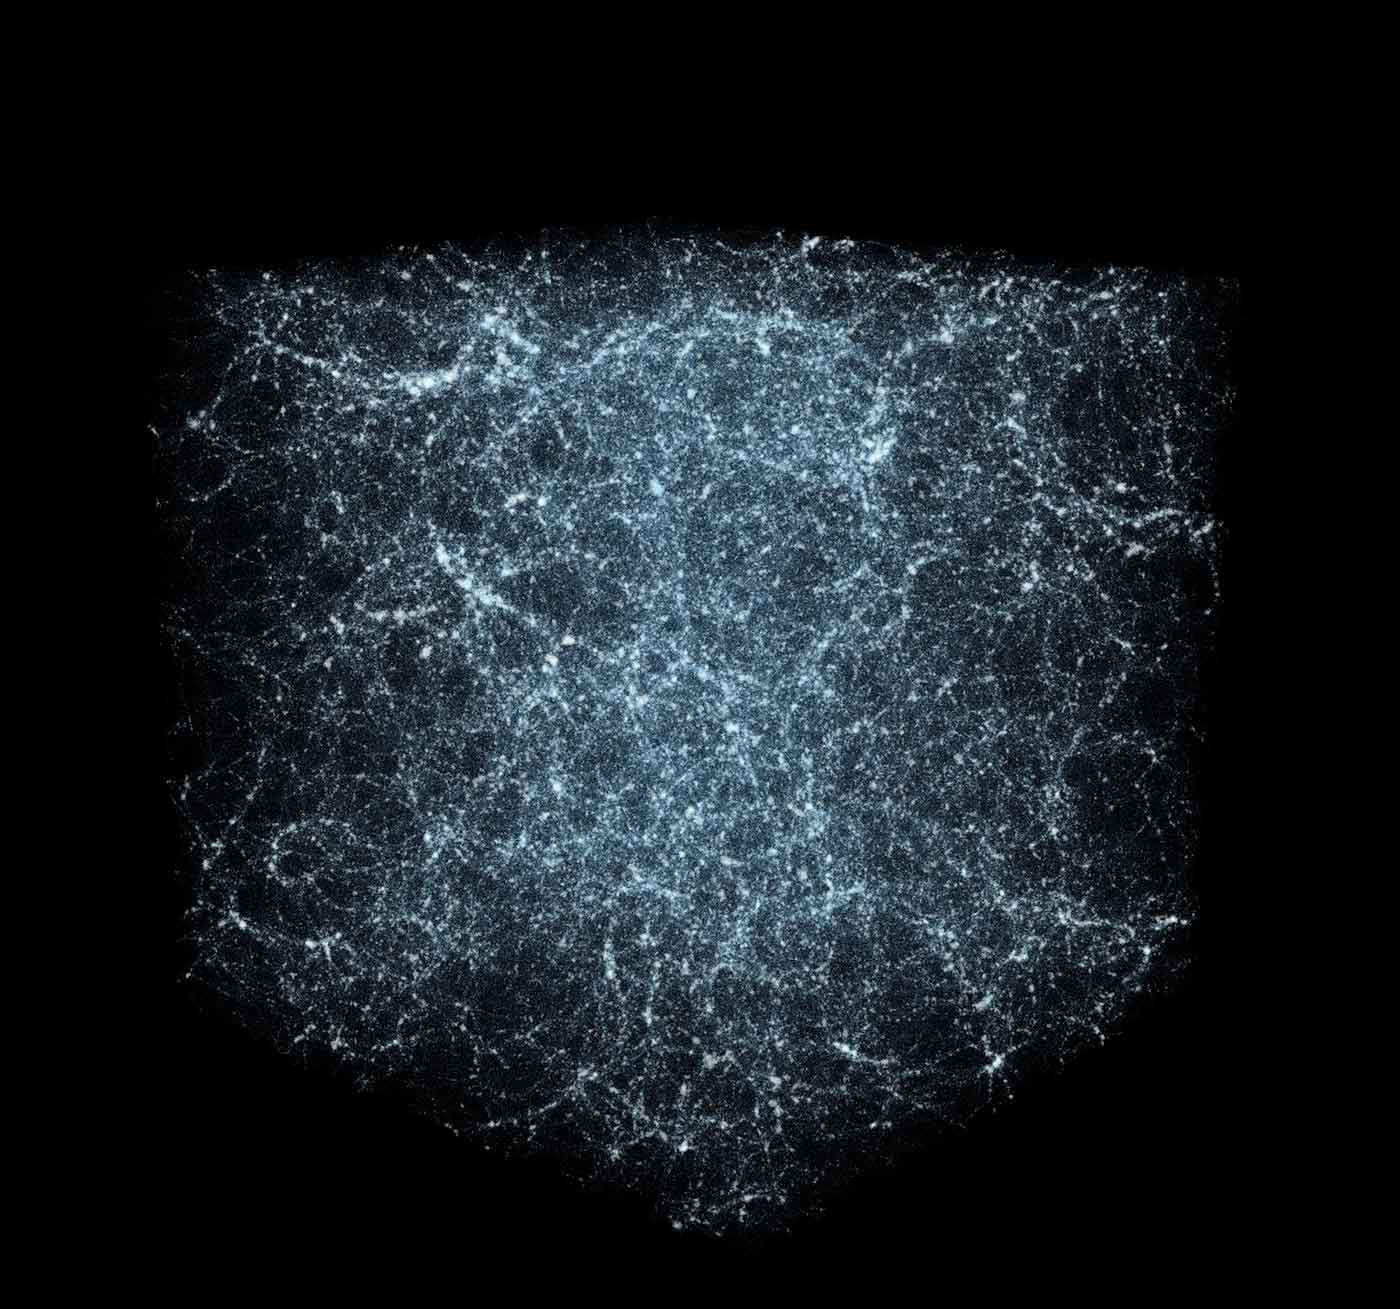
The structure of matter in the universe today has been influenced since the Big Bang by the attractive force of gravity pulling matter together, and the expansive “negative pressure” of dark energy. In order to understand what the universe is made of (i.e., how much matter is there, and what does dark energy consist of), cosmologists study the distribution of galaxies seen through astronomical surveys of the sky. Their observations are then compared to predictions made with theoretical simulations involving trillions of particles. But, herein lies an analytics problem: with data set sizes ranging from 30-300 terabytes, the statistics used to characterize the structure of matter are computationally intensive to calculate — they include galaxy clustering, 2-pt correlation computation, and 3-pt correlation computation.
Recently, we have developed the BD-CATS system — a highly scalable version of the data clustering algorithm DBSCAN — to cluster trillion-particle data sets at full scale on supercomputing platforms. BD-CATS is helping interpret the mechanisms behind particle acceleration in plasma physics (the study of charged particles and fluids interacting with electric and magnetic fields), and holds promise for qualitatively superior clustering in cosmology.
Primary collaborators: Debbie Bard (LBNL), Zarija Lukic (LBNL), Mostofa Patwary (Intel)
Problem 3: Characterizing extreme weather in a changing climate

The problem of climate change is one of the most pressing issues for humanity. At NERSC, we are interested in learning about the various ways that global warming might affect climate in the future — beyond an increase in mean sea level and global mean temperatures. We are also interested in examining whether there will be a change in the statistics of extreme weather events, such as hurricanes, in the future: do we expect hurricanes to become weaker or stronger? Do we expect Category 4 and 5 hurricanes to make landfall more often? A grand challenge problem in climate data analytics involves causal inference: can we identify anomalous events and causally connect them to mechanisms? How are such mechanisms going to vary in the future?
Recognizing extreme weather patterns by analyzing large data sets is similar to activity detection in video data, except that we need to process a million grid points, with dozens of variables at each point. Approaching such a challenge requires that we develop highly scalable pattern-detection capabilities that can mine massive spatiotemporal data sets, on the order of 100 terabytes to 1 petabyte. We have successfully employed the MapReduce framework (as implemented in the Toolkit for Extreme Climate Analysis) and are actively exploring the use of deep learning to tackle this problem.
Primary collaborators: Prabhat (LBNL), Michael Wehner (LBNL), William D. Collins (LBNL)
Problem 4: Extracting knowledge from scientific literature
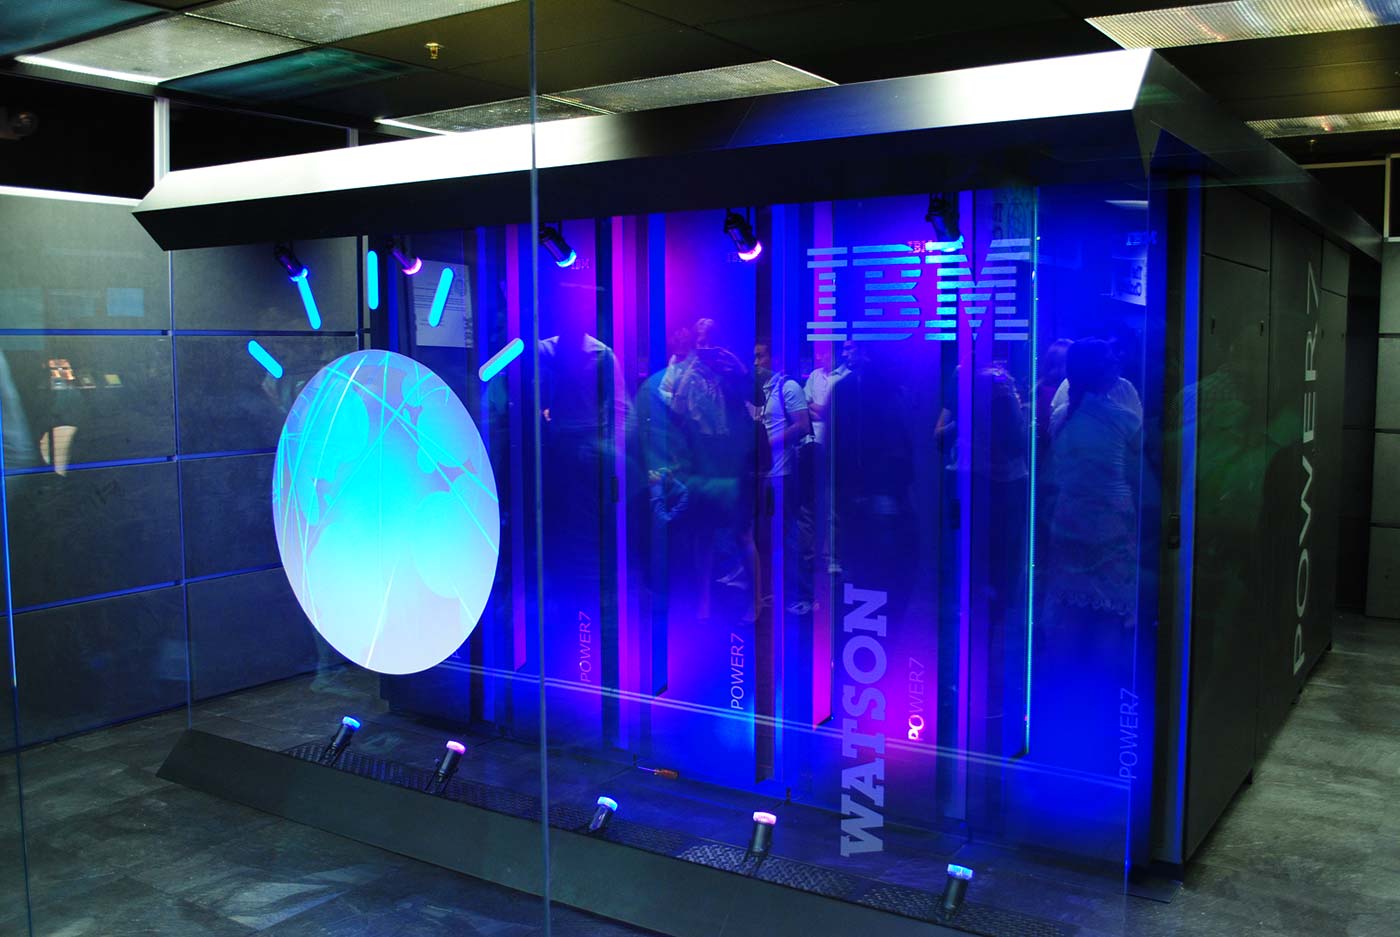
In the age of the Internet, it has become trivial for us to publish, communicate, and share results instantaneously. However, easy access to vast quantities of information presents some unique problems: it has become unmanageable for individuals to keep track of the latest developments in both general disciplines in science as well as specialized topics. Furthermore, all sources of information are not equally trustworthy; we need to consider both the quantity and quality of information before reaching important conclusions. Lastly, there is a dire need in the scientific community to automatically organize, mine, and assess the quality of scientific literature.
The analytics challenges associated with this problem are largely related to processing unstructured data found in publications: text, tables, charts, images, schematics, equations, and references. Every scientific domain has a taxonomy of conventions that may or may not be codified. Key challenges, therefore, include extracting scientific entities of interest (such as diseases or treatments) from publications, establishing relationships between entities in the form of a knowledge graph, and weighting both facts and relationships based on multiple lines of evidence. Finally, supporting fluent Q&A capabilities of the knowledge graph with responses that have a confidence value and associated line of reasoning will be critical to improving the productivity of the broader scientific community. A number of promising technologies are being developed at present: the IBM Watson system celebrated a widely publicized victory over a human expert in the Jeopardy! contest, and the DeepDive data management system being developed at Stanford appears to show promising results for a few scientific disciplines. Further customization of these, and similar, technologies to an array of scientific disciplines is the need of the hour.
Primary collaborators: Adam Arkin (LBNL), Anubhav Jain (LBNL), Prabhat (LBNL)
Problem 5: Investigating cortical mechanisms of speech production
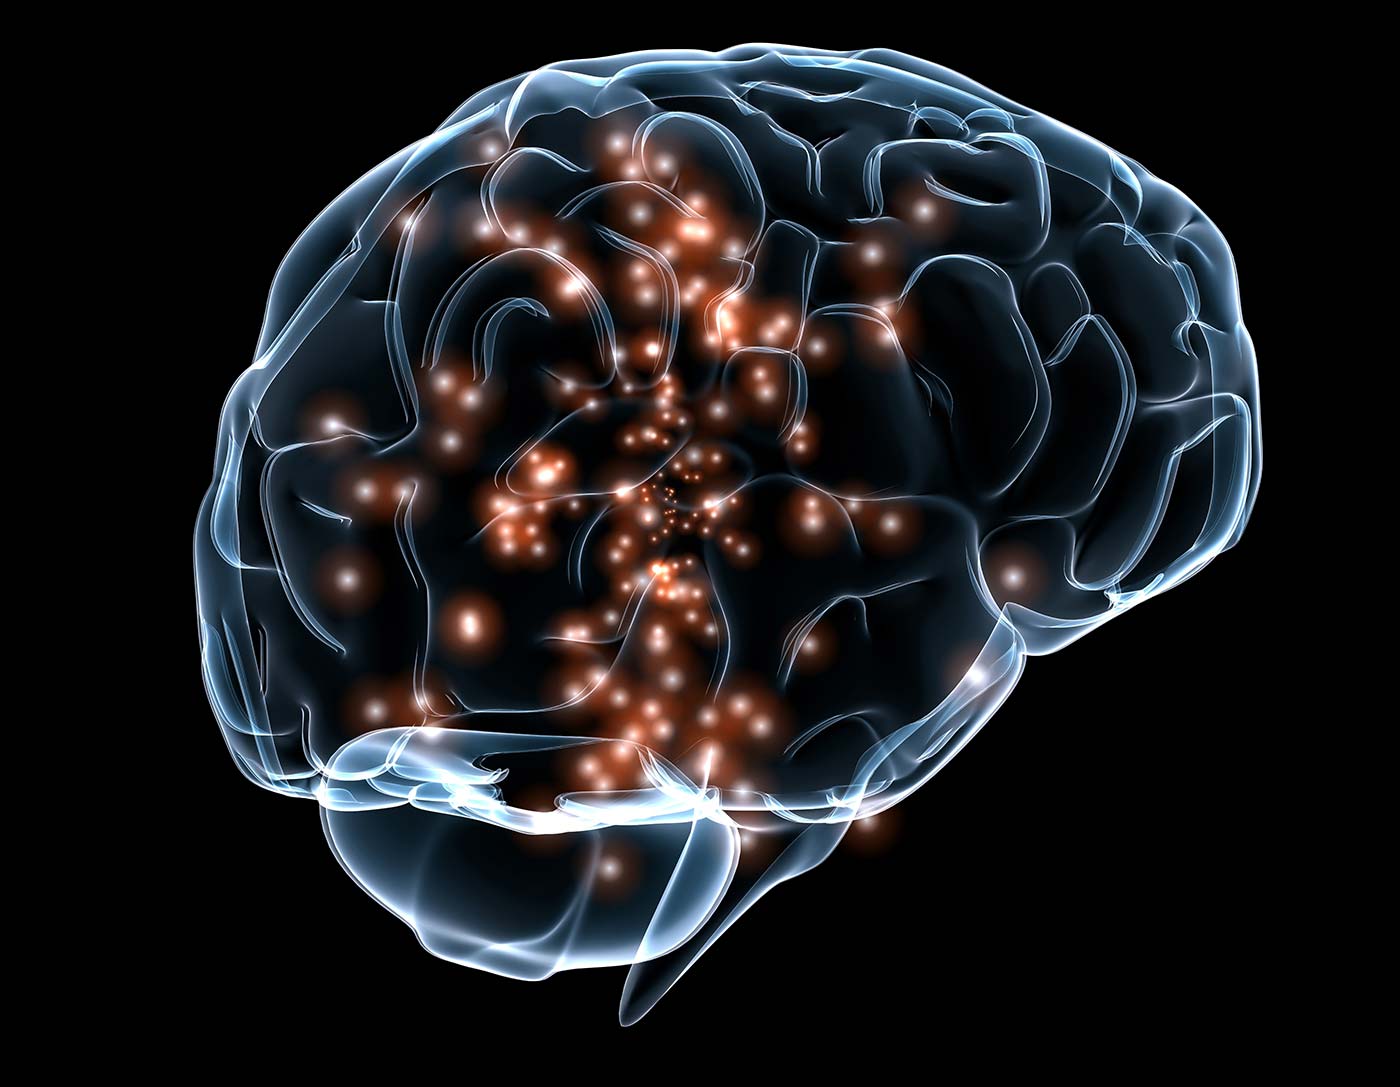
For decades, mankind has struggled to understand how neural activity in the human brain gives rise to the seemingly effortless production of speech. What is the functional organization of brain computations for speech production? How do functionally distinct areas of the brain communicate with each other to give rise to the coordinated patterns of movement generating speech? What are the interactions between language composition and speech articulation at the cortical level? Furthering understanding of this unique human capacity is critical for developing vocal prosthetics to restore the power of speech for those who have lost it.
Understanding the cortical processes that produce speech requires recording neural activity with high spatial and temporal resolution over large areas of cortex. Recording this activity in humans can only be done with invasive electrocorticography techniques, making the data very rare. Our initial investigations aim to “translate” spatiotemporal patterns of brain activity into intended continuous speech. The data, however, has long-term temporal dependencies, substantial noise, and is limited in its number of samples. The current data set size is around 10 gigabytes. Furthermore, combining data across multiple speakers is challenging, but critical for ultimate success.
Our use of deep neural networks has yielded state-of-the-art results in the classification of 57 consonant-vowel syllables from the sensorimotor cortex, and we are investigating recurrent networks for a hybrid continuous-categorical system. For eventual deployment as a vocal prosthetic device for humans, the computing infrastructure for neural analysis of speech must be real-time and ultra low-power.
Primary collaborators: Kris Bouchard (LBNL), Edward Chang (UCSF), Peter Denes (LBNL)
Problem 6: Implementing Google Maps for bioimaging
_and_a_dead_Human_neutrophil_-_NIAID.jpg)
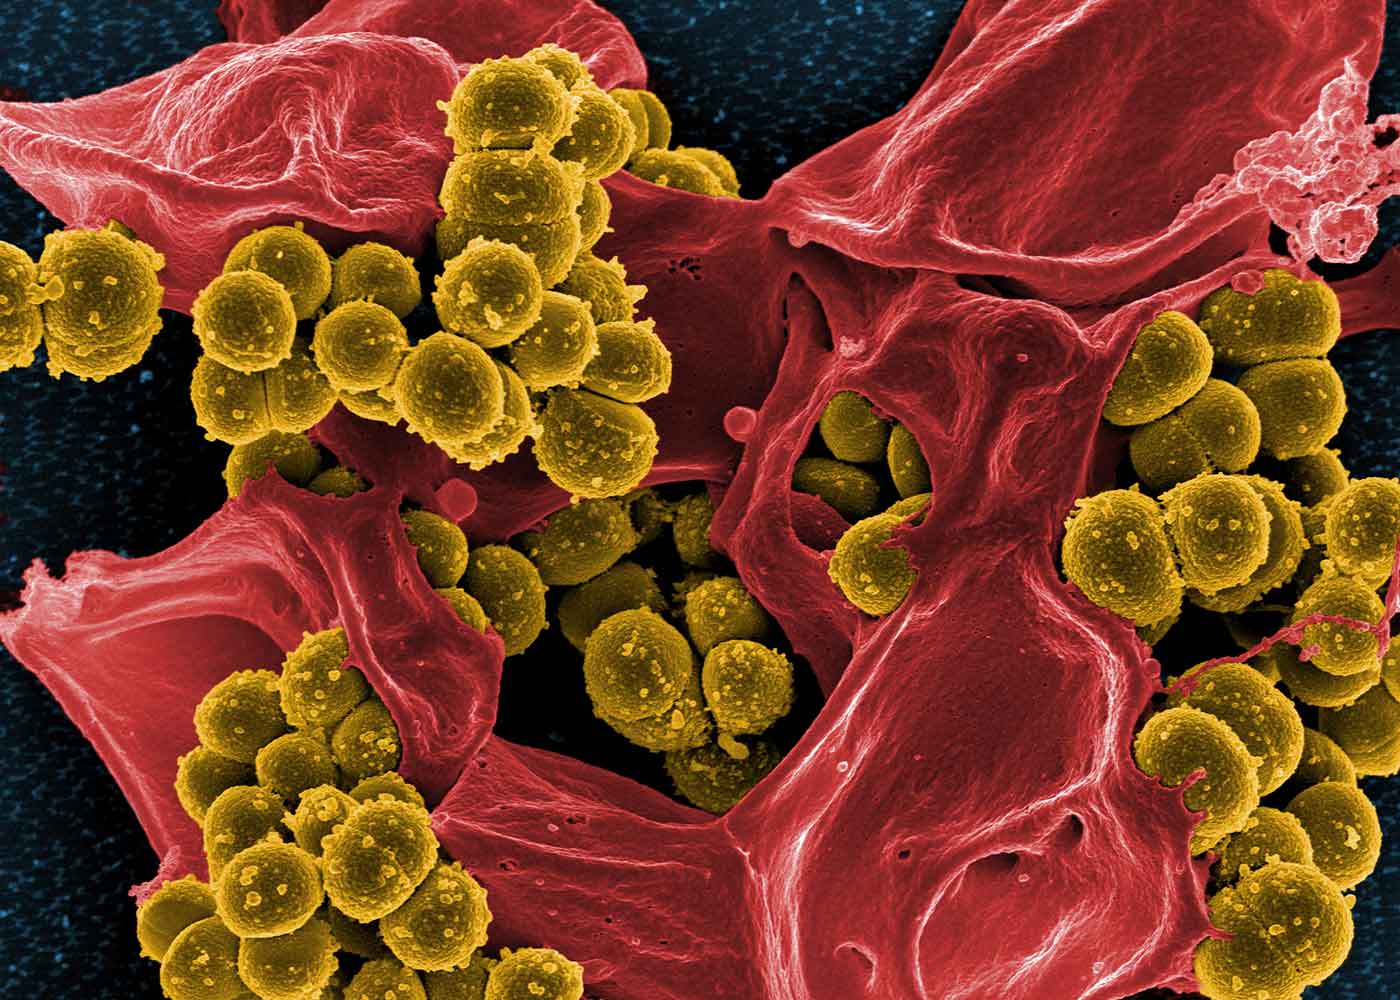
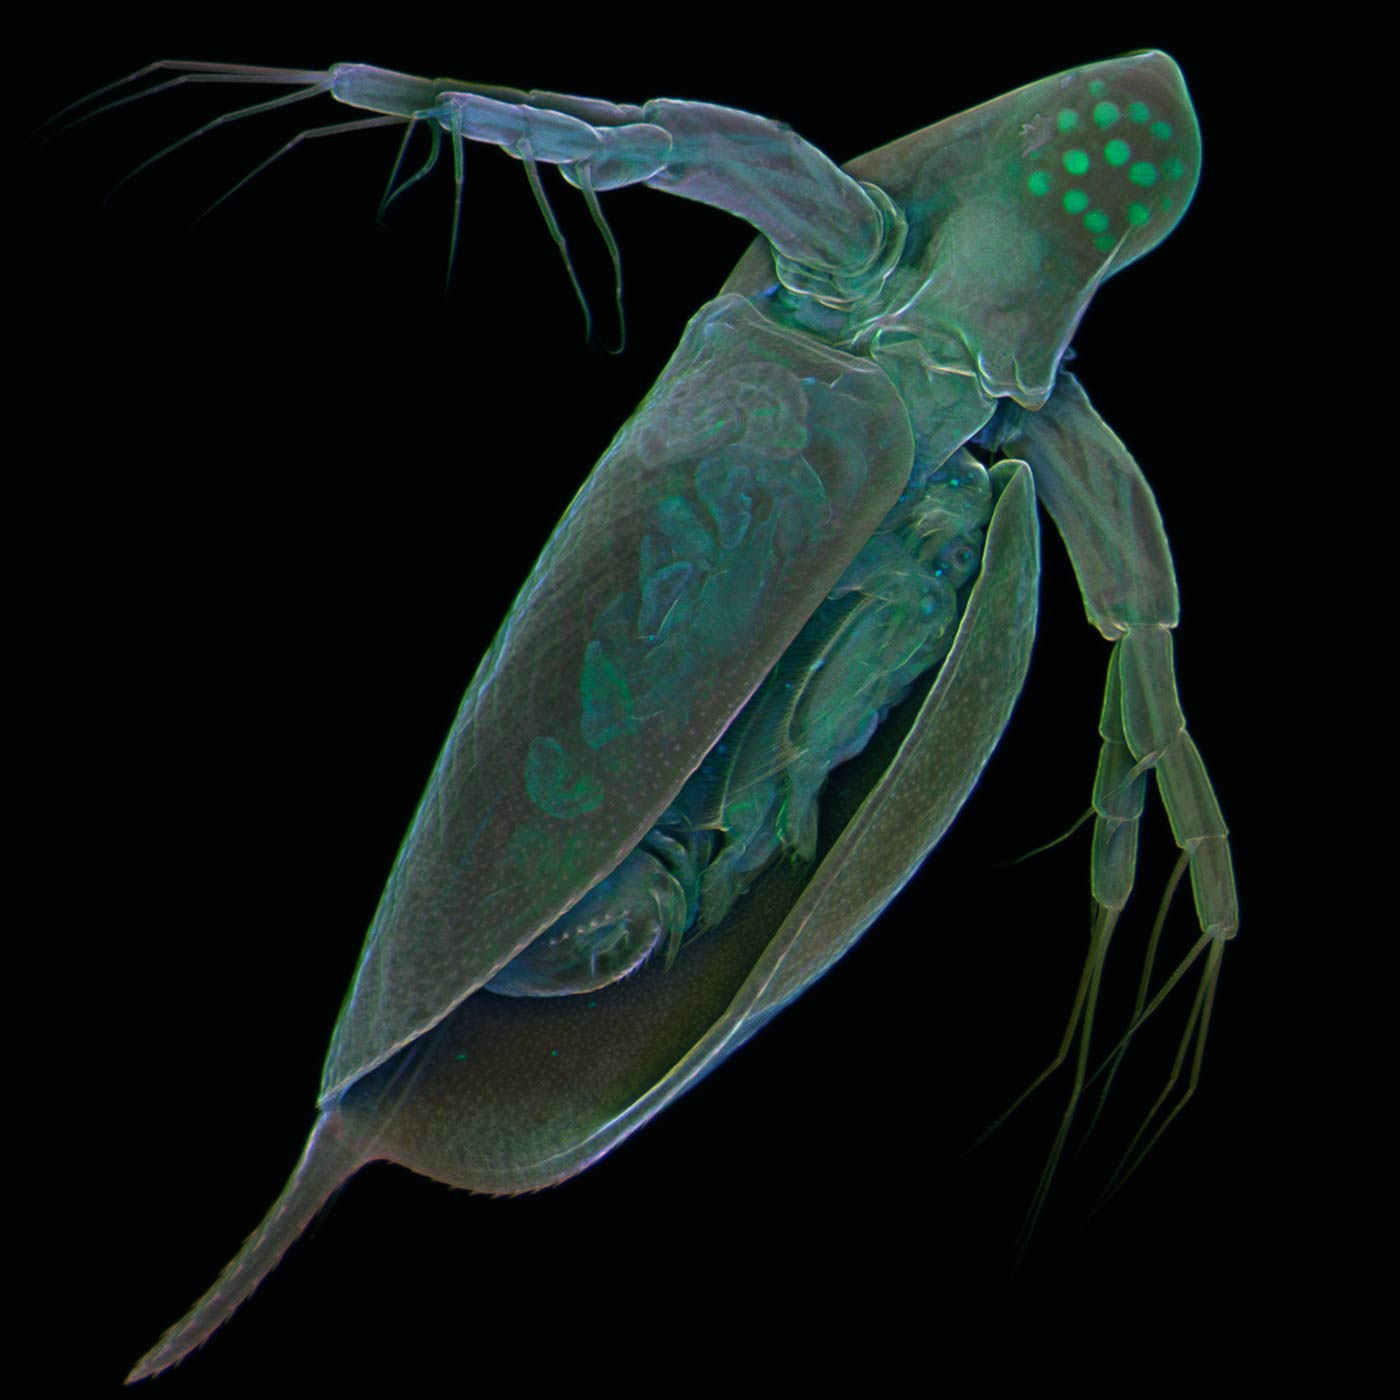
Life is organized and sustained in a multiscale manner — from individual proteins to organelles, cells, and microbial communities to tissues and organs to organisms. Capturing data from this gigantic range in scale, from macroscopic and mesoscopic to microscopic and nanoscopic, requires multimodal imaging. However, no single imaging technique can capture the entire range. Further, each technique provides somewhat complementary data at different length and time scales, and at different resolution.
Data analytics challenges for this particular issue include development of segmentation techniques, classification of biological entities, and implementing a map-centered database in which to perform quantitative analysis. The ultimate goals in this line of work are to integrate all of this spatiotemporal information (a data set size of about 100 gigabytes to 1 terabyte) in a common coordinate system, to obtain statistically significant quantitative geo-volumetric information (such as computing the volume or surface area of a shape), and to classify the biological entities in a visual database that can be queried for patterns of such geo-volumetric information. This would allow biologists to use quantitative information to differentiate a variety of developmental and/or disease states through signature 3D architecture, molecular/metabolic composition, and/or localization of key macromolecular components such as proteins.
Primary collaborator: Manfred Auer (LBNL), Joaquin Correa (LBNL)
Problem 7: Performing extreme-scale genome assembly

De novo genome assembly is one of the most important computations in modern genomics. The process involves transforming short, randomly sampled “shotgun” genomic sequences into a contiguous and accurate reconstruction of complex genomes. Re-assembling complex genomes requires enormous amounts of sequencing data. As such, de novo assembly has been unable to keep pace with the flood of data (around 1-10 terabytes), due to vast computational requirements and the algorithmic complexity of assembling large-scale genomes and metagenomes. For example, the highly repetitive genome of bread wheat is five times larger than that of humans, so it is especially challenging to assemble and map, combining complexity with scale.
In de novo genome assembly, the initial processing and data reduction (k-mer analysis) is bandwidth-bound, the subsequent construction and traversal of the de Bruijn graph are latency-bound, and the sequence alignment is compute-bound. Many of the graph processing techniques developed for low-diameter graphs are not applicable to de Bruijn graphs, which have a very low degree and a high diameter. We address this challenge via HipMer, a high-performance, end-to-end assembler designed to simplify and speed up the process of genome assembly and mapping by parallelizing the code to run simultaneously across many clusters of a supercomputer. A process that previously took months, such as assembling the entire human genome, can now be achieved in about eight minutes.
Primary collaborators: Evangelos Georganas (UC Berkeley), Aydin Buluc (LBNL), Dan Rokhsar (UC Berkeley), Kathy Yelick (LBNL)
Problem 8: Adopting precision toxicology
Roughly 80% of new drugs fail due to unanticipated toxicity in humans. And more than 500 fundamentally new industrial chemicals are developed each year, most of which will receive no toxicological testing of any kind. Toxicology, the principle science that we rely on to protect us from cancer, birth defects, cardiovascular and neurodegenerative disease, has not kept pace with innovation. Risk assessment still relies on a small collection of model species, takes more than five years, and costs more than $1.5 million per compound. Through risk assessment, we learn about the lethal dose, and in some cases about minimal doses, that causes disease. But we learn nothing about the mechanisms of toxicity.
We each have unique life histories, genetics, microbiomes, and physiologies that interact to produce our personal susceptibility and resilience to environmental challenges. Toxicants affect children in utero differently than adults, and drugs that are effective in one genetic background can be deadly at subtherapeutic doses in another.
While we cannot test every compound in every genetic background, or even every species that will ultimately be exposed, we can learn to impute toxicity profiles and the molecular consequences of exposure to toxicants via attainable, cost-effective data. We can learn the bases of individual susceptibility, and map our imputations across the entire tree of life. Leveraging the potential of bioscience to achieve precision toxicological testing will enable actuarial analysis and risk assessment during the earliest stages of product development, reducing wasted effort and expense.
This problem is fundamentally computational in nature, and it is a grand challenge for our society and our planet. Our principal approach to this challenge is Phylogenomic Toxicology (exposure biology in a multi-species setting): we test in a small cohort of tractable model organisms and then use tools of quantitative evolutionary biology — including new forms of tensor regression for multi-species analysis, quantum-computing-enabled pathway discovery, and deep learning- and random forest-based introspective learning machines — to make predictions in common ancestors and all extant species. This is done by mapping and exploiting structure in high-content data sets, of roughly 18 terabytes. In two years, we anticipate these data sets will grow in size to about 1 petabyte.
Primary collaborators: Ben Brown (LBNL), John Colbourne (University of Birmingham, UK) and the Consortium for Environmental Omics and Toxicology
Problem 9: Seeking designer materials

Technological innovation is largely driven by the discovery of new materials. We are often given a desired set of material properties (e.g., hardness, transparency, conductivity, voltage), with the challenge of discovering new materials that embody those properties. Today’s computer models can semi-reliably predict material properties, and databases compiling thousands of such predictions are available. For example, the Materials Project is an open-access database that has gathered information on tens of thousands of materials at NERSC. The next steps, though, are to analyze this large data set (around 100TB) to test and uncover new scientific principles that explain materials behavior, to represent complex data (e.g., periodic 3D crystals), and to reduce the time needed to discover and develop new materials to a fraction of what it is today — around two decades.
Automation of materials analysis will require that we solve two key problems: automated feature learning and high-dimensional regression. Once these issues are tackled, one can imagine an online system that will explore (in an adaptive fashion) selective portions of the material design space to identify the most promising materials worth simulating and fabricating.
Primary collaborators: Anubhav Jain (LBNL), Kristin Persson (LBNL)
Problem 10: Determining the fundamental constituents of matter
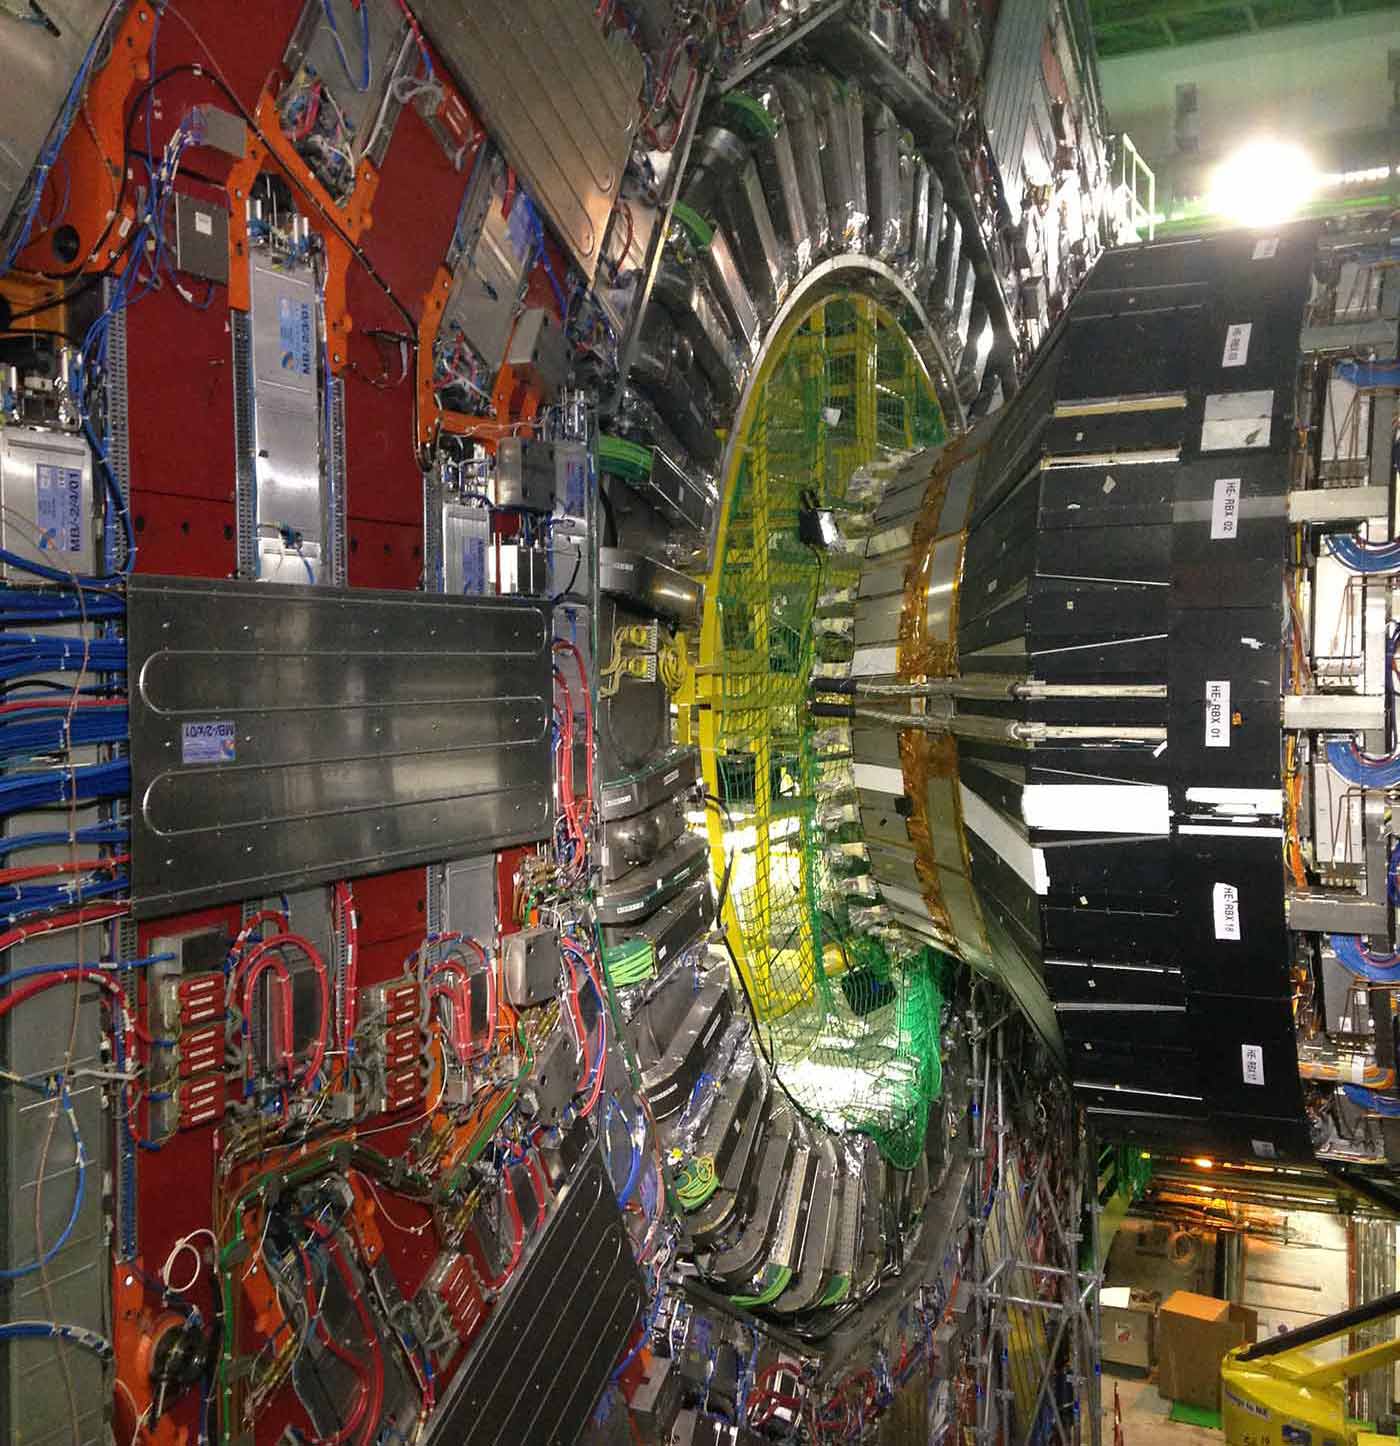
High-energy particle physics seeks to understand the secrets of the universe at the most fundamental, sub-atomic, level. While our understanding has vastly improved, culminating with the recent discovery of the Higgs Boson, we know there are many crucial mysteries still to be solved, such as the source of dark matter, and how gravity plays a role in the Theory of Everything. Exploring these mysteries requires the biggest and most complex instruments ever created. One such instrument is the Daya Bay Reactor Neutrino Experiment, which seeks to advance our knowledge of neutrinos — subatomic particles lacking an electrical charge that are produced by decaying radioactive elements. Another example is the Large Hadron Collider, which operates at the highest energies of any particle accelerator and aims to discover previously unseen particles and interactions.
These instruments employ pattern and anomaly detectors with billions of channels, collecting data at nano-second precision, leading to exabyte-scale data pipelines. With data set sizes ranging from hundreds of terabytes to hundreds of petabytes, fast and accurate analytics is essential. The field has employed “pattern detection” techniques for some time, but using them to classify physics events directly on the scale of “raw” data remains a challenge. We currently use deep neural networks to learn new high-level representations of the data. The transformed data is then used for fast data analysis, including visualization and characterization of signal and background sources.
Primary collaborators: Craig Tull (LBNL), Wahid Bhimji (LBNL), Peter Sadowski (UC Irvine)