Enabling data science for the majority
How human-in-the-loop data analytics is accelerating the discovery of insights.
 Gears (source: Pixabay)
As practitioners who build data science tools, we seem to have a rather myopic obsession with the challenges faced by the Googles, Amazons, and Facebooks of the world—companies with massive and mature data analytics ecosystems, supported by experienced systems engineers, and used by data scientists who are capable programmers. However, these companies represent a tiny fraction of the “big data” universe. It’s helpful to think of them as the “1% of big data”: the minority whose struggles are not often what the rest of the “big data” world faces. Yet, they occupy the majority of discourse around how to utilize the latest tools and technologies in the industry.
Big data problems for the majority
So what about the other “99%”—who are these organizations or individuals, and what problems do they face? The range of professionals who rely on big data include finance and business analysts, journalists, engineers, and consultants, just to name a few—all of whom likely have an interest in managing and extracting value from data.

Learn faster. Dig deeper. See farther.
Most of the problems that occur when trying to extract value from data ultimately stem from the humans who are “in-the-loop” of the data analysis process. In particular, as the size, number, and complexity of data sets have grown, what has not grown at a proportional rate is the amount of human time available, the number of humans with sophisticated analysis skills, as well as human cognitive load capabilities. This leads to a number of challenging data management problems.
The solutions to these problems are a new breed of intelligent tools that treat humans as first-class citizens, alongside data. These tools empower humans, regardless of programming skills, to extract value and insights from data. These tools, and many others like them, are defining a burgeoning sub-field of data management, one many of us are calling “HILDA”, short for “human-in-the-loop data analytics.”
In this post, I will discuss five key problems that stem from the “humans-in-the-loop.” For each of these problems, my research group at the University of Illinois, in collaboration with research groups at MIT, the University of Maryland, and the University of Chicago, has been developing open source HILDA tools, namely, DataSpread, Zenvisage, Datamaran, Orpheus, and Gestalt. I will describe these open source tools, along with others that I am aware of, that at least partially address these problems (which are far from solved!). I welcome any suggestions on problems that I missed, or on other work that similarly aims to address these problems.
The five key problems: A high-level view
The five key “human-in-the-loop” problems include:
-
The Excel problem: Over-reliance on spreadsheets
For many individuals, data analytics happens entirely within Excel or similar spreadsheet software. However, spreadsheet software is sluggish for large or complex spreadsheets, doesn’t scale beyond memory limits, and requires cumbersome mechanisms to express simple operations (e.g., joins). -
The exploration problem: Not knowing where to look
When operating on large data sets with many attributes, data scientists have trouble figuring out what to visualize, what the typical patterns or trends are, and where to find them. Often, exploration, even with tools like Tableau or Excel, is laborious and time-consuming. -
The data lake problem: Messy cesspools of data
Data scientists and organizations routinely accumulate machine-generated semi-structured data sets—it is hard to extract structured information from these data sets, as well as understand the relationships between them. Both of these steps are necessary before they can be put to use in analysis. -
The data versioning problem: Ad-hoc management of analysis
As data scientists analyze their data, they generate hundreds of data sets and source code versions, by repeatedly transforming and cleaning their data and applying machine learning algorithms. The data set versions are managed via ad-hoc mechanisms, with no clear understanding of the derivation relationships, hurting reproducibility and collaboration, as well as fostering redundancies and errors. -
The learning problem: Hurdles in leveraging machine learning
While machine learning is hugely beneficial in identifying patterns and making predictions with data, it is a pain to deploy, especially at scale, without a substantial amount of programming work to connect relevant tools. It also requires manual work to tune and iterate on machine learning algorithms—placing it beyond the reach of many business users who need to interact with data.
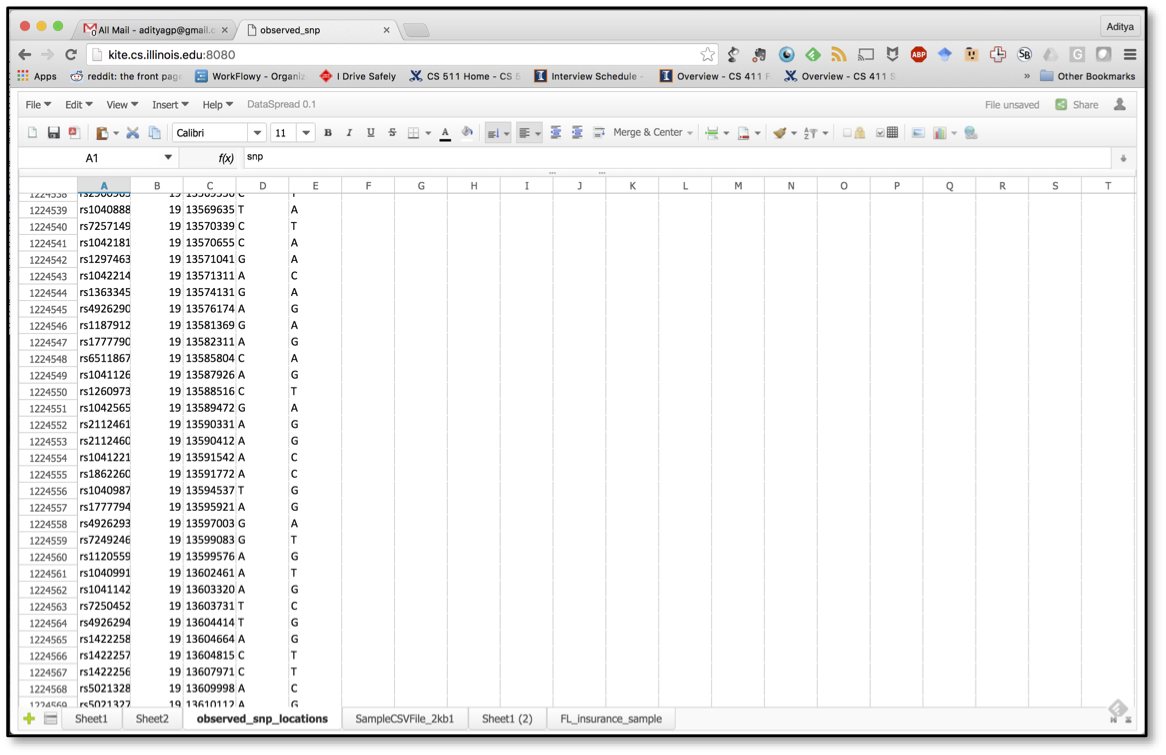
The Excel problem
For many people working with data, analytics begins and ends with Microsoft Excel. Unfortunately, Microsoft Excel is extremely sluggish when dealing with large spreadsheets or spreadsheets with many formulae. I’ve worked with spreadsheets with a few hundred thousand cells, for example, where scrolling takes several seconds, and propagation of a single change takes minutes.
At the same time, due to the limited expressivity of formulae, spreadsheet users end up expressing relatively simple operations in complex ways (e.g., joins via VLOOKUPs), or resort to cumbersome mechanisms to analyze data (e.g., copy-pasting relevant data to a different area of the sheet to evaluate a filter expression.) The preponderance of formulae also encourages errors in spreadsheets—these errors have actually led to the retraction of biology, psychology and economics papers!
Related projects
DataSpread is a project aimed at combining the benefits of spreadsheets and databases, by keeping the familiar spreadsheet front end, while using a database back end. It supports flexible, ad-hoc spreadsheet operations, while inheriting the scalability and power of databases. Our research group at the University of Illinois has been tackling a number of challenges in developing DataSpread, including developing flexible representation schemes for a variety of spreadsheet structures, designing mechanisms for recording and retrieving information based on position, and devising lazy computation approaches that prioritize for what the user is seeing over what is not currently being displayed.
There have been a number of other projects targeted at improving the usability of databases, including some wonderfully prescient work by Joe Hellerstein and co-authors, and by Jagadish and co-authors. More recently, researchers have identified that SQL is a roadblock for analysts, and have proposed a variety of tools to alleviate that issue, such as GestureDB. Some companies, including Fieldbook, Airtable, and AlphaSheets are addressing similar challenges.
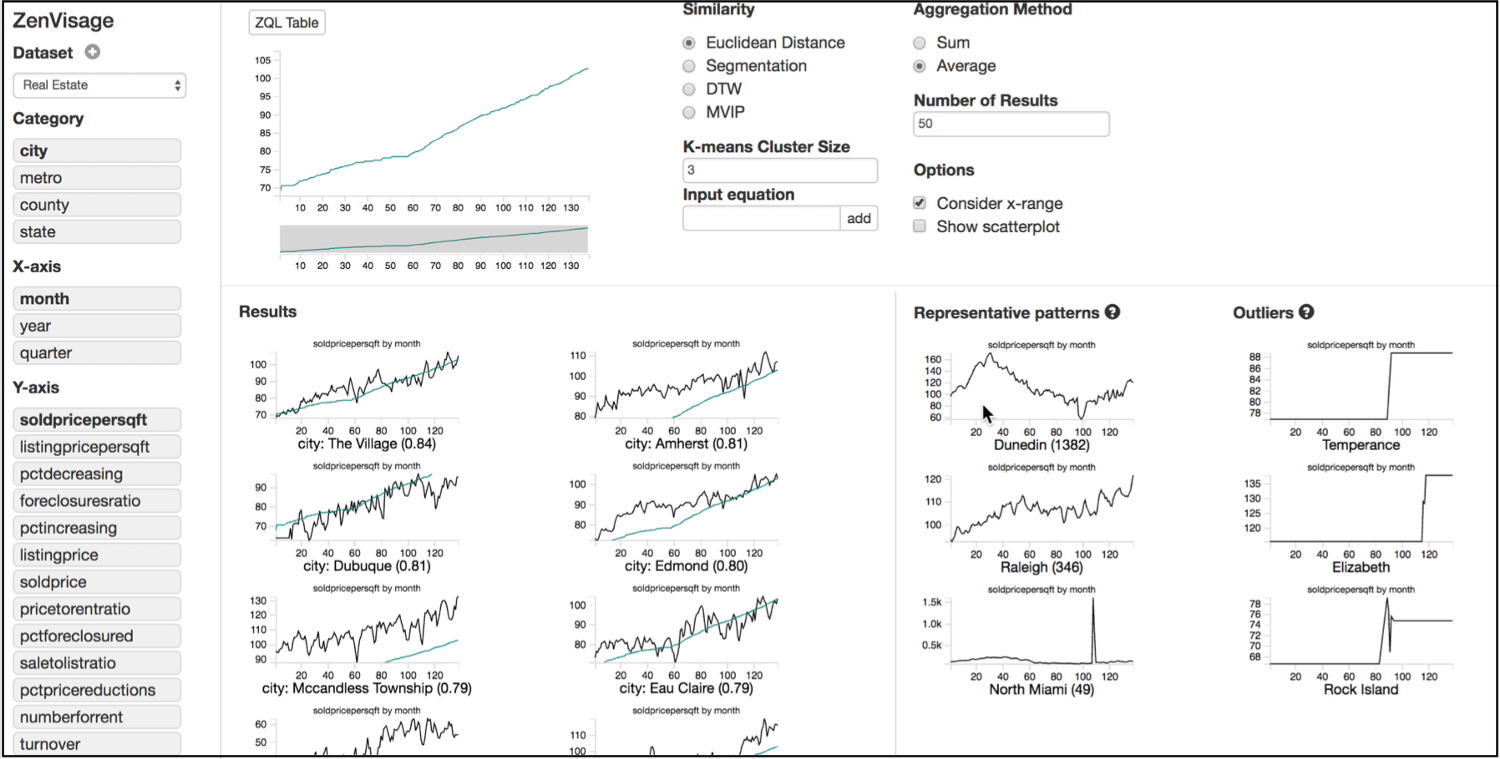
The exploration problem
For many who do not know how to program, but have access to large data sets, even figuring out where to begin analysis can be overwhelming and unclear. Microsoft Excel’s visualization tools, or even visual analytics tools like Tableau, reduce this burden quite a bit by making it straightforward to generate drag-and-drop visualizations. But what if you had dozens of attributes and hundreds of attribute values ? You likely wouldn’t know where to look, what typical patterns and trends look like, and you wouldn’t know where or how to find desired patterns. At present, these forms of discoveries happen via tedious trial-and-error: generate a number of visualizations until you find the ones you want.
Related projects
The Zenvisage project at the University of Illinois (as well as a previous incarnation, SeeDB) enables data scientists to specify a desired pattern (or more generally, a visual exploration query), and rapidly combs through collections of visualizations to find those that match the specification. The challenges here include developing a visual exploration language and interactive interface, determining what constitutes a “match,” along with query execution mechanisms that can explore a large number of candidate visualizations for matches quickly.
Google recently introduced the Explore functionality within Google Sheets, which, given a spreadsheet, recommends charts based on the data types being displayed. Other recent tools in this space include Voyager, Data Polygamy, Profiler; Sunita Sarawagi’s seminal work on data cube browsing from the 90s is also relevant.
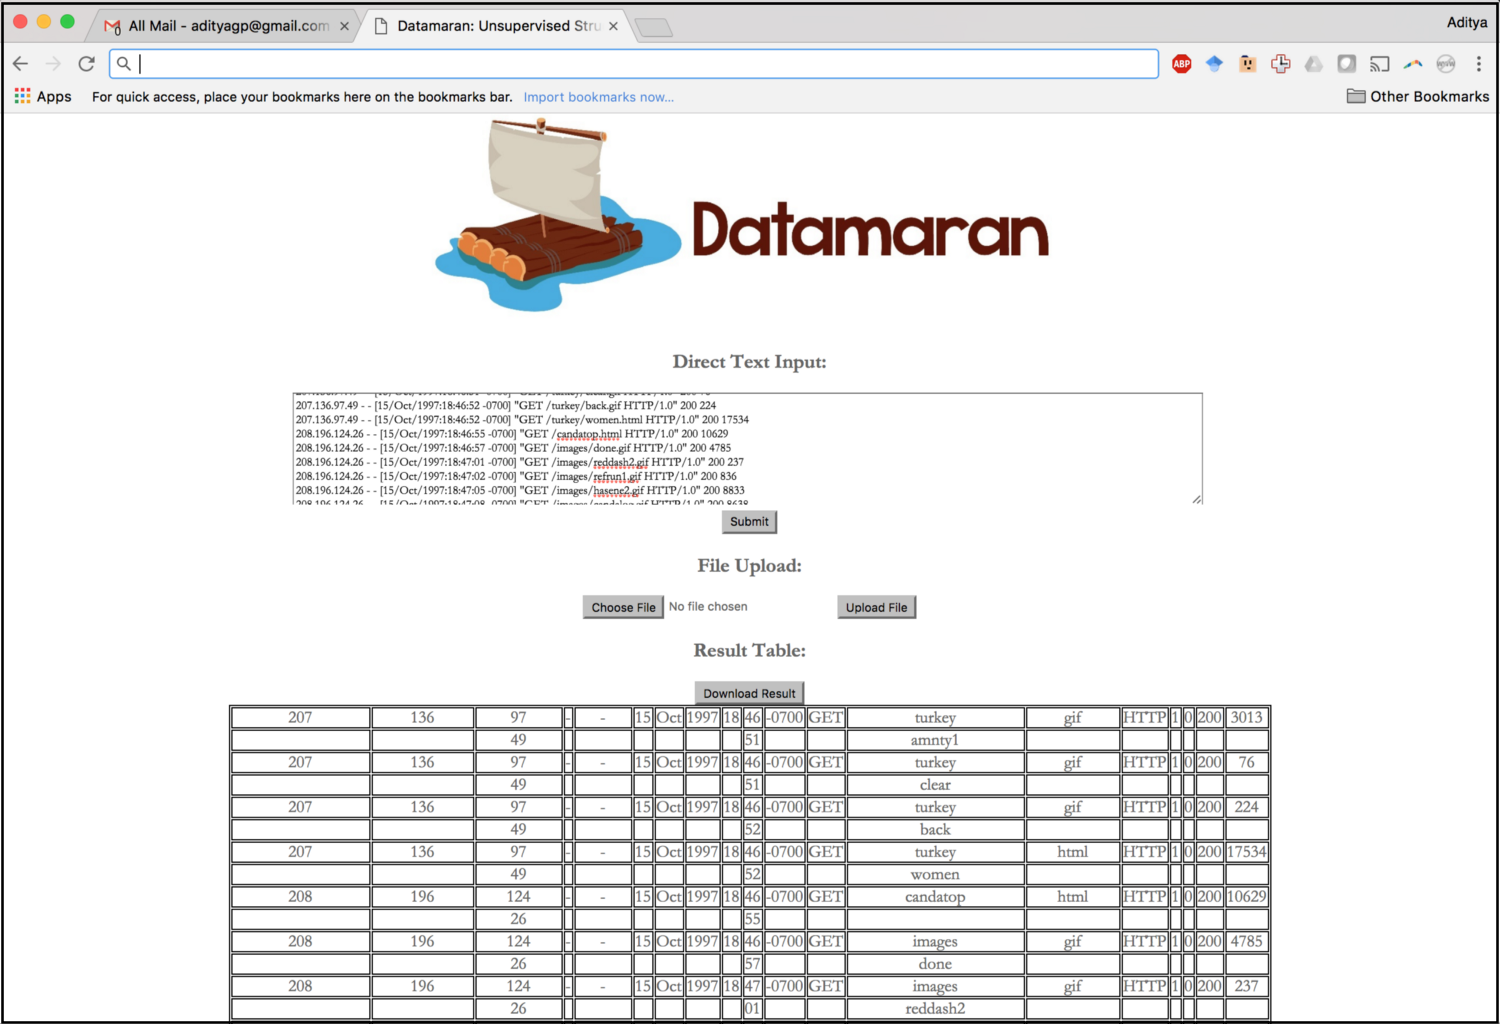
The data lake problem
Now that collection of data has become easier, organizations of all sizes routinely accumulate vast numbers of structured and semi-structured data sets. Semi-structured data sets are typically the output of programs, and there is very little discipline in how these data sets are organized. There’s no clear sense of what each data set contains, how each data set relates to other data sets, and how to extract value or structure to leverage for analysis.
Related projects
There are two underlying challenges here: the extraction of structured data and relating data sets to each other.
Trifacta, based on Data Wrangler, supports the interactive extraction of structured data from semi-structured log data sets. Other tools in this space include FlashExtract, PADS, and Foofah. Our Datamaran project is aimed at fully-unsupervised extraction from semi-structured machine-generated data sets.
There have been multiple efforts to integrate and query large collections of data sets: Google’s WebTables project put some of these ideas to work in practice; more recently, Microsoft’s InfoGather project, Google’s Goods project, and the Data Civilizer project are addressing similar challenges. Data cleaning has also witnessed a bunch of recent interest, such as Microsoft’s data cleaning project, the HoloClean project, Luna’s Knowledge Fusion project, and the company Tamr. Classical work on data integration, and in particular, entity matching, is also relevant here.
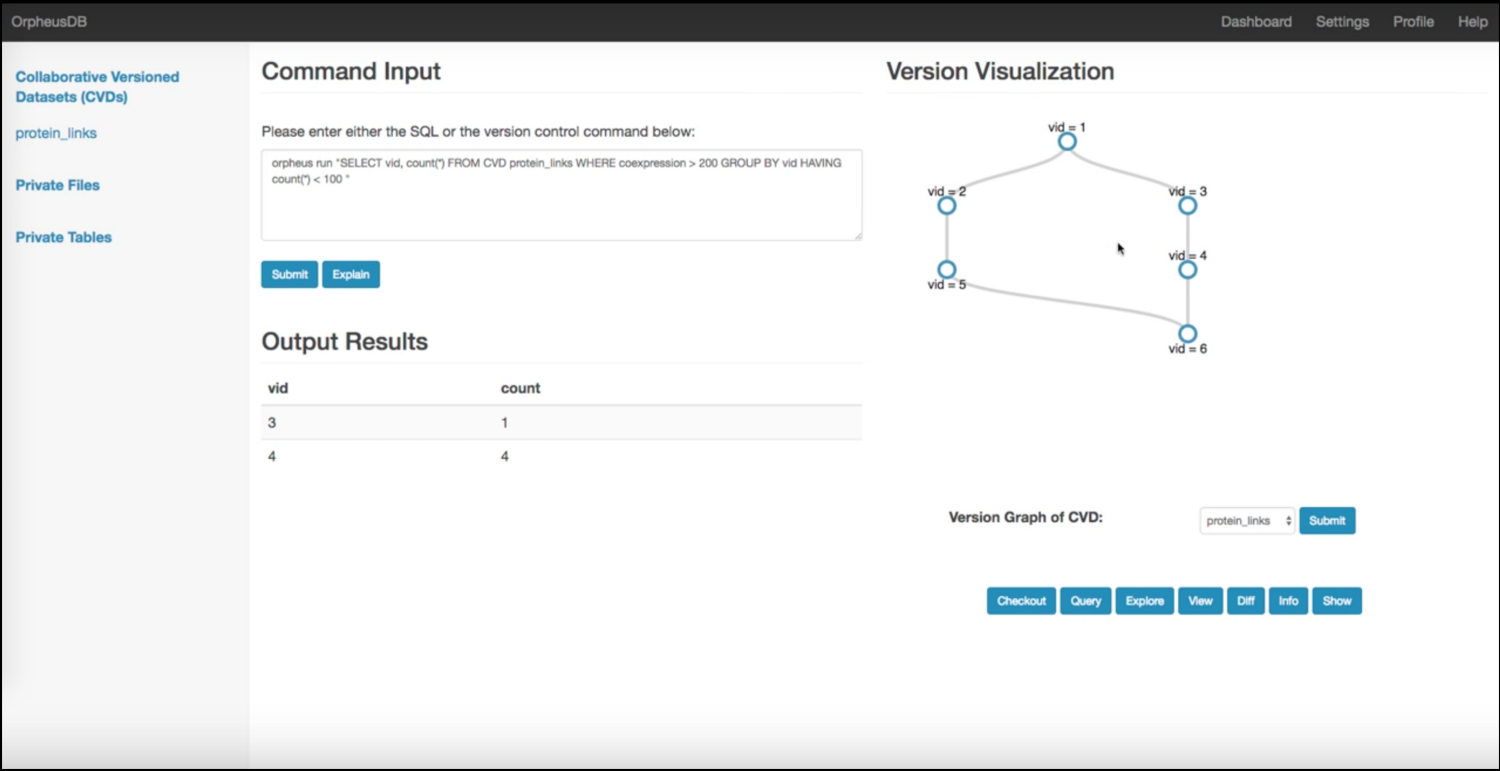
The data versioning problem
When performing data science, data scientists routinely generate hundreds of data set versions at various stages of analysis. These versions are generated via various transformations, including cleaning, normalization, editing, and augmentation. At the same time, they are not stored in databases; instead, they are stored via ad-hoc mechanisms, like networked file-systems.
As a result, there is very little understanding of the derivation relationships across different versions, making it hard to locate or retrieve relevant versions for reproducibility and auditing. In addition, storing different data set versions as-is leads to massive redundancies.
Related projects
The Orpheus project at Illinois and U. Chicago supports data set versioning via a lightweight layer on top of a traditional relational database that is agnostic to the presence of versions. Via rewriting rules and partitioning to trade-off storage and retrieval, we make data set versioning efficient and practical.
Orpheus builds on the Datahub project; another offshoot is ProvDB, which aims to capture model-building also under the same ecosystem. Ground is an emerging related effort to track data science metadata. In a similar vein, ModelDB helps track machine learning models developed in the course of data analysis. There is a lot of classical work on provenance in the context of databases and workflows, as well as work on time-travel databases, both of which are relevant.
The learning problem
Machine learning is a necessity in data science, especially for predictive capabilities, or for identifying hidden relationships between variables. Yet, deploying machine learning is rather challenging: there is a lot of code that needs to be written, machine learning pipelines often take hours to run, and rerunning the code after making small changes, such as adding or deleting features, or changing parameters (e.g., those that that control the complexity of the model space), ends up requiring the user to spend several hours supervising the pipelines.
Related projects
The nascent Gestalt project is aimed at reducing the amount of time required in iterative machine learning by intelligently avoiding repeated computation across iterations—stay tuned for a release soon. Other related projects in this space include KeystoneML, DeepDive, Stan, Edward, TensorFlow, and SystemML, among others. There has been some exciting and important efforts to make machine learning more high level, reducing the effort involved in parameter tuning, feature specification, model maintenance, and training data specification.
A common recipe and a path forward
Overall, there is a pressing need for powerful HILDA tools that can help analysts—regardless of skill level—extract insights from large data sets. These tools need to be developed from the ground up to reduce labor, time, and tedium; simultaneously, the tools must minimize complexity and the need for sophisticated analysis skills.
The design of HILDA tools must also acknowledge that human attention is actually the scarcest resource—and, therefore, must optimize the participation of humans in the data science process. Developing these tools requires techniques from multiple fields: not just database systems, but also algorithms and ideas from data mining, as well as design and interaction principles from human-computer interaction (HCI).
This creates challenges in evaluation: not only do we need to optimize and evaluate the performance and scalability (from databases), but also accuracy and usefulness of insights (from data mining), and usability and interactivity (from HCI).
As more and more organizations and disciplines accumulate vast troves of data, HILDA is going to be not just hugely important, but also increasingly necessary. By enabling the majority of data users to tap into the hidden insights within these troves of data, HILDA has the potential to not just revolutionize, but also define the field of data analytics in the decades to come.