Visualization of the Week: Clustering your social graph
A Facebook app organizes your friends via shared interests and experiences.
 Theo van Doesburg, Landscape, 1915, pastel on paper (source: Van Moorsel donation to the Dutch State / Wikimedia)
In early 2011, LinkedIn released InMaps, a way to visualize your network and see the clusters into which people fall, based on where you shared employment or education, for example. (You can read O’Reilly Radar’s interview with LinkedIn data scientist Ali Imam for a look at how the company created InMaps.)
The visualization below comes from the data viz company Meurs. It’s a Facebook app that uses a concept similar to InMaps to visualize your Facebook network. With the app, you can see how your friends are clustered based on education, location, occupation, and so on.

Learn faster. Dig deeper. See farther.
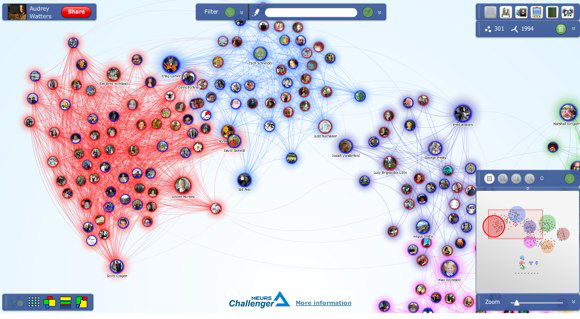
You can also view the clusters as arranged by movie, TV, books, and music “likes.” It’s particularly revealing to see which of your Facebook friends are in the Nickelback cluster, or in my case, that none of the people I went to grad school with (for literature, I should add) have “liked” any books on Facebook.
Found a great visualization? Tell us about it
This post is part of an ongoing series exploring visualizations. We’re always looking for leads, so please drop a line if there’s a visualization you think we should know about.