Graphs as the front end for machine learning
The O’Reilly Data Show Podcast: Leo Meyerovich on building large-scale, interactive applications that enable visual investigations.
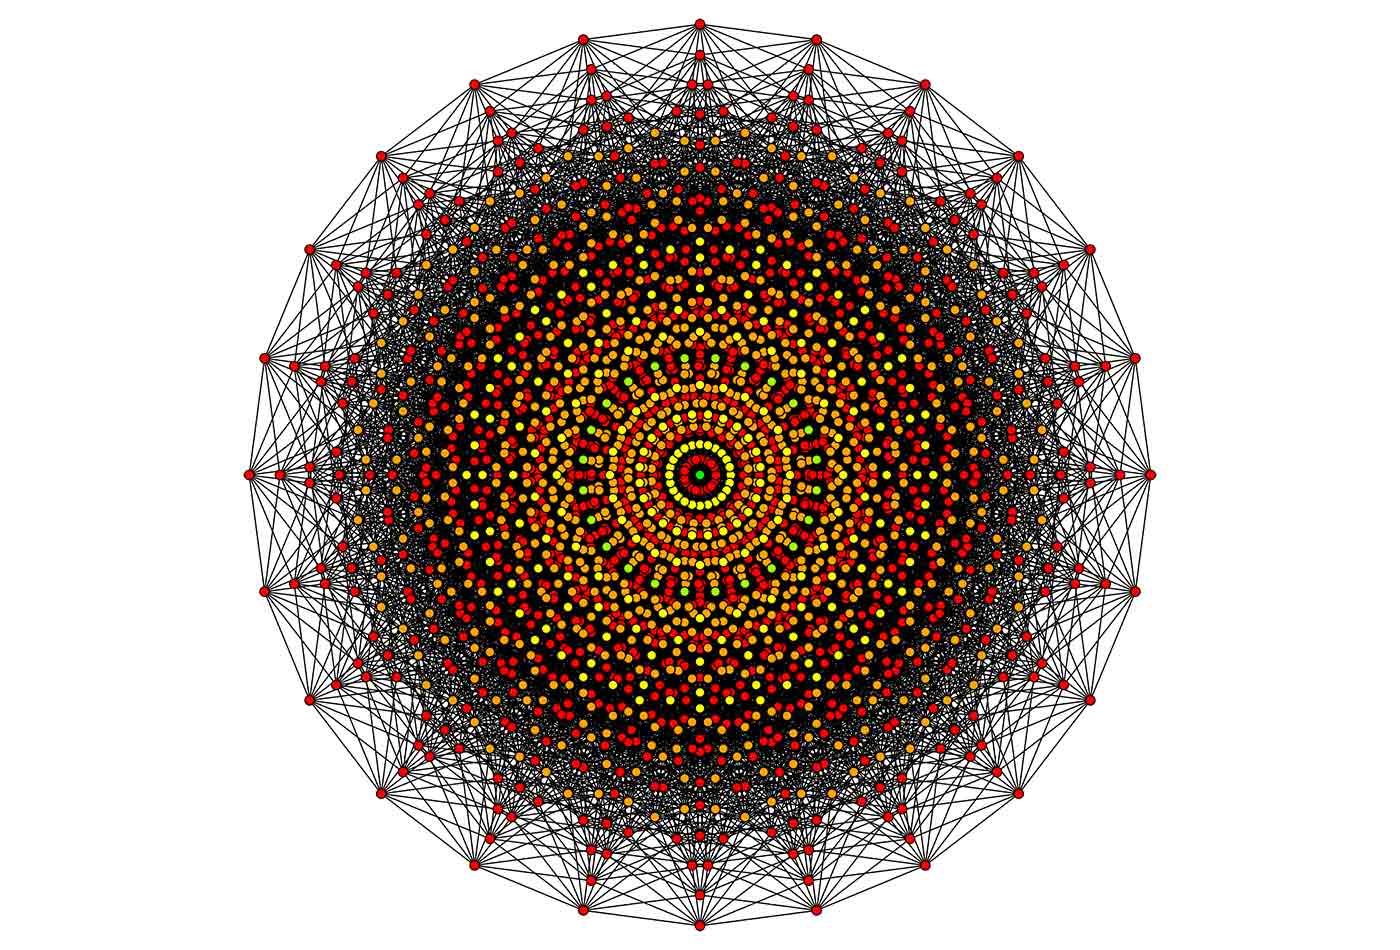 12-cube dodekeract graph (source: Tomruen on Wikimedia Commons)
In this episode of the Data Show, I spoke with Leo Meyerovich, co-founder and CEO of Graphistry. Graphs have always been part of the big data revolution (think of the large graphs generated by the early social media startups). In recent months, I’ve come across companies releasing and using new tools for creating, storing, and (most importantly) analyzing large graphs. There are many problems and use cases that lend themselves naturally to graphs, and recent advances in hardware and software building blocks have made large-scale analytics possible.
Starting with his work as a graduate student at UC Berkeley, Meyerovich has pioneered the combination of hardware and software acceleration to create truly interactive environments for visualizing large amounts of data. Graphistry has built a suite of tools that enables analysts to wade through large data sets and investigate business and security incidents. The company is currently focused on the security domain—where it turns out that graph representations of data are things security analysts are quite familiar with.

Learn faster. Dig deeper. See farther.
Here are some highlights from our conversation:
Graphs as the front end for machine learning
They’re really flexible. First of all, there’s a pure analytic reason in that there are certain types of queries that one could do efficiently with a graph database. If you needed do a bunch of joins, graphs are really great at that. … Companies want to get into stuff like 360-degree views of things; they want to understand correlations to actually explain what’s going on at a more intelligent level.
… I think that’s where graphs really start to shine. Because companies deal with pretty heterogeneous data, and a graph ends up being a really easy way to deal with that. A lot of questions are basically, “What’s nearby?”—almost like your nearest neighbor type of stuff; the graph becomes, both at the query level and at the visual level, very interpretable. I now have a hypothesis about graphs as being the front end and the UI for machine learning, but that might be a topic for another day.
Graph applications and correlation services
If we’re talking about investigating a financial crime, you’ve got a transaction or user. … For example, if the user has multiple names but all the names are using the same address, you’re going to want to see that relationship.
… In security, where a lot of my mind is today, there is something called Kill Chain, where if you think of any bad incident, there’s probably a sequence of events around it, that led up to it. … You can map out that Kill Chain. So, in a sense, a lot of the reason Graphistry uses graphs is so we can let people see that sort of progression of events and reason about it.
… When people are using the graphs, especially in an enterprise setting, I think there’s a process change that’s happening if you’re building an enterprise data lake type of system. … It’s great if you can get individual alerts and create cases and investigations around individual alerts. But increasingly, you want a higher-level thing. … Instead of looking at individual alerts or individual events, you really want to think of incidents—an incident is basically a collection of alerts. For example, maybe there’s some fraud going on; if somebody figured out how to do fraud once, they’re probably going to try doing it multiple times. So, you don’t want to be playing whack-a-mole on little symptoms in each individual case; you want to get that full group incident. A graph becomes basically a way to create a real correlation service.
(Full disclosure: I’m an advisor to Graphistry.)
Related resources:
- “Graph databases are powering mission-critical applications”: Emil Eifrem on popular applications of graph technologies
- “Semi-supervised, unsupervised, and adaptive algorithms for large-scale time series”: Ira Cohen on developing machine learning tools for a broad range of real-time applications
- “Using Apache Spark to predict attack vectors among billions of users and trillions of events“: Fang Yu on data science in security
- “How machine learning will accelerate data management systems”
- “Architecting and building end-to-end streaming applications”