Graphs in the world: Modeling systems as networks
See, extract, and create value with networks.
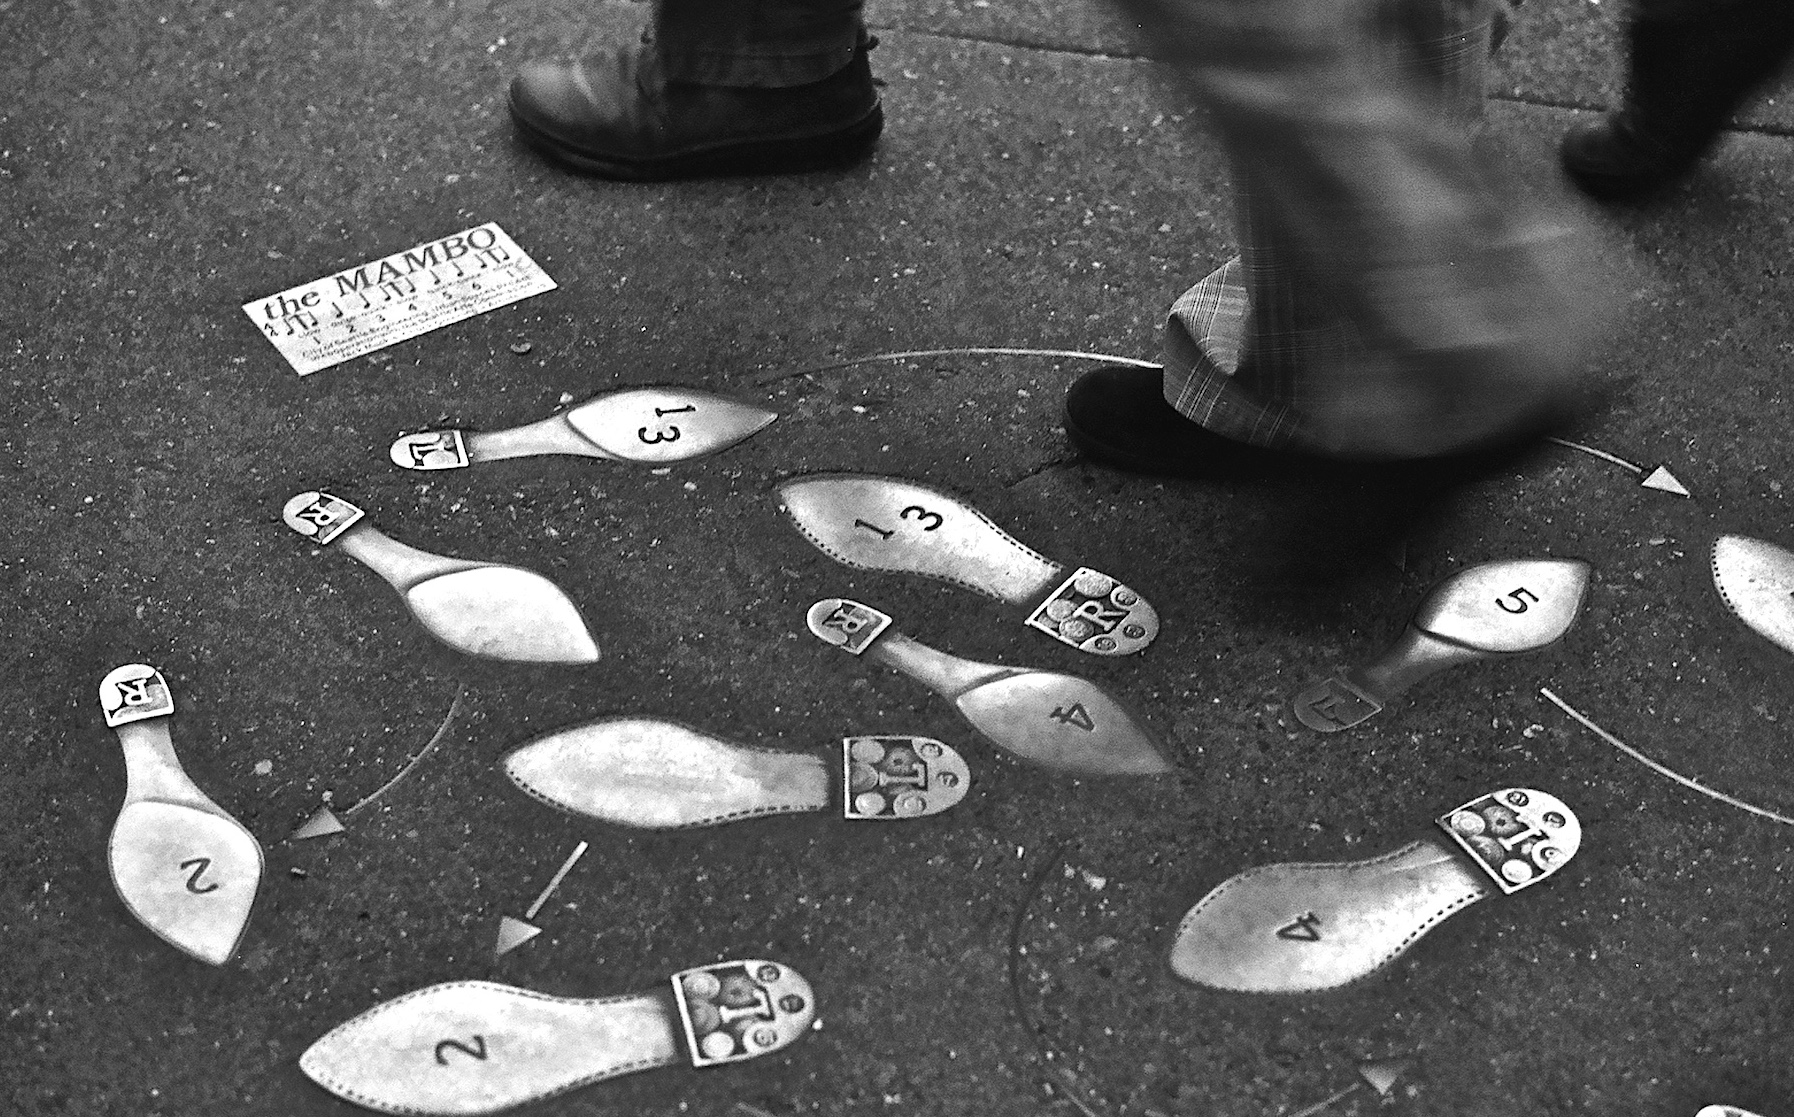 Dancing in the Streets (source: John Henderson)
Networks of all kinds drive the modern world. You can build a network from nearly any kind of data set, which is probably why network structures characterize some aspects of most phenomenon. And yet, many people can’t see the networks underlying different systems. In this post, we’re going to survey a series of networks that model different systems in order to understand different ways networks help us understand the world around us.
We’ll explore how to see, extract, and create value with networks. We’ll look at four examples where I used networks to model different phenomenon, starting with startup ecosystems and ending in network-driven marketing.

Learn faster. Dig deeper. See farther.
Networks and markets
Commerce is one person or company selling to another, which is inherently a network phenomenon. Analyzing networks in markets can help us understand how market economies operate.
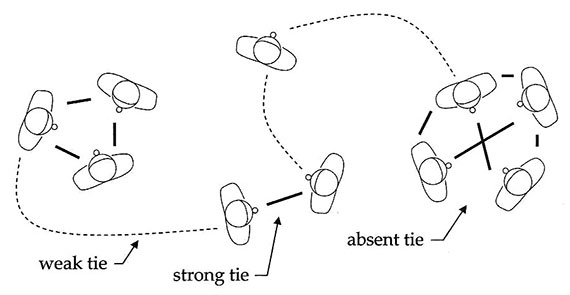
Strength of weak ties
Mark Granovetter famously researched job hunting and discovered the Strength of Weak Ties.
Granoveter’s paper is one of the most influential in social network analysis, and it says something counter-intuitive: loosely connected professionals (weak ties) tend to be the best sources of job tips because they have access to more novel and different information than closer connections (strong ties). The weak tie hypothesis has been applied to understanding numerous areas.
In Granoveter’s day, social network analysis was limited in that data collection usually involved a clipboard and good walking shoes. The modern Web contains numerous social networking websites and apps, and the Web itself can be understood as a large graph of Web pages with links between them. In light of this, a backlog of techniques from social network analysis are available to us to understand networks that we collect and analyze with software, rather than pen and paper. Social network analysis is driving innovation on the social Web.
Networks of success
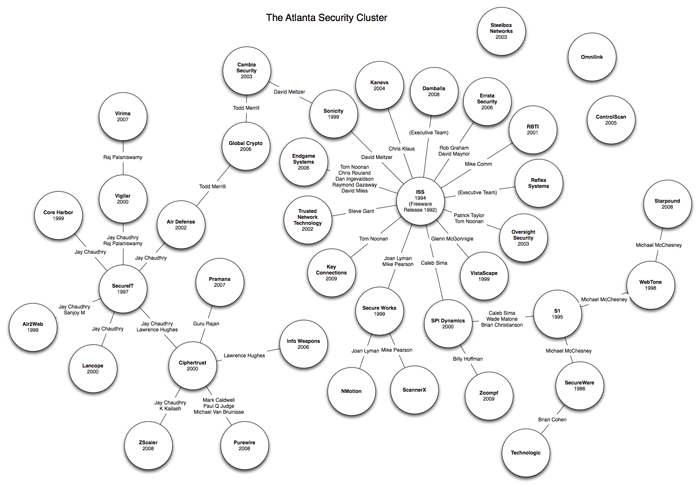
There are other ways to use networks to understand markets. Below is a map of the security sector of the startup ecosystem in Atlanta as of 2010.

I created this map with the help of the startup community in Atlanta, and LinkedIn and Google. Each node (circle) is a company. Each link between nodes represents a founder who worked at the originating company and went on to found the destination company. Look carefully and you will see that Internet Security Systems (ISS) and SecureIT (which sold the Internet Scanner by ISS) spawned most of the other companies in the cluster.
This simple chart illustrates the network-centric process underlying the emergence of startup ecosystems. Groups of companies emerge together via “Networks of Success” — groups of individuals who work together and develop an abundance of skills, social capital, and cash.
This network is similar to others that are better known, like the PayPal Mafia or the Fairchildren.
This was my first venture into social network research — a domain typically limited to social scientists and Ph.D. candidates. And when I say social network, I don’t mean Facebook; I mean social network as in social network analysis.
The Atlanta security startup map shows the importance of apprenticeship in building startups and ecosystems. Participating in a solid IPO is equivalent to seed funding for every early employee. This is what is missing from startup ecosystems in provincial places: collectively, there isn’t enough success and capital for the employees of successful companies to have enough skills and capital to start their own ventures.
Once that tipping point occurs, though, where startups beget startups, startup ecosystems self-sustain — they grow on their own. Older generations of entrepreneurs invest in and mentor younger entrepreneurs, with each cohort becoming increasingly wealthy and well connected. Atlanta has a cycle of wealth occurring in the security sector, making it a great place to start a security company.
My hope with this map was to affect policy — to encourage the state of Georgia to redirect stimulus money toward economic clusters that work as this one does. The return on this investment would dwarf others the state makes because the market wants Atlanta to be a security startup mecca. This remains a hope.
In any case, that’s a lot to learn from a simple map, but that’s the kind of insight you can obtain from collecting and analyzing social networks.
LinkedIn InMaps
Ali Imam invented LinkedIn’s InMaps as a side project. InMaps were a hit: people went crazy for them. Ali was backlogged using a step-by-step, manual process to create the maps. I was called in to turn the one-off process into a product. The product was cool, but more than that, we wanted to prove that anyone at LinkedIn could come up with a good idea and we could take it from an idea to a production application (which we did).
Snowball sampling and 1.5 hop networks
InMaps was a great example of the utility of snowball samples and 1.5 hop networks. A snowball sample is a sample that starts with one or more persons, and grows like a snowball as we recruit their friends, and then their friend’s friends, until we get a large enough sample to make inferences. 1.5 hop networks are local neighborhoods centered on one entity or ego. They let us look at a limited section of larger graphs, making even massive graphs browsable.
With InMaps, we started with one person, and then added their connections, and finally added the connections between them. This is a “1.5 hop network.” If we only looked at a person and their friends, we would have a “1 hop network.” If we included the person, their friends, as well as all connections of the friends, as opposed to just connections between friends, we would have a “2 hop network.”
Viral visualization
My favorite thing about InMaps is a bug that became a feature. We hadn’t completed the part of the project where we would determine the name of each cluster of LinkedIn users. At the same time, we weren’t able to get placement for the application on the site. So how would users learn about InMaps?
We had several large-scale printers, so I printed my brother‘s InMap as a test case. We met so I could give him his map, and we ended up labeling the clusters by hand right there in the coffee shop. He was excited by his map, but once he labeled it, he was ecstatic. It was “his” art, and it represented his entire career. He had to have it. Ali created my brother’s InMap, below, and I hand labeled it in photoshop:
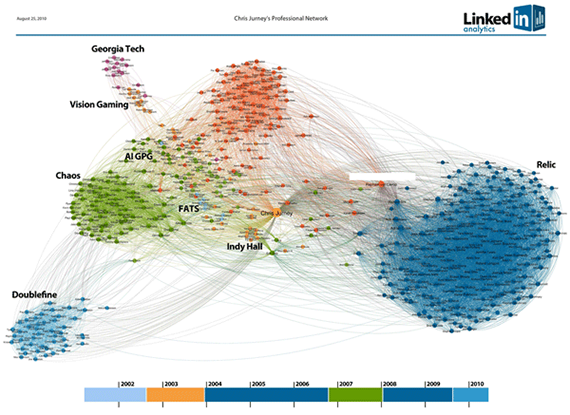
So, we’d found our distribution: virality. Users would create their own InMaps, label the clusters, and then share their personalized InMap via social media. Others would see the InMap, and want one of their own — creating a viral loop that would get the app in front of users.
Inbox networks
After I left LinkedIn, I missed their data. I needed a new data set to play with, and Chris Diehl told me about his work on the Enron data set.
About half a gigabyte of emails that surfaced during the investigation into the collapse of Enron have become a standard data set against which researchers research and develop a variety of statistical software and systems.
After playing with the Enron data set, I wanted something more personal. I wrote a script that downloads your Gmail inbox into Avro format. After all, if it’s your data, then you can really gauge insight.
Taking a cue from InMaps, I rendered maps of my inbox and labeled the clusters.
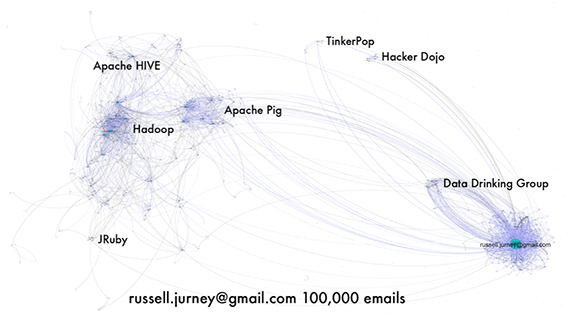
Inbox ego networks
This showed the different groups I belong to, mailing lists, etc. From there, it was possible to create an ego network of senders of emails, and to map users to groups and organizations. Inbox ego networks are a big deal: this is the technology behind RelateIQ, which was acquired in 2014 for $392 million. RelateIQ’s killer feature is that it reduces the amount of data entry required, as it automatically identifies companies you’re emailing by their domain and creates customer relationship management (CRM) entries for each email you send or receive.
Agile data science
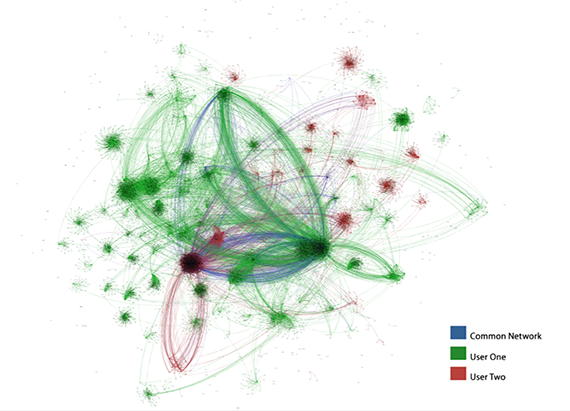
I founded Kontexa to create a collaborative, semantic inbox. I used graph visualization to inspect the results of my data processing and created my own simple graph database on top of Voldemort to allow the combination of different inboxes at a semantic level. The following is my inbox unioned with my brother’s:
This work became the foundation for my first book, Agile Data Science. In the book, users download their own inboxes and then we analyze these Avro records in Apache Pig and Python.
Customer relationship management analytics
During a nine-month stint as data scientist in residence at The Hive, I helped launch the startup E8 Security, acting as the first engineer on the team (E8 went on to raise a $10 million series A). As my time at E8 came to a close, I once again found myself needing a new data set to analyze.
Former Hiver Karl Rumelhart introduced me to CRM data. CRM databases can be worth many millions of dollars, so it’s a great type of data to work with. Karl posed a challenge: could I cluster CRM databases into groups, which we could then use to target different sectors in marketing automation?
We wanted to know if segmenting markets was possible before we asked any prospective customers for their CRM databases. So, as a test case, we decided to look at the big data market. Specifically, we focused on the four major Hadoop vendors: Cloudera, Hortonworks, MapR, and Pivotal.
In the absence of a CRM database, how would I link one company to another? The answer: partnership pages. Most companies in the big data space have partnership pages, which list other companies a given company works with in providing its products or services. I created a hybrid machine/turk system that gathered the partnerships of the four Hadoop vendors. Then I gathered the partnerships of these partners to create a “2nd degree network” of partnerships.
Once clustered, the initial data looked like this:
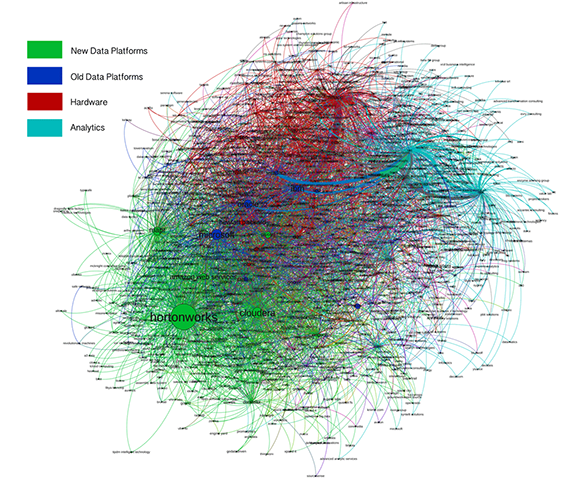
Taking a cue from InMaps once again, I hand labeled the clusters. We were pleased to find that they corresponded roughly with sectors in the big data market — new/old data platforms, and hardware and analytic software companies. An idea we’ve been playing with is to create these clusters, then classify new leads into its cluster, and use this cluster field in marketing automation. This would allow better targeting with cluster-specific content.
Market reports
At this point, I really thought I was onto something. Something worth exploring fully. What if we mapped entire markets, indeed the entire economy, in terms of relationships between companies? What could we do with this data? I believe that with a scope into how the economy works, we could make markets more efficient.
Early this year, I founded Relato with this goal in mind: improve sales, marketing and strategy by mapping the economy. Working on the company full time since January, we’ve partnered with O’Reilly to extend the initial work on the big data space to create an in-depth report: Mapping Big Data: A Data Driven Market report. The report will include an analysis of data we’ve collected about companies in the big data space, along with expert commentary. This is a new kind of market report that you’ll be seeing more of in the future.
Conclusion
We’ve shown how networks are the structure behind many different phenomenon. When you next encounter a new data set, you should ask yourself: is this a network? What would understanding this data as a network allow me to do?