Highlights from the 2016 European Software Development Salary Survey
Find out what pays and what doesn't for European software engineers, developers, and other programming professionals.
 Illustration from "Wonderful ballon ascents" (source: Internet Archive Book Images via Flickr)
Executive Summary
IN 2016, O’REILLY MEDIA CONDUCTED A SOFTWARE DEVELOPMENT SALARY SURVEY ONLINE. The survey contained 72 questions about the respondents’ roles, tools, compensation, and demographic background. More than 5,000 software engineers, developers, and other professionals involved in programming participated in the survey, 1,353 of them from European countries. This provided us with the opportunity to explore the software-development world—and the careers that propel it—in great detail. Some key findings include:
- Top languages currently used professionally in the sample: JavaScript, HTML, CSS, Java, Bash, and Python.
- Respondents reported using an average of 3.6 languages.
- The highest salaries are in Switzerland, the UK, Ireland, Denmark, and Norway.
- Software development is a social endeavor: people who are on tiny teams and who don’t attend meetings tend to earn much less.
- The most common languages that respondents used in the past but no longer use were C/C++, Java, and PHP.
- The most common languages that respondents stated they intend to learn in the next 1–2 years were Go, Swift, Python, and Scala.
- Salary estimates can be obtained from a model based on the survey data whose coefficients are mentioned throughout the report and repeated in full at the end. We hope you will learn something new (and useful!) from this report, and we encourage you to try plugging your own data points into the model.
If you are a developer, you may be wondering, “What
should I be earning?” Or at least, “What do other people
with work similar to mine earn?” To satisfy this curiosity, at
the end of this report, we have provided a way to do a salary
estimate. Our model is based on the survey data whose
coefficients are mentioned throughout the report. We
hope you will learn something new (and useful) from this
report, and encourage you to try plugging your own data
points into the model.

Learn faster. Dig deeper. See farther.
Introduction
THE FIRST O’REILLY SOFTWARE DEVELOPMENT SALARY SURVEY was conducted through an online survey hosted on Google Forms. More than 5,000 respondents submitted responses between January and May 2016, from 51 countries and all 50 US states, from companies both large and small, and from a wide variety of industries. Respondents were mostly software developers, but other professionals who program also participated in the survey.
Of the responses to the survey, 1,353 came from 27 countries in Europe, and those form the basis of the data in this report. The report on the worldwide findings, with some US-specific statistics, can be downloaded from O’Reilly’s web site.
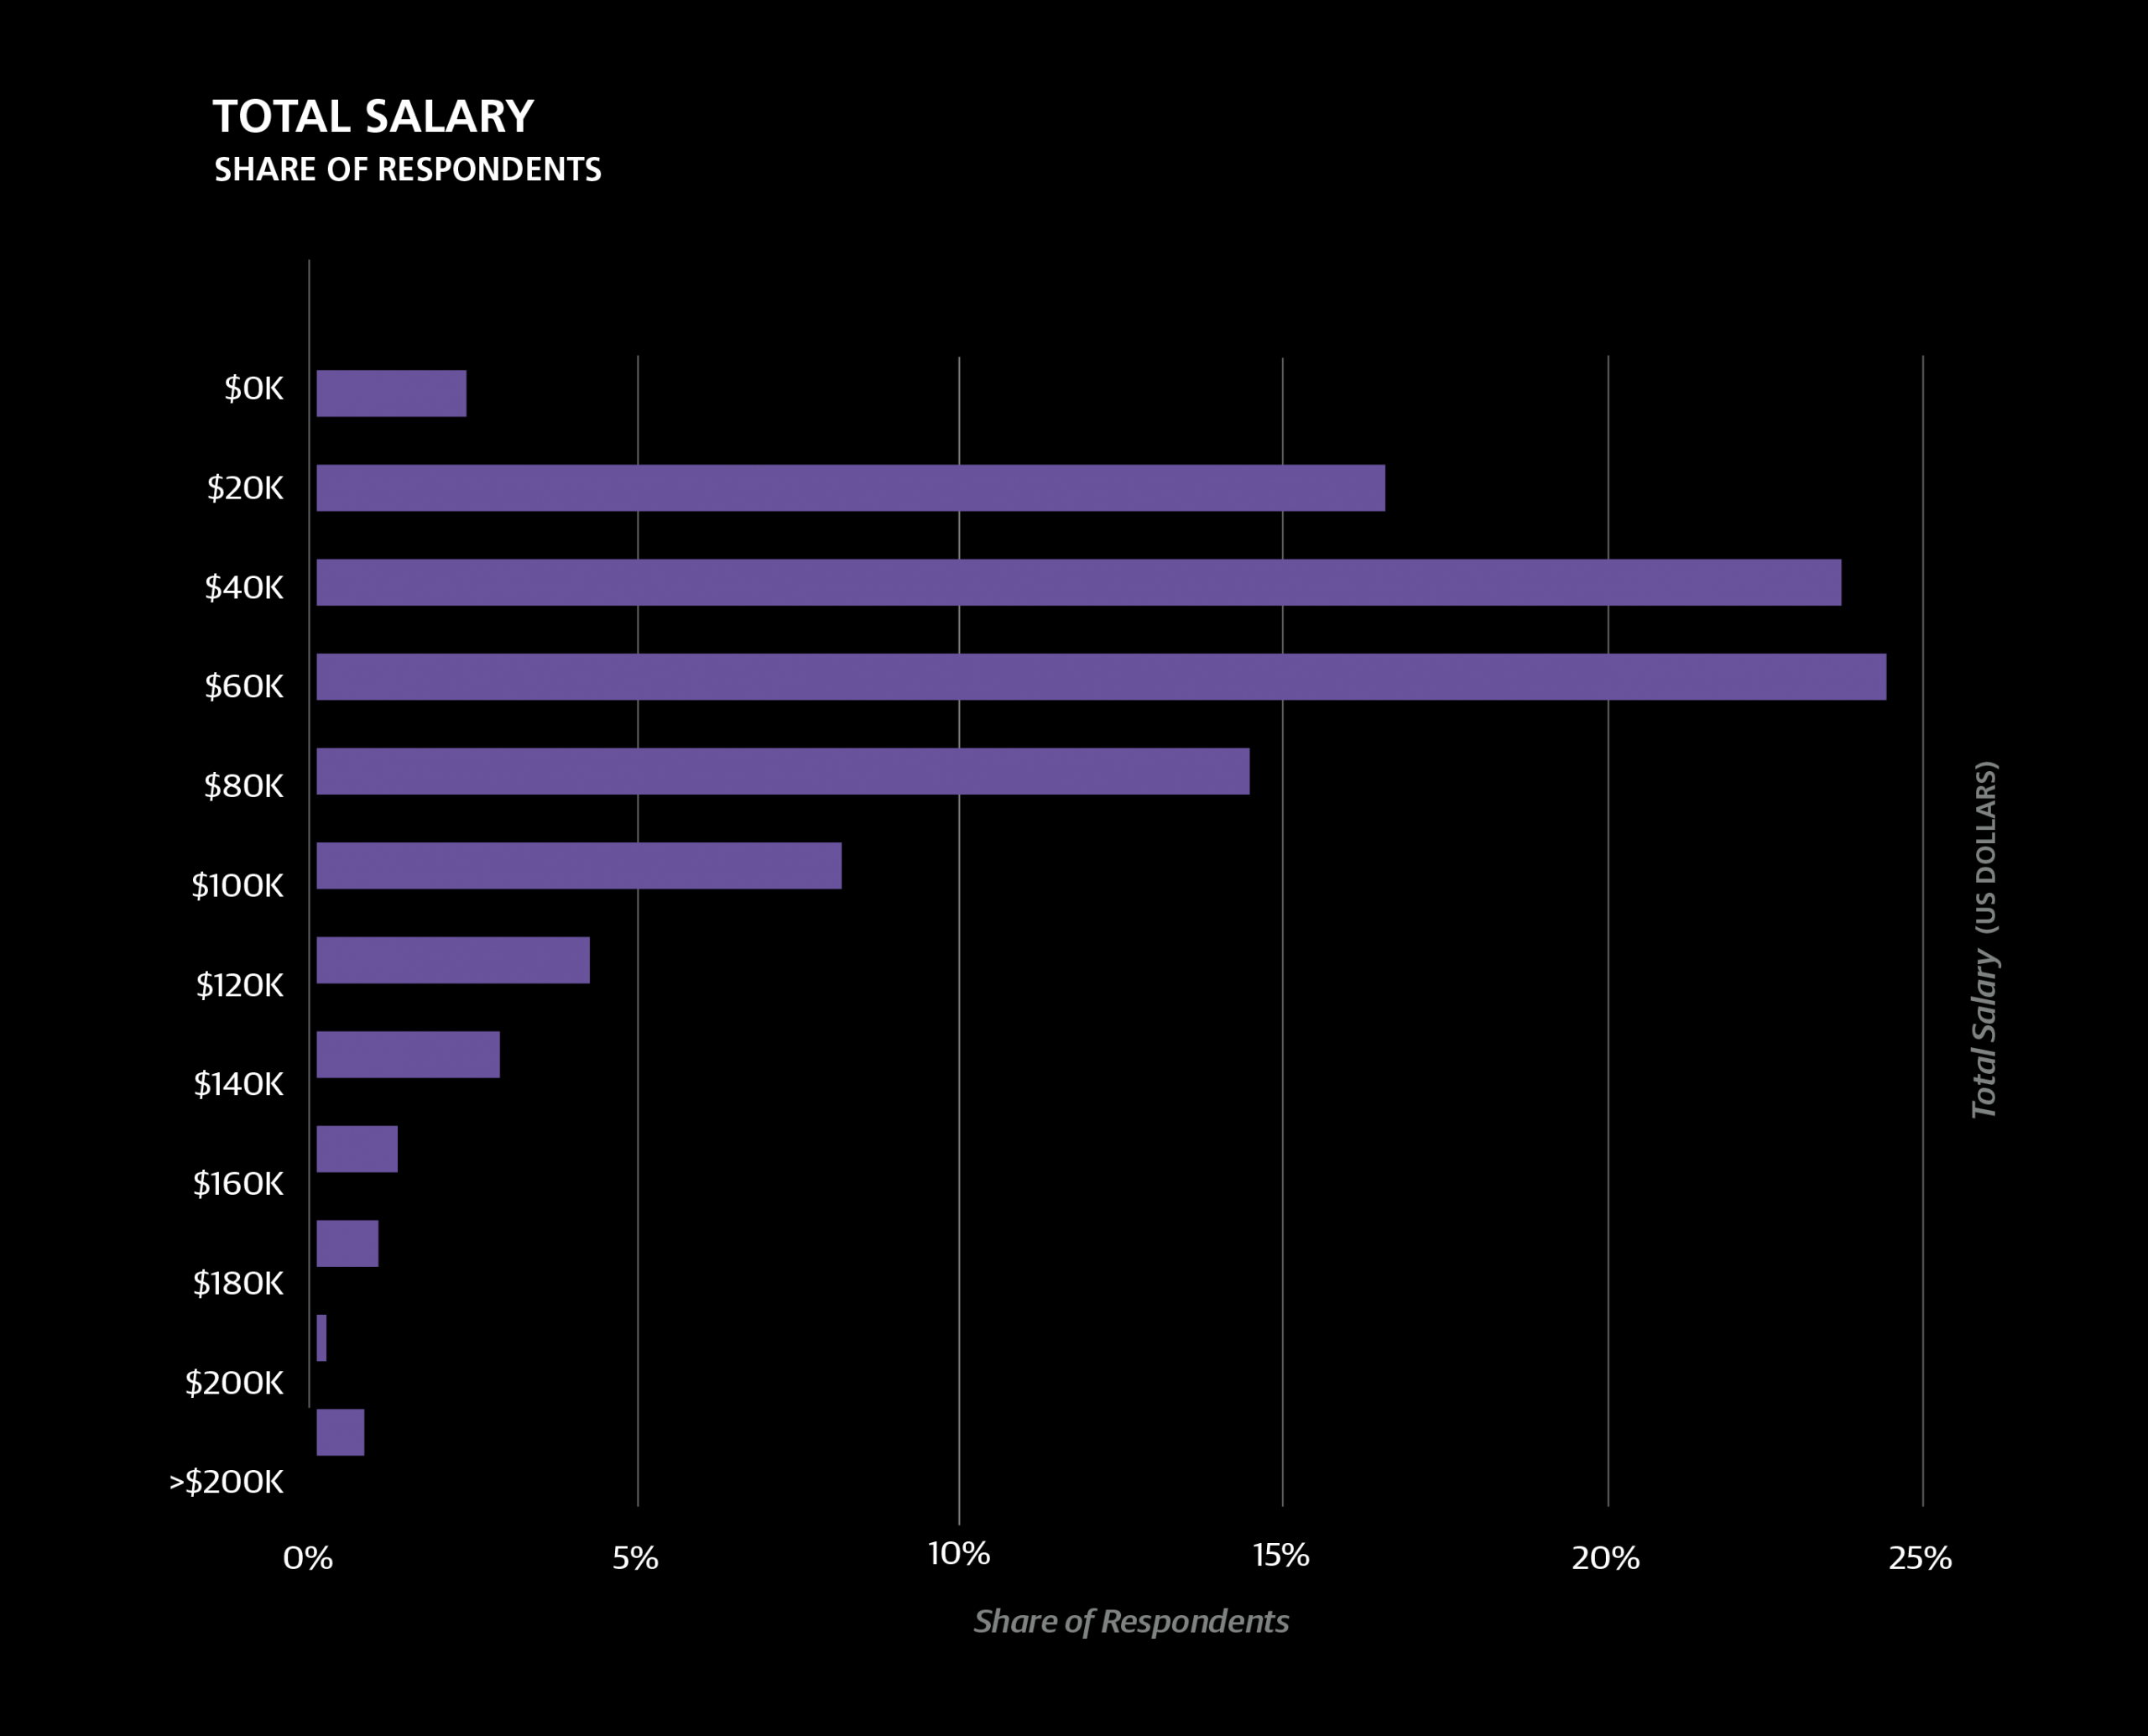
When asking respondents about salaries, we recorded responses in US dollars, and therefore will use dollars throughout this report. The median salary of the entire EU sample was $56,000, with the middle half of all respondents earning between $35k and $80k. The latter statistic is called the interquartile range (IQR)—the middle 50%—and is used to describe the salaries of particular subsets of the sample in this report and its graphs. Imagine the IQR as a bell curve or normal distribution with the left-most 25% and right-most 25% cut off. The IQR is useful for showing the middle of the salary range without the distortion of outliers in the lowest and highest quartiles.
In each section we mention the relevant, significant coefficients, and at the end of the report we repeat those coefficients when we show the full model.
Note
In the horizontal bar charts throughout this report, we include the interquartile range (IQR) to show the middle 50% of respondents’ answers to questions such as salary. One quarter of the respondents has a salary below the displayed range, and one quarter has a salary above the displayed range.
The IQRs are represented by colored, horizontal bars. On each of these colored bars, the white vertical band represents the median value.
Much of the variation in salary matches other variables gathered via the survey. We quantify how much each variable seems to contribute to salary. For instance, the country you are in has a major impact on your salary, and the programming language you use has a much smaller (but often important) impact, whereas a person’s age has no impact at all. Therefore, in addition to simply reporting the salaries of certain groups of respondents, such as those who work a certain industry or use a certain language, we also estimate how much the differences in salaries are correlated with the variables reported. We have found that we can do this using a simple, linear equation (a + b + c + …), developing the coefficients from the survey data. The coefficients are contribution components: by summing the coefficients corresponding to programming language, job role, or other variables, we obtain an estimate for their salary.
Note that not all variables get included in the model, because the method used to generate the model penalizes complexity to avoid overfitting and thus deems many variables insignificant. In each section we mention the relevant, significant coefficients, and at the end of the report we repeat those coefficients when we show the full model.
A primary motivation for constructing a linear model is to clarify the relationship between salary and demographic or role-related variables when two variables are highly correlated. It is worth remembering that correlation does not imply causation. A classic example involves meetings: just because salary clearly rises with the weekly number of hours spent in meetings, don’t expect to get a raise just by maneuvering to add meetings to your schedule! Keep in mind that the survey methodology does not support what may, intuitively, seem like reasonable assumptions of causation from even the strongest correlations—testing for causation is a difficult process at best.
We excluded managers and students from the model because many of the features we think might help determine salary, such as language use, likely work differently (if at all) for these groups. We also exclude those working fewer than 30 hours per week.