How to tune your WAF installation to reduce false positives
Optimizing your NGINX setup with a tuned ModSecurity / Core Rule Set installation.
 No entry (source: Elliott Brown on Flickr)
Tuning your WAF installation to reduce false positives is a tedious process. This article will help you reduce false positives on NGINX, leaving you with a clean installation that allows legitimate requests to pass and blocks attacks immediately.
ModSecurity, the WAF engine, is most often used in coordination with the OWASP ModSecurity Core Rule Set (CRS). This creates a first line of defense against web application attacks, such as those described by the OWASP Top Ten project.

Learn faster. Dig deeper. See farther.
The CRS is a rule set for scoring anomalies among incoming requests. It uses generic blacklisting techniques to detect attacks before they hit the application. The CRS also allows you to adjust the aggressiveness of the rule set, simply by changing its Paranoia Level in the configuration file, crs-setup.conf.
False positives intermixing with real attacks
The fear of blocking legitimate users due to false positives resulting from use of the CRS is real. If you have a substantial number of users, or a web application with suspicious looking traffic, then the number of alerts can be intimidating.
The out-of-the-box CRS configuration has been tuned to aggressively reduce the number of false positives. However, if you are not satisfied with the detection capabilities of the default installation, you will need to change the Paranoia Level to improve the coverage. Raising the Paranoia Level in the configuration file activates rules that are off by default. They are not part of the default installation at Paranoia Level 1 because they have a tendency to produce false positives. The higher the Paranoia Level setting, the more rules are enforced. Thus, the more aggressive the ruleset becomes, and the more false positives are produced.
Considering this, you need a strategy to mitigate false positives. If you allow them to intermix with traces of true attacks, they undermine the value of the rule set. So, you need to get rid of the false positives in order to end up with a clean installation that will let the legitimate requests pass and block attackers.
The problem is trifold:
- How to identify a false positive
- How to deal with individual false positives
- What does a practical approach look like? (Or: How do you scale this?)
When false positives come by the dozen, it is surprisingly difficult to identify them. A deep knowledge of the application helps to tell benign, but suspicious, requests from malicious ones. But if you do not want to look at them one by one, you will need to filter the alerts and make sure you end up with a data set that consists of false positives only. Because if you do not do that, you might end up tuning away real alerts pointing to attacks taking place.
You can use the IP addresses to identify known users, known local networks, etc. Alternatively, you can assume that users who passed the authentication successfully are not attackers (which might be naive, depending on the size of your business). Or you can employ some other means of identification. The exact approach really depends on your setup and the testing process you have in place.
When you have identified an individual false positive, there are multiple approaches to avoid repeating the false positive in the future. With the CRS, you do not edit the rule set because it’s meant to operate as an uneditable and coherent whole. Instead, you reconfigure how the rule set is used, via ModSecurity directives. That allows you to apply the same changes to future versions of the CRS without having to re-create your edits.
There are generally four ways of handling a false positive:
- You can disable a rule completely
- You can remove an argument from inspection by a rule
- You can disable a rule for a given request at runtime (typically based on the URI requested)
- You can remove an argument from inspection by a rule for a given request at runtime
It is obvious that disabling certain rules has an impact on the detection rate of your rule set. In effect, you want to make the smallest change to the rule set that lets benign but suspicious requests pass, thus avoiding false positives. It takes a bit of experience to make the optimal choice in every situation.
I have summarized the four general variants on a cheatsheet you can download from netnea.com.
Scaling the tuning process
It will take some practice to get the hang of this tuning process. And when you are new to this, it does not look as if it would scale. In fact, many newcomers just approach the pile of alerts and try to plough their way through it—often without much success.
The fact that people take this approach is no surprise, given the low readability of the ModSecurity alerts. Here is an example from a real attack (a true positive):
2018/01/15 18:52:34 [info] 7962#7962: *1 ModSecurity: Warning. Matched "Operator `PmFromFile' with parameter `lfi-os-files.data' against variable `ARGS:test' (Value: `/etc/passwd' ) [file "/home/dune73/data/git/nginx-crs/rules/REQUEST-930-APPLICATION-ATTACK-LFI.conf"] [line "71"] [id "930120"] [rev "4"] [msg "OS File Access Attempt"] [data "Matched Data: etc/passwd found within ARGS:test: /etc/passwd"] [severity "2"] [ver "OWASP_CRS/3.0.0"] [maturity "0"] [accuracy "0"] [tag "application-multi"] [tag "language-multi"] [tag "platform-multi"] [tag "attack-lfi"] [tag "OWASP_CRS/WEB_ATTACK/FILE_INJECTION"] [tag "WASCTC/WASC-33"] [tag "OWASP_TOP_10/A4"] [tag "PCI/6.5.4"] [hostname "127.0.0.1"] [uri "/index.html"] [unique_id "151603875418.798396"] [ref "o1,10v21,11t:utf8toUnicode,t:urlDecodeUni,t:normalizePathWin,t:lowercase"], client: 127.0.0.1, server: localhost, request: "GET /index.html?test=/etc/passwd HTTP/1.1", host: "localhost"
If you have thousands of log entries like this, alert fatigue is the normal reaction. You need tools to find your way around. The easiest tool is a set of shell aliases that extracts information and displays it in a more readable way—I have developed a set of shell aliases that perform this task. You can download these from the netnea as well.
Here is an example out of this file that gives you a summary of an alert message:
alias melidmsg='grep -o "\[id [^]]*\].*\[msg [^]]*\]" | sed -e "s/\].*\[/] [/" -e "s/\[msg //" | cut -d\ -f2- | tr -d "\]\"" | sed -e "s/(Total .*/(Total ...) .../"'
Take the example message above and apply this alias:
$> cat sample-alert.log | melidmsg
930120 OS File Access Attempt
That’s a lot better: The rule with ID 930120 was triggered by the request, pointing to an OS File Access Attempt. The suspicious request tried to access /etc/passwd—the local password file of the server, which should never be accessed by the webserver. That’s a clear sign of a real attack.
Now let’s take a list of false positives found on a typical, non-tuned site with a CRS installation at Paranoia Level 3. I applied the melidmsg alias and summed them up per rule (sort | uniq -c | sort -n):
      8 932160 Remote Command Execution: Unix Shell Code Found
     30 921180 HTTP Parameter Pollution (ARGS_NAMES:op)
     75 942130 SQL Injection Attack: SQL Tautology Detected.
    275 942200 Detects MySQL comment-/space-obfuscated injections and backtick termination
    308 942270 Looking for basic sql injection. Common attack string for mysql, oracle and others.
    402 942260 Detects basic SQL authentication bypass attempts 2/3
    445 942410 SQL Injection Attack
    448 921180 HTTP Parameter Pollution (ARGS_NAMES:fields[])
    483 942431 Restricted SQL Character Anomaly Detection (args): # of special characters exceeded (6)
    541 941170 NoScript XSS InjectionChecker: Attribute Injection
   8188 942450 SQL Hex Encoding Identified
The first number given is the number of false positives. The second number is the ID of the rule that was triggered. The string that follows is a description, in text, of the rule.
That’s several thousand false alarms distributed over 11 different rules. That’s more than we can chew on in a single bite, and simply starting with the first alerts won’t get us anywhere. At least we obtained quantitative information. It seems as if the biggest problem would be information that looks hex encoded and CRS thinks it might be an obfuscated attack. Very often, that’s a session ID, if it’s in a cookie.
However, even if starting with the biggest number of false positives would give us instant gratification, it is not the best approach. The moment we hit on the XSS rule, there is a big chance that the 541 alerts resulting from this rule (number 941170) will translate to dozens of different forms and parameters. This would make it very hard to to handle them properly in a single chunk.
So, let’s not rush into this. Let’s come up with a better approach.
Bringing sense and reason to the tuning process
What we need to develop a better approach is a different perspective. We should no longer look at the different rules. We should look at the requests that triggered the rules. So, instead of a few thousand alerts, we will look at hundreds of thousands of requests and put the false positives into perspective.
To do that, we need to know the anomaly score of all the requests on the server. Not only those that scored, but also those that did not set off any alarm. That score is obviously zero, but it’s imperative to know the number of requests in this category to get a better understanding of the number of false positives.
When I used to work on Apache, it was fairly easy to have ModSecurity report the anomaly scores of every request right in the access log of the server. This is not easily possible with NGINX. So, we need to resort to a different technique: we add a rule that reports the anomaly score after the request has been done (in ModSecurity’s logging phase 5). We assign this rule ID 980145.
SecAction \
    "id:980145,\
    phase:5,\
    pass,\
    t:none,\
    log,\
    noauditlog,\
    msg:\'Incoming Anomaly Score: %{TX.ANOMALY_SCORE}\'"
When we grep for this rule ID, we get the score of every single request.
Reformat the output a bit and we can effectively extract the anomaly score:
$> cat error-2.log | grep 980145 | egrep -o "Incoming Anomaly Score: [0-9]+" | cut -b25-
0
0
0
5
0
0
10
0
3
0
0
0
...
How do these values distribute?
$> cat error-2.log | grep 980145 | egrep -o "Incoming Anomaly Score: [0-9]+" | cut -b25- | modsec-positive-stats.rb --incoming

INCOMING                     Num of req. | % of req. |  Sum of % | Missing %
Number of incoming req. (total) | 897096 | 100.0000% | 100.0000% |   0.0000%

Empty or miss. incoming score   |      0 |   0.0000% |   0.0000% | 100.0000%
Reqs with incoming score of   0 | 888984 |  99.0957% |  99.0957% |   0.9043%
Reqs with incoming score of   1 |      0 |   0.0000% |  99.0957% |   0.9043%
Reqs with incoming score of   2 |      3 |   0.0003% |  99.0960% |   0.9040%
Reqs with incoming score of   3 |   1392 |   0.1551% |  99.2512% |   0.7488%
Reqs with incoming score of   4 |      0 |   0.0000% |  99.2512% |   0.7488%
Reqs with incoming score of   5 |    616 |   0.0686% |  99.3199% |   0.6801%
Reqs with incoming score of   6 |      1 |   0.0001% |  99.3200% |   0.6800%
Reqs with incoming score of   7 |      0 |   0.0000% |  99.3200% |   0.6800%
Reqs with incoming score of   8 |     10 |   0.0011% |  99.3211% |   0.6789%
Reqs with incoming score of   9 |      0 |   0.0000% |  99.3211% |   0.6789%
Reqs with incoming score of  10 |   5856 |   0.6527% |  99.9739% |   0.0261%
Reqs with incoming score of  11 |      0 |   0.0000% |  99.9739% |   0.0261%
Reqs with incoming score of  12 |      0 |   0.0000% |  99.9739% |   0.0261%
Reqs with incoming score of  13 |     12 |   0.0013% |  99.9752% |   0.0248%
Reqs with incoming score of  14 |      0 |   0.0000% |  99.9752% |   0.0248%
Reqs with incoming score of  15 |     82 |   0.0091% |  99.9843% |   0.0157%
Reqs with incoming score of  16 |      0 |   0.0000% |  99.9843% |   0.0157%
Reqs with incoming score of  17 |      0 |   0.0000% |  99.9843% |   0.0157%
Reqs with incoming score of  18 |      5 |   0.0005% |  99.9849% |   0.0151%
Reqs with incoming score of  19 |      0 |   0.0000% |  99.9849% |   0.0151%
Reqs with incoming score of  20 |      5 |   0.0005% |  99.9855% |   0.0145%
Reqs with incoming score of  21 |      0 |   0.0000% |  99.9855% |   0.0145%
...
Reqs with incoming score of  29 |      0 |   0.0000% |  99.9855% |   0.0145%
Reqs with incoming score of  30 |    126 |   0.0140% |  99.9995% |   0.0005%
Reqs with incoming score of  31 |      0 |   0.0000% |  99.9995% |   0.0005%
...
Reqs with incoming score of  60 |      4 |   0.0001% |  99.9999% |   0.0001%

Incoming average:   0.0796    Median   0.0000    Standard deviation   0.9168
Here, I employ a script named modsec-positive-stats.rb, which I released on the netnea website as well. It takes the anomaly scores from STDIN and runs several statistics on them. You get various percentages, the average score, the median and even the standard deviation.
Let’s concentrate on the second column for now: it gives us the distribution of the incoming anomaly scores. Now that we have the numbers, we can visualize them:
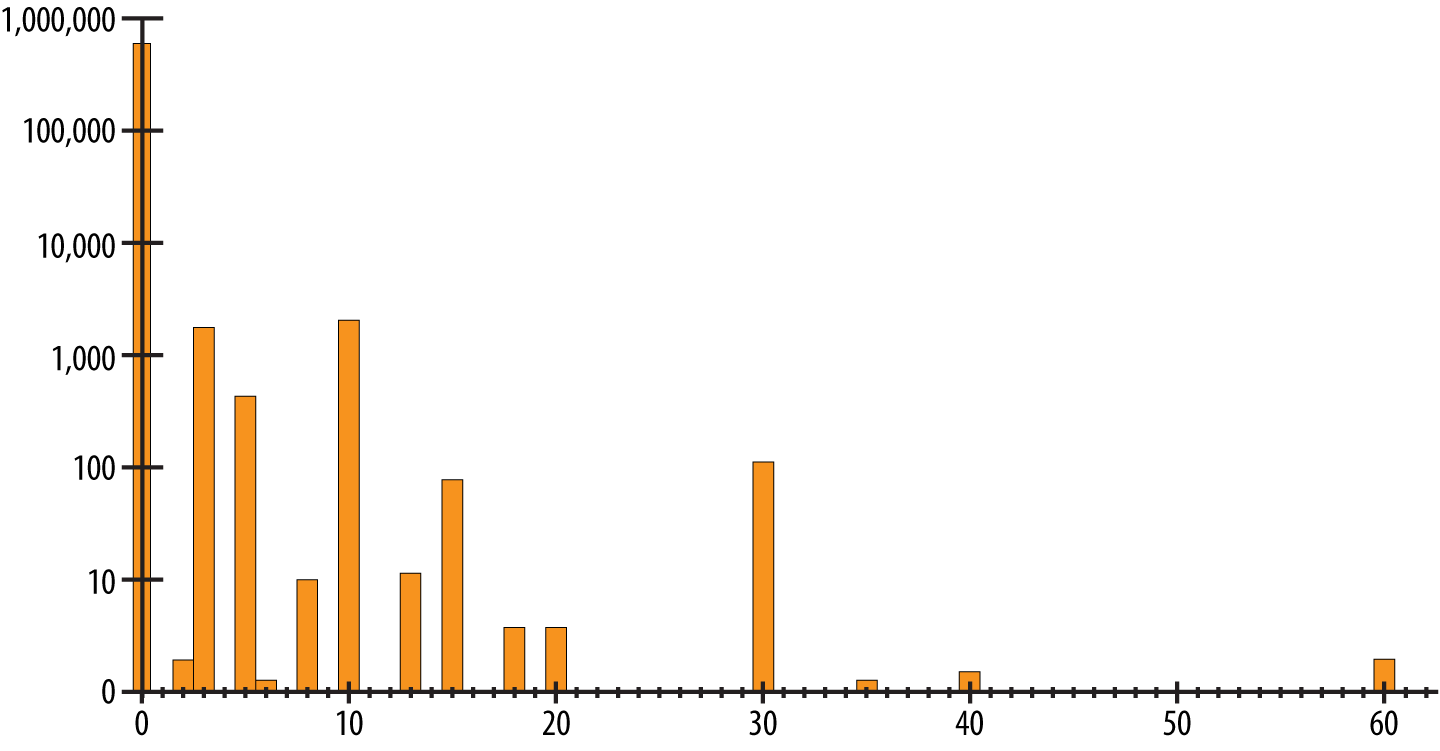
We get a very bumpy curve stretching to the right in a long tail. The highest number of requests had an anomaly score of 0. This is where all the requests passing the rule set without any alerts are being recorded. To the right of this position are the requests that triggered one or several alerts.
The further to the right we go, the higher the scores. You could say these were the most suspicious requests. More to the left, with the lower scores, we see the requests that triggered only one or two rules. Maybe these are not even critical rules, but those with a more informative bent—like a missing Accept header and such.
As you know, the Core Rule Set is an anomaly scoring rule set. Requests are first passed through all the rules and the anomaly scores are tallied. We then compare the accumulated anomaly scores to the anomaly threshold. The default threshold is at 5, which means a single critical rule alert will lead to a blocking of the request. This is how we want it to be in a secure setup.
Actually, we can change this limit if we want to. And during the integration process, this actually makes a lot of sense. If we put the limit to 10,000 (yes, I have seen scores of 10,000 in production systems), we can be sure that no legitimate request will ever be blocked by the Core Rule Set. That way, we can examine the rule set and our service, in production with real-world data, and start to tune away the false positives.
The goal is to lower the anomaly scoring threshold to 5, but let’s not try to do this in a single step. It is better to go from 10,000 to 100, then to 50, to 20, to 10, and then to 5.
If we take that path, what stands in the way of taking the first step and setting the anomaly limit to a lower value? Take a look at the graph in Figure 1 again. If we were to put the anomaly threshold to 50 in that graph, we would block the requests with a score of 60. So, if we want to lower the limit, we better handle these requests and all the other requests that have a score higher than the target limit.
We do not need to look at the vast number of remaining false positives immediately—often an intimidating sight. Instead, we concentrate on the handful of requests with the highest anomaly scores as a start. And if we have identified these, we can filter for the alerts that caused these high scores. We can do this with the help of the unique identification that is part of the ModSecurity alert message.
$> grep 980145 error.log | grep "Incoming Anomaly Score: 60\"" | melunique_id > ids
And then use these unique IDs to filter those alerts that lead to the the aforementioned score:
$> grep -F -f ids error.log | melidmsg | sort | uniq -c | sort -n
  8 941140 XSS Filter - Category 4: Javascript URI Vector
 12 932130 Remote Command Execution: Unix Shell Expression Found
 12 941210 IE XSS Filters - Attack Detected.
 16 941170 NoScript XSS InjectionChecker: Attribute Injection
We can then tune away these false positives and put ourselves in a position to lower the anomaly threshold with a high assurance that no legitimate customer will be blocked. If you are new to this, there is no rush. Tune away some false positives and then let the adjusted ruleset run for a few days.
With time, you are ready for the next iteration: to tune away the false positives that stop you from lowering the limit even further. When you look at these requests, you will make a surprising discovery. The first tuning iteration also reduced the number of requests that you have to examine in the second round.
If you think about this for a moment, it makes perfect sense. Many of the rules causing the highest scores are the same rules causing the mid-range scores. So, if we handle the first batch of rules that lead to the highest scores, the second iteration of tuning only has to treat those false positives that were not present in the highest-scoring requests.
This whole method allows you to structure the tuning of your rule set to get rid of the false positives. What looked like an insurmountable summit has been reduced to a series of lower, doable hills. You can take them one by one, typically solving five to 10 false positives in a given iteration. (If it’s more, take smaller steps.)
Picking the right false positives to handle is no longer a guessing game, and you will be able to lower the anomaly score threshold quickly. You are thus improving the security of your site from the moment you lower the anomaly limit. (Substantial protection only begins with a threshold of 20 or lower, in my experience).
The tuning process in a nutshell
Let me summarize this approach to the handling of false positives. We always work in blocking mode. We set the anomaly threshold to a very high number initially and work through several iterations:
- Look at the request with the highest anomaly scores and handle their false positives
- Lower the anomaly score threshold to the next step
- Rinse and repeat until the anomaly score threshold stands at 5
I usually call this the iterative approach to false positive tuning. Some people call it the Folini Method, as I seem to be the only person teaching courses using ModSecurity and the CRS this way.
This technique has been used by many people for several years in a very successful way on Apache. I highly recommend you give it a try on your NGINX ModSecurity / CRS setup.
Links:
- OWASP ModSecurity Core Rule Set (CRS)
- BIG Cheatsheet Download
- Apache / ModSecurity Tutorials
- NGINX Plus Admin Guide and Tutorial
This post is a collaboration between O’Reilly and NGINX. See our statement of editorial independence.