
 Timeline of lighting technology. (source: Maurice Dessertenne on Wikimedia Commons)
 In previous posts, I wrote about the need for insight generation and provided an example of an insightful application. I maintain that insightful applications are the key to businesses effectively exploiting big data in order to improve decision-making and address important problems. To better understand and appreciate the need for developing such applications, it is important to consider what is happening more broadly in big data and evaluate how our experiences with business intelligence systems should be driving our thinking about insightful applications.
Because I consider insightful applications the next inflection in big data (see recent examples of such applications built using IBM’s Watson platform), I would like to further explore this topic in a series of blog posts. In this first post, I will provide my observations on how data analysis has evolved over the past 25 years, particularly as we moved to big data, and is necessitating the development of insightful applications. In the second post, I will describe such applications in more detail and provide early examples. In the third and final post, I will discuss investor interest in insightful applications and describe my recent investments in startups in this space. In these posts, I will draw upon my 30-year experience as an entrepreneur and founder of two analytic applications startups, and also as a venture capitalist who has been investing in this area for the past 15 years.
Data analytics over the past 25 years
As the volume of data has grown over the past 25 years, data comprehension for decision-making has consisted of the same two steps: creating the data warehouse and understanding the contents within the data warehouse.
The data warehouse and all its incarnations—enterprise data warehouse, data mart, and so on—is essentially an infrastructure of curated data. This data may come from a single data source (e.g., the database of a CRM application) or by integrating a variety of data sources (e.g., integrating the database of a CRM application with a database containing the social media interactions of each customer in the CRM database). This data may be structured (e.g., currency data describing the amount paid by each customer), unstructured (e.g., notes about each interaction between a customer and a service employee in free text form), or semi-structured (e.g., log data generated by a network router). Curated data is data that, once captured, is cleaned, tagged, and profiled both automatically and, more often than people would like to think, manually.
Over the years, we have reduced data warehousing costs through the growing use of open source software, cloud computing, and commodity hardware, while improving our ability to manage more data of greater variety that is created at a higher velocity. We’ve moved from data warehouses costing tens of millions of dollars and being afforded only by the largest corporations, such as financial services institutions like Citibank and retailers like Walmart, to warehouses becoming more affordable to small and mid-sized corporations. More recently, low-cost offerings such as Amazon Redshift, Google BigQuery, and even Microsoft Azure, have moved data warehousing to the cloud. Finally, data warehousing is accessible to the corporate masses.
With the rise of data warehouses, delivery of data analysis reports has shifted from print to digital.
The second step in data comprehension involved understanding the data warehouse’s contents through data analysis. In business settings, this was often done through reports and associated visualizations, while occasionally using more bespoke visualizations and machine learning algorithms such as neural networks. (Machine learning is not new, as some believe, but rather has been used almost since the time data warehouses appeared as data storage and management tools.)
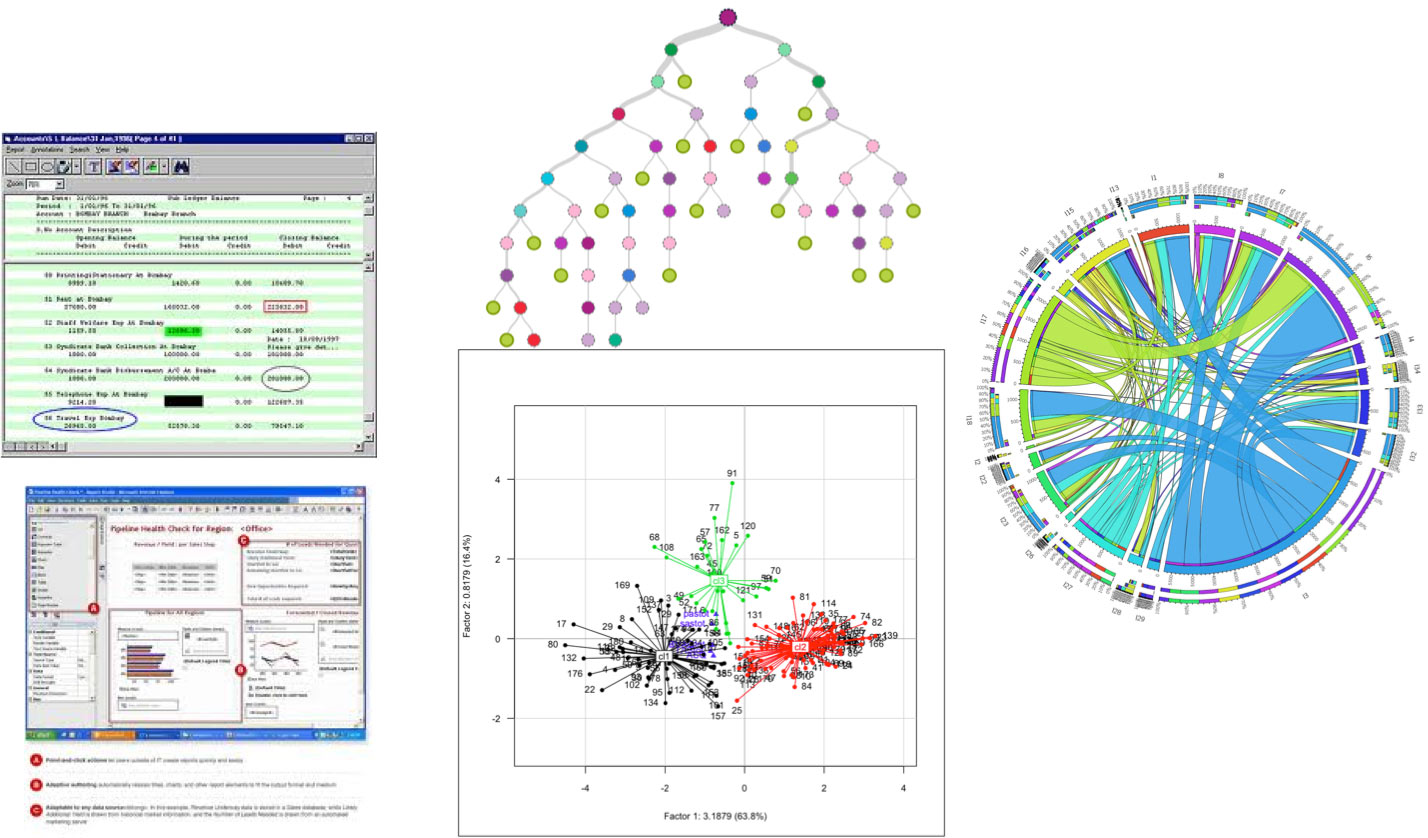
As data warehouses became adopted by a broader set of corporations from a variety of industries, we saw a shift in the form of the reports that could be created, in the medium through which reports were presented to analysts and decision-makers, and also in the personnel that would prepare these reports. In the early days (late 80s, early 90s), business intelligence reports were created by specialized IT personnel that were also formulating and issuing to data warehouses the queries necessary for these reports. These reports were canned (i.e., they could be modified, but with great difficulty and only by the same specialized IT personnel that created them) and presented on computer paper. Later on, while still canned, these reports were presented on PCs through specialized reporting programs, and then later on, Web browsers running on a variety of devices, including (most recently) smartphones and tablets. Over the years, the task of query creation and report writing migrated away from IT personnel to business users. However, while queries and associated reports were becoming faster, more flexible and widely used, the primary users of these reports—business analysts—continued to struggle to determine the simplest patterns in the breadth of information included in such reports. Most importantly, these users struggled to determine what actions to take based on the information included (see examples in Figure 1).
As more data has been generated, we have become better managing it cost effectively, but still struggle to efficiently analyze it.
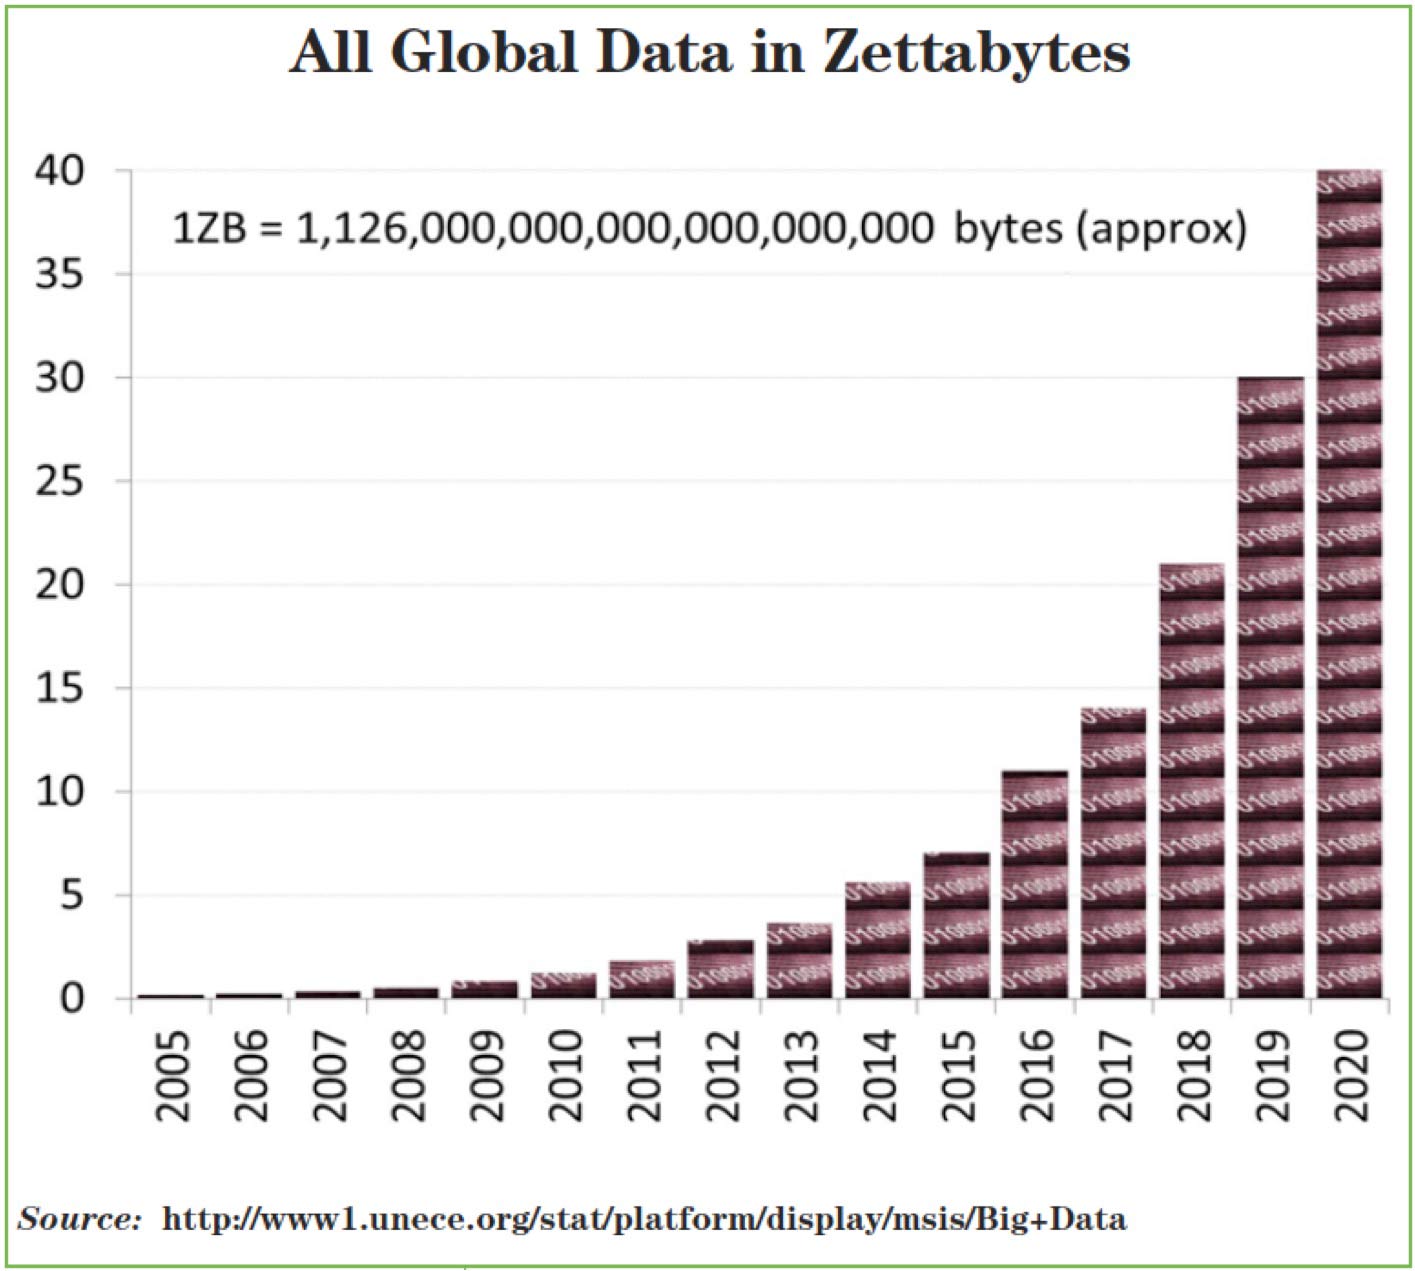
Driven by the broadening global use of the Internet, the connectivity the Internet affords, new areas like the Internet of Things that yield data in volumes we’ve never seen before, and the applications that are being created to capitalize on this use and connectivity, we find ourselves awash with data. Fast data and slow data, simple data and complex data, and all of it in unprecedented volumes. How much bigger has the data become? We have grown from generating approximately 5 zettabytes of unstructured data in 2014 to a projected approximation of 40 zettabytes of unstructured data in 2020 (see Figure 2).
During the last 10 years in particular, while the data became bigger, the core of corporate IT strategy became “do more with less.” Corporations started to face two problems with their data warehousing systems. First, some of these systems could not effectively manage the big data that was being captured, so applications could not use it effectively. Second, costs were becoming prohibitively high, even for the systems that could rise to the data management challenge.
Around this time, a partial solution started to emerge when a new generation of data management software, such as Hadoop, was developed by heavyweight tech companies such as Google, Yahoo, and others. From the beginning, this software ran on commodity hardware and was quickly open-sourced, thus enabling corporations to address some of their big data issues at a lower cost. Companies like Cloudera, Hortonworks, and a few others that offer services around open source software have since become important players in the big data infrastructure space. I call the solution “partial” because, while managing data, these systems did not have all the features of the sophisticated, proprietary data warehouse management systems used by corporations. But these new systems were good at building data lakes, which suit the diverse big data environment, and for replacing or augmenting certain types of data warehouses with lower-cost alternatives.
While our ability to manage big data cost effectively may have been improving, our ability to analyze the data, at any cost, was not. While the popular press declared that insights from data would be the new oil (or gold, pick your metaphor), the market research firm IDC predicted that by 2020, only a fraction of the data that would be collected would be analyzed. We needed to analyze more of the data we captured and extract more of the information it contained.
We are working to improve our ability to analyze data, but face a shortage of data professionals.
In order to collect and analyze more data, without giving up on reports, we started employing more broadly the automated information-extraction approaches offered by machine learning and other AI-based data analysis techniques. However, these approaches required the use of a new type of specialized personnel—the data scientists. And even though we are seeing a surge in the number of data scientists in the workforce, we need more, and it is unlikely that we will ever be able to produce as many data scientists as we will need, given the data we are generating. McKinsey has estimated that by 2018, the U.S. will face a shortage of people (a roughly 140K-190K deficit) who possess the deep analytical skills required to extract insights from collected data. We will also be short roughly 1.5 million managers who possess the quantitative skills necessary to make important business decisions based on big data analyses produced by data scientists.
Machine learning has improved our ability to find correlations in data, even as time to decision is decreasing and data velocity is increasing.
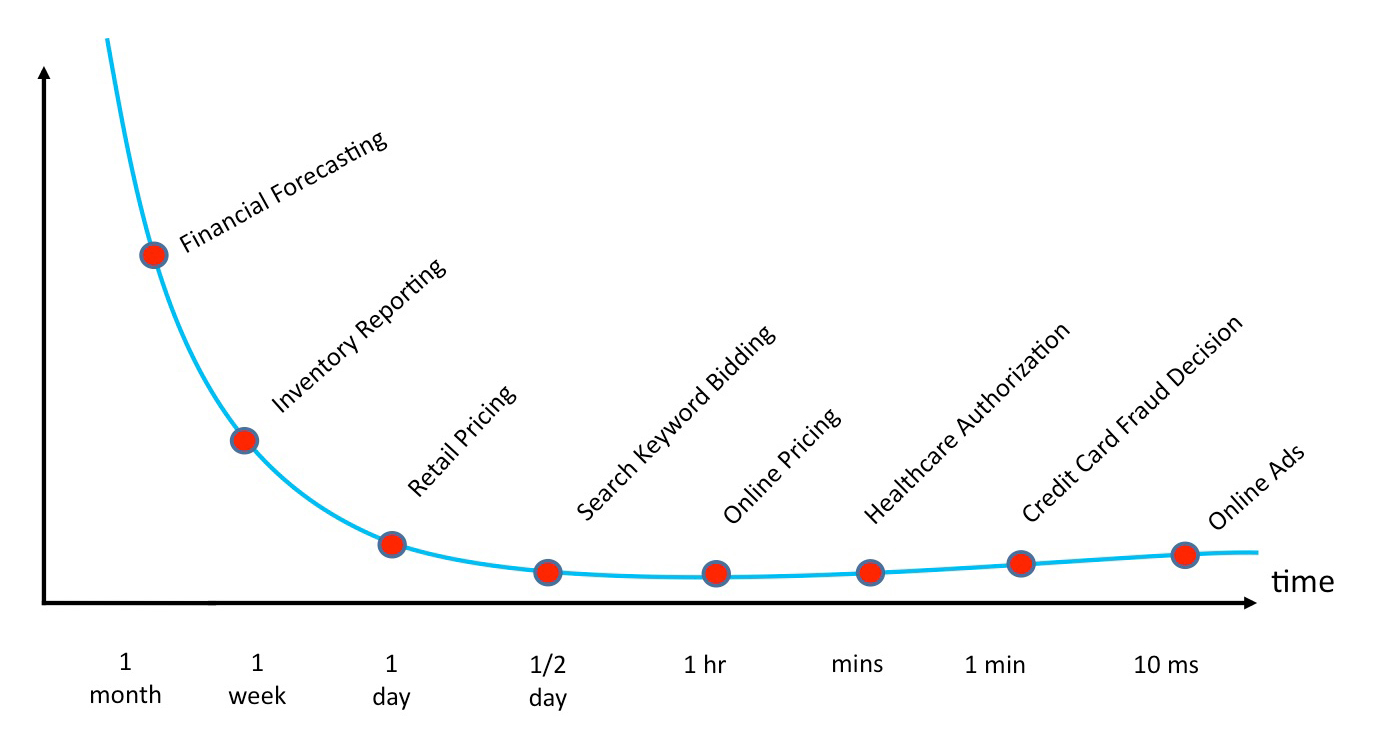
Business intelligence as a field has been around for almost 40 years. Statistical analysis and machine learning techniques have been used for even longer than that. During this period, we have been improving our ability to identify correlations in data sets, even as the time to making a decision is decreasing and the data velocity is increasing. For example, corporate CFOs may have a month to create a financial forecast, whereas an automated online advertising platform has only 10 milliseconds to decide which digital ad to show to a particular user (see Figure 3). Also, while a CFO may be able to arrive at a decision referencing only a few gigabytes of data, the online advertising system has to work with terabytes of data, most of which is generated in near-real time.
In some application areas, simply identifying correlations among data sets is sufficient for decision-making. And in a few of these areas that are high value with high return on investment, it may always be necessary and justified to use data scientists and other specialized personnel to extract information from a body of available data. Computer security threat detection and credit card fraud detection are two such areas. In these areas, the time to make a decision is very short, and the cost of making the “wrong” decision (by being overly conservative), at least initially, may not be extremely high. The cost of flagging a transaction as fraudulent or a behavior as a security intrusion is also low (i.e., an inconvenience for the cardholder in the first case and some network forensics for a systems administrator in the second). But, the cost of failing to detect anomalies in an established pattern of behavior can be much higher.
To keep up with big data and improve our use of information, we need applications that will quickly and inexpensively extract correlations while associating insights with actions.
Given the expected shortage of data scientists and business users with strong quantitative skills, and our desire to continually exploit the high volume of data that is collected and managed, we need to become better at developing analytic applications that can generate insights and associated actions. Such applications, which I call insightful applications, go beyond the extraction of correlations from data.
We have made great progress in terms of data comprehension. We have decreased the cost of managing big data while improving our ability to analyze and extract the key information. But, the growth of big data is so massive that we will not be able to keep up through faster or more flexible queries and report-writes alone. We need to be able to create actionable insights inexpensively and quickly, particularly through the use of insightful applications. I will explore this topic more fully in the next post.