Jay Jacobs on the importance of statistical literacy in security
The O’Reilly Security Podcast: Statistical literacy, machine learning, and data visualization.
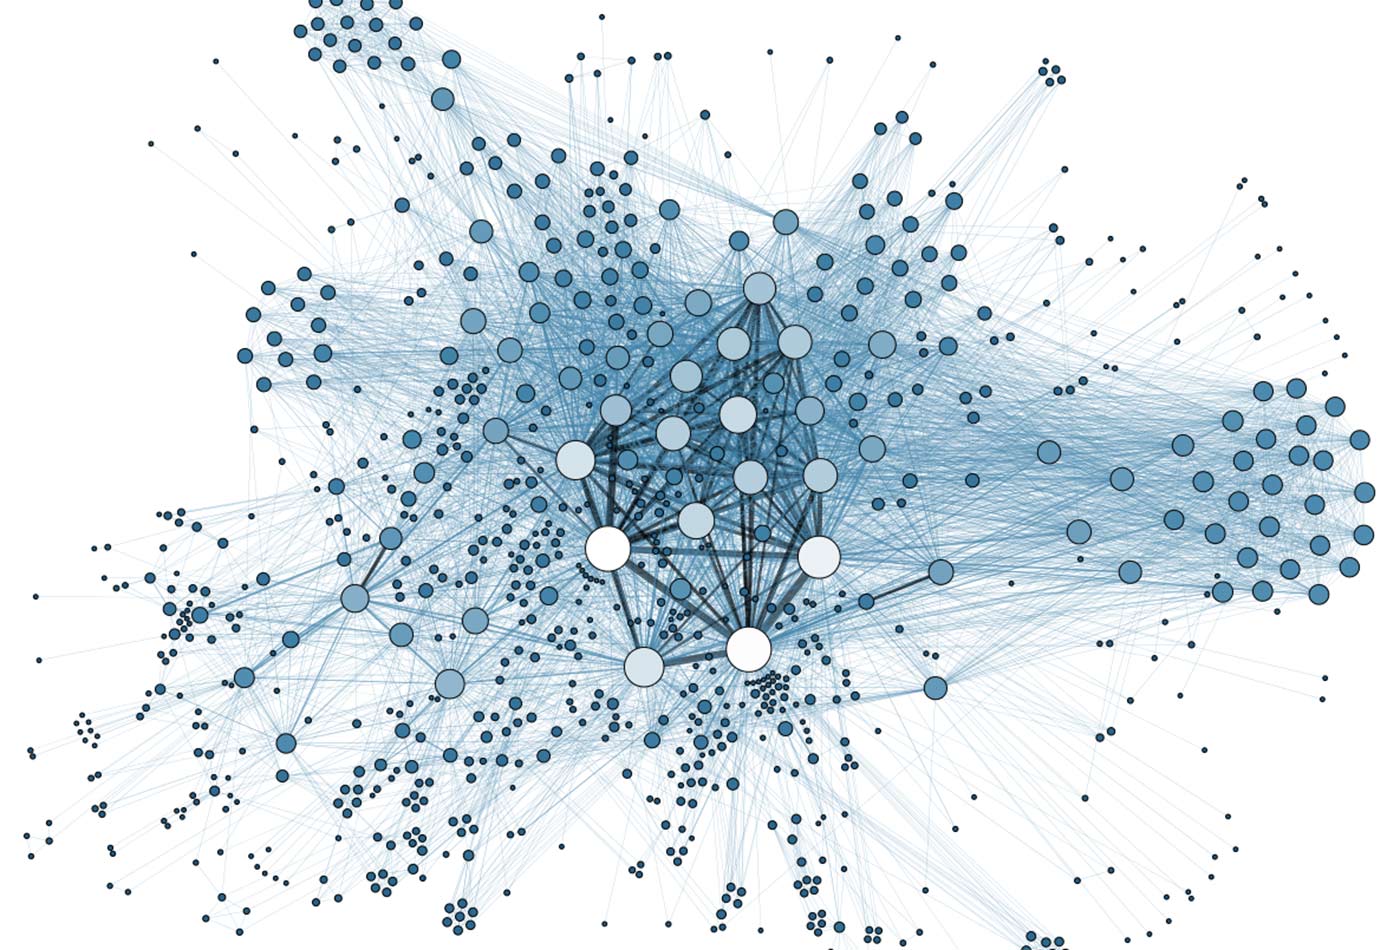 Graph representing the metadata of thousands of archive documents, documenting the social network of hundreds of League of Nations personals. (source: Martin Grandjean on Wikimedia Commons)
In this episode of the Security Podcast, I talk with Jay Jacobs, senior data scientist at BitSight. We discuss the disparity between intuition and analytics in data science, the limitations of unsupervised machine learning, and the challenges of creating effective data visualizations.
Here are some highlights:

Learn faster. Dig deeper. See farther.
Intuition vs. analytics
It comes down to this battle between intuition versus data analysis. We’ve been a very intuitively driven industry. The challenge with that is that in a complex environment, our intuition can be easily fooled. Not to say that intuition isn’t valuable. There’s a huge value in intuition and expertise in our industry. At the same time, if we really want to understand what’s going on, we have to take a step back and actually start to collect data and make sense of that data.
The limitations of unsupervised machine learning
Unsupervised machine learning means that you’re collecting data, network data for example, and you’re just reviewing it for anomalies. The problem, though, with security and simple anomaly detection is that an anomaly does not necessarily represent a bad security event. It simply means something is weird. Any sort of anomaly can trigger that. The big problem is that you cannot evaluate a false-positive because you have nothing to measure it against. You have no idea how effective anomaly detection is unless you can go through and determine which anomalies were indicative of a security event and which weren’t. That’s a very difficult thing to do. It’s more beneficial when you can actually run some training algorithms and say this is correct 99% or 80% of the time.
The value of starting data analysis with the right questions
On a research question, you just want to identify what you want to know. Many times we’ll start with the data. A better option is to start with a question. If you’re working on a red team or doing pen tests, just start with the question of how much more efficient this is versus that. Or, how many of these activities are we coming across? Make sure that the answer is measurable and that someone cares about the answer. The problem is that when people start with data, they start graphing it and showing things that aren’t important. They started with the data and then tried to figure out what value is in that data.