Mapping big data
A data-driven market report.
This report will analyze the “big data” market space, using social network analysis (SNA) of the network of partnerships among vendors. It’s the first of its kind—this market report is entirely data driven.
In this report, we collect data from the Web, analyze it to produce insight, and interpret insight to produce market intelligence. Our data comes from partnership pages on vendor websites. The primary analytic tool in our toolbox is social network analysis.

Learn faster. Dig deeper. See farther.
The primary tenet of network analysis is that the structure of social relations determines the content of those relations.
—Social Network Analysis: Recent Achievements and Current Controversies
Please note that many of the images in this report are complex and difficult to view in print. We encourage you to download the free ebook version of this report, where you can zoom-in and view each figure in detail.
Questions
In this report, we’ll ask and answer the following questions:
-
Who are the major players in the big data market?
-
Who is the leading Hadoop platform vendor?
-
What sectors make up big data, what are their properties, and how do they relate?
-
Which partnerships are most important? Who is doing business with who?
About Relato
This report was created by Relato. Founded in January 2015 by CEO Russell Jurney, Relato maps markets to drive sales and marketing by discovering new leads and unexplored market segments. The Relato platform lets you explore the markets you sell in to discover new opportunities. The Relato platform is powered by your Customer Relationship Management (CRM) system and delivers new leads that convert and new sectors to go after.
You can see Relato in action in Figure 1-1. A demo of our lead-generation platform is available at http://demo.relato.io
The Role of Hadoop in Big Data
Big data has become a term that can mean almost anything, but if we focus on what is disruptive about the emergence of the trend toward large-scale data retention and processing, a definition becomes clearer. Big data is a market that arose from movements toward large-scale data collection, aggregation, and processing that resulted directly from the development of Hadoop at Yahoo.
Hadoop was originally made up of the Hadoop Distributed File System (HDFS) and its execution engine, MapReduce. Based on published work from Google, Hadoop was the first popular system capable of cheaply storing and processing petabyte-scale data.
With Hadoop, for the first time, vast quantities of data could be cheaply stored on commodity PC hardware and processed rapidly with MapReduce. Large-scale disk systems existed before HDFS, but the cost per gigabyte of optical and network-attached storage systems was much higher, and I/O was severely bottlenecked. HDFS made storing and processing big data feasible, and the big data market emerged as a result.
In the market today, Spark is eclipsing MapReduce by offering faster data processing at scale. But this actually makes HDFS more important than ever. It is the high availability and high input/output of HDFS, resultling from the use of local disks, that makes Spark possible.
Defining the Market
In this report, we define the entire big data market as those companies having published partnerships directly with one of the hadoop platform vendors, or indirectly with a partner of the hadoop platform vendors: Cloudera, Hortonworks, MapR.
This represents a snowball sample and a 2-hop network. A snowball sample is where you start with one node and find the nodes it links to. Then you repeat the process on those connected nodes. You repeat this process until you have a large enough sample. A 2-hop network means a node, its connections, and its connection’s connections, or two hops out from the original node(s). Our dataset is a snowball sample, and a 2-hop network. This means we started with the four Hadoop vendors, and mapped their partnerships, then starting with these partners, we mapped the partners’ partnerships.
This data was collected and validated from company web partnership pages. Data collection occured between April and June 2015. This includes 13,991 unique companies, with 20,645 partnerships between them. This sample was then paired down, using k-core decomposition and structural role extraction, to a set of the 307 most-important big data vendors. These vendors have 3,428 partnerships between them.
Ranking Hadoop Platform Vendors
There are three Hadoop platform vendors: Cloudera, Hortonworks, and MapR. While we focus on these three, we also include metrics for Pivotal when they are illustrative. Pivotal adopted the Hortonworks Data Platform (HDP) as the core of its Hadoop distribution in February 2015. Pivotal HD is now based on HDP.
Note
It may make sense to combine metrics for Hortonworks and Pivotal, but it is not clear how this should be done and so metrics are listed seperately.
Hadoop Commercial History
Hadoop was invented, founded, and developed by researchers at major players in the consumer Internet space that struggled to process a new class of data called web-scale data. In the beginning there were two academic papers from researchers at Google: The Google Filesystem in October 2003 followed by MapReduce: Simplified Data Processing on Large Clusters in December 2004.
Struggling with processing the data generated by its vast online presence, Yahoo read the work of Google, and got to work on Hadoop in early 2006, as an open source project governed by Apache and started by Doug Cutting. The Apache license is commercially permissive, and was essential to Hadoop’s commercial success. Facebook was an early adopter of and contributor to Hadoop when scaling its Oracle data warehouse became cost-prohibitive. Facebook developed a high-level language (SQL) tool for Hadoop called Apache Hive, which was a complement to Yahoo’s high-level tool Apache Pig. Natural language search startup Powerset developed HBase on top of Hadoop, based on a November 2006 paper from Google researchers: Bigtable: A Distributed Storage System for Structured Data.
The first Hadoop company was Cloudera, founded in October 2008 by Yahoo, Facebook, Google, and Oracle alumni. Cloudera contributed to the open source development of Hadoop and related projects, and developed the first commercial Hadoop distribution, Cloudera Distribution Including Apache Hadoop (CDH). CDH included Cloudera Manager, a management tool with a commercial license that simplified the setup and operation of Hadoop clusters. Engineers employed at Cloudera started several Apache projects, including Apache Avro, Apache BigTop, Apache Crunch, Apache Flume, Apache Oozie, Apache Sqoop, Apache Parquet, and Apache Whirr. Cloudera also developed the open source SQL-on-Hadoop offering, Impala.
MapR was founded in 2009 by Google alumni to create a commercially licensed, API-compliant rewrite of Hadoop. MapR’s Hadoop distribution addressed many shortcomings of Apache Hadoop and Apache HBase with a C-based rewrite of both services. MapR employees started the Apache Drill and Apache Myriad projects.
Hortonworks was founded in 2011 by original members of the Yahoo Hadoop and Pig teams. Hortonworks developed a completely open source, Apache-licensed distribution called the Hortonworks Data Platform (HDP). Hortonworks created an open-source counterpart to Cloudera Manager called Apache Ambari. Hortonworks employees started several Apache projects, including Apache Tez, Apache ORC, Apache Atlas, Apache Ranger (by acquisition of XASecure), Apache Calcite, and Apache Knox. They are also responsible for the Stinger initiative that improved the performance of Apache Hive.
Traditional Metrics
We begin by ranking the Hadoop platform vendors by the traditional metrics of capital raised, customer count, quarterly revenue, and employee count.
| Company | Capital Raised | Customer Count | Revenue ($millions) | Employee Count |
|---|---|---|---|---|
|
Cloudera |
1041 |
525 |
Unknown |
800+ |
|
Hortonwoks |
376.9 |
437 |
30.7 |
750+ |
|
MapR |
174 |
700+ |
Unknown |
300+ |
Cloudera leads in terms of employee count and capital raised, followed by Hortonworks and MapR. Cloudera raised a record $900 million from Intel in March 2014. Hortonworks’ December 2014 IPO raised $100 million. MapR has raised $174 million.
In contrast to the aforementioned metrics, customer count ranks MapR first, followed by Cloudera and Hortonworks. MapR has a closed source, commercial license, whereas Cloudera and Hortonworks have open source licenses. Commercial licenses encourage users to engage with the vendor and become customers in situations where they might simply download and use the open source offering, were one available.
Centrality Analysis
We will be measuring Hadoop platform vendors in terms of centrality. Centrality is a way of measuring how central or important a particular node is in a social network. In our network, nodes are companies, and links are partnerships. These partnerships define networks of collaboration. Customers traverse this partnership network when purchasing solutions, as their business flows from one company to its partners in one or more hops.
Partnership networks also indicate standing or prestige in the market. A company is more prestigious if it has many prestigious companies advertising their partnership with that company on their partnership web pages.
We’ll be examining both deal-flow and reputation with centrality measures. Different centrality measures have different interpretations or meanings. Therefore, in order to measure these two related concepts, we will employ multiple centrality measures.
In-Degree Centrality
In our network, in-degree centrality is a direct count of the number of companies that advertise their partnership with a given company on their partnership pages. This is a good measure of the standing or reputation of a company. Put simply, the more people that say they like you, the more well-liked you are.
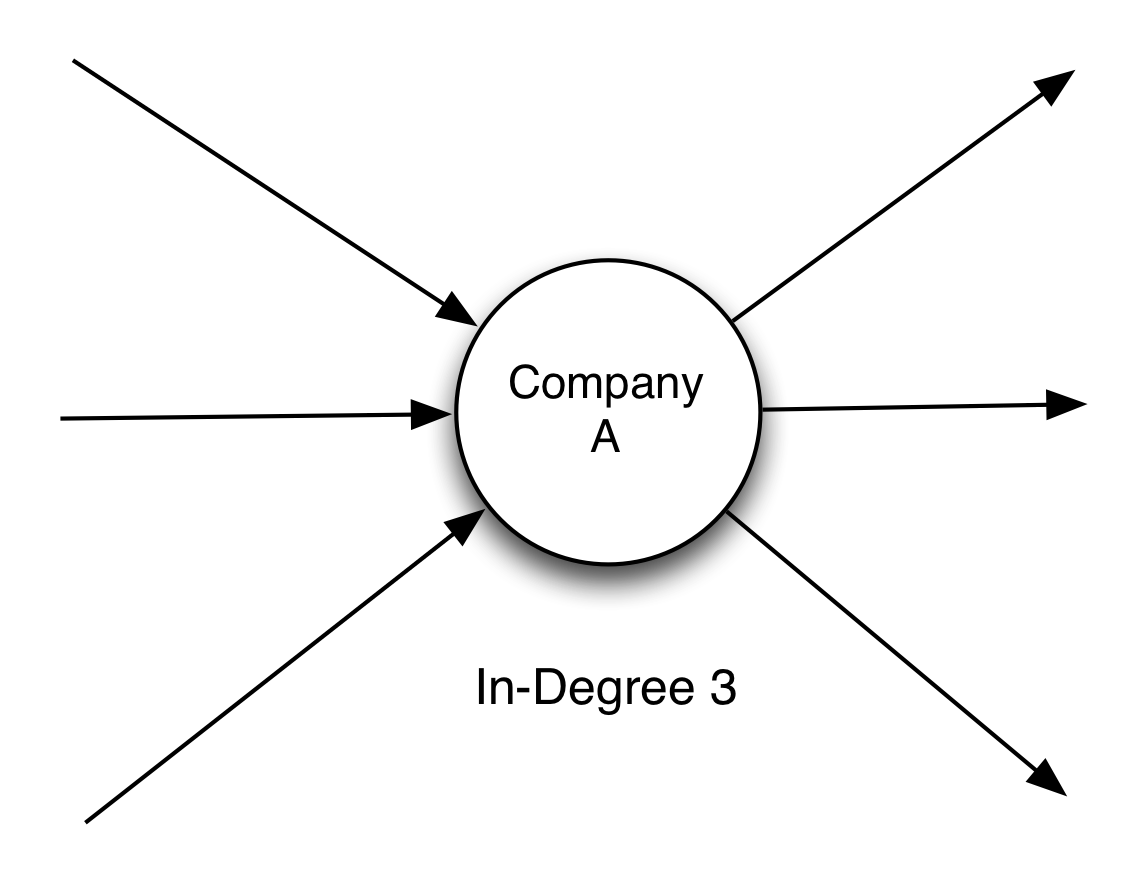
For example, in Figure 1-2, Company A has an in-degree of 3.
In-degrees of the hadoop platform vendors are shown in Table 1-2.
| Company | In-Degree |
|---|---|
|
Cloudera |
176 |
|
Hortonworks |
147 |
|
MapR |
124 |
|
Pivotal |
51 |
Cloudera leads with 176 in-bound partnerships, followed by Hortonworks with 147 and MapR with 124. For comparison, Pivotal trails with 51. This approximates the relative standing, reputation, and prestige of the Hadoop platform vendors in the big data market.
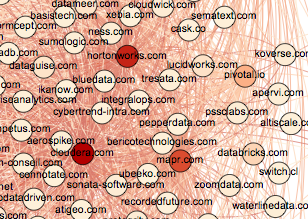
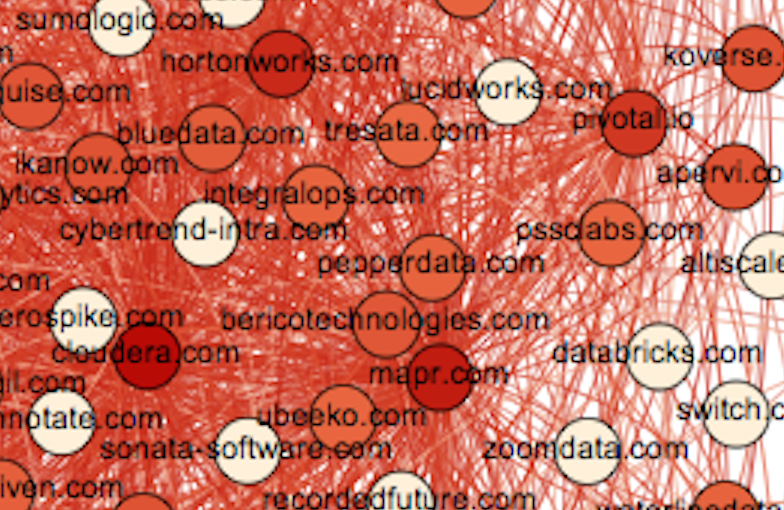
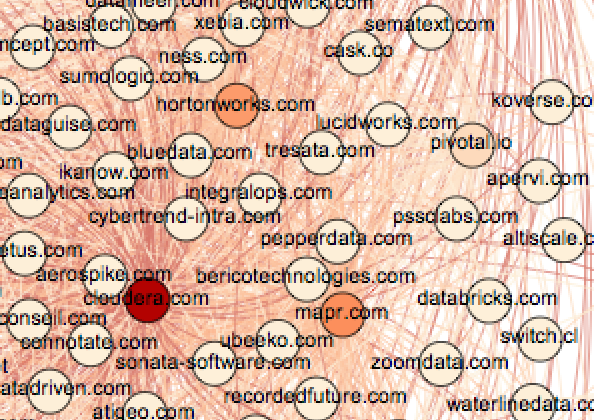
In the network diagram in Figure 1-3, the in-degree centralities of the major players in the big data market are color-coded from low to high from white to red. You can zoom in repeatedly on this PDF to read the company names from the larger image. Figure 1-4 shows a zoomed-in view of the hadoop vendors.
Closeness Centrality
Closeness centrality considers the connections of a node to all other nodes in the network. Closeness centrality is an indicator of a companies’ prominence in terms of communication efficiency, or how easily a company can communicate with the broader market. Higher closeness scores mean more efficient communication with the rest of the market. Efficient communication with the market indicates a higher standing in the market.
Closeness centrality results are in Table 1-3:
| Company | Relative Closeness |
|---|---|
|
Cloudera |
.559 |
|
MapR |
.527 |
|
Hortonworks |
.501 |
|
Pivotal |
.467 |
Note
Raw closeness scores have been divided by the maximum closeness score to give relative closeness. Scores are a fraction of the maximum closeness score in the network.
Cloudera leads MapR and Hortonworks by a slim margin, with Pivotal trailing slightly behind. This measure indicates that all vendors communicate well with the market—no one vendor outvoices another by much.
Closeness centrality is visualized in Figure 1-5 and Figure 1-6.
Betweenness Centrality
Betweenness centrality indicates the influence a node exerts over the interactions of other nodes. In this case, betweenness centrality measures the effect one vendor has on the dealflow of other vendors.
Betweenness centrality values are in Table 1-4.
| Company | Relative Closeness |
|---|---|
|
Cloudera |
1.00 |
|
MapR |
.477 |
|
Hortonworks |
.432 |
|
Pivotal |
.110 |
Betweenness centrality for the Hadoop vendors differs substantially from in-degree and closeness centrality. Cloudera is well ahead of MapR and Hortonworks, which are similar. It may be said that Cloudera exerts influence on the deals of Hortonworks and MapR more than they influence deals with Cloudera. Pivotal’s influence on other company’s deals is minimal.
Betweenness centrality is visualized in Figure 1-7 and Figure 1-8.
Centrality Conclusion
We ranked Hadoop platform vendors by three centrality measures: in-degree, closeness, and betweenness centrality. In-degree centrality indicated Cloudera leads Hortonworks which leads MapR in terms of reputation. Closeness centrality indicated near parity among the three vendors in terms of communicating with the market. Finally, betweenness centrality indicated Cloudera has a commanding lead in terms of influencing deals.
Taken along with the traditional metrics, this gives a more nuanced understanding of who leads the Hadoop market. Cloudera leads in all categories save customer count, with Hortonworks and MapR fighting for second place. In-degree and closeness centrality indicate neck-and-neck competition for influence. Betweenness centrality indicates Cloudera is the go-to vendor when considering a Hadoop platform.
Examining Partnerships
We can reach a better understanding of Hadoop platform vendors by examining their partnerships. We used a measure called dispersion to rank a vendor’s connections by their importance.
Dispersion measures the degree to which a node’s neighbors have overlapping networks of their own. In other words, dispersion measures how connected a company’s connections are to one another. More shared connections results in a lower dispersion score, whereas fewer connections results in a higher dispersion score. Higher dispersion means more potential in the partnership because it opens new market share to the participants. Using dispersion, we can examine the most important partnerships between companies in the big data space.
Listed in Table 1-5 are the top 10 partners for each Hadoop platform vendor, ranked by dispersion from high to low.
| Vendor | Top 10 Partnerships |
|---|---|
|
Hortonworks |
Pivotal, MongoDB, Teradata, DataStax, Tableau, Actuate, Informatica, CSC, Splunk, Rackspace |
|
Cloudera |
MongoDB, Teradata, Canonical, Tableau, Cognizant, EPlus, Eucalyptus, DataStax, World Wide Technology, CSC |
|
MapR |
Amazon Web Services, Tableau, MongoDB, Teradata, Talend, Canonical, OnX, Jaspersoft, NetApp, Actian |
MongoDB, Tableau, Teradata, and DataStax rank highly for all vendors. MongoDB, Cassandra (DataStax), and Teradata are complementary technologies to Hadoop. Tableau connects the Hadoop vendors to the broader Analytics Software market segment (we’ll discuss market segmentation below). Hortonworks’ values for Pivotal (which recently adopted Hortonworks HDP) and Teradata are essentially endorsements of these strategic partnerships.
Overall dispersion scores for the Hadoop platform vendors are depicted in Figure 1-9.
Partnership Network Overlap
The extent to which nodes share neighbors is a metric for determining the overlap of the connections between two nodes. This tells us how similar the partnership networks of two companies are. Hortonworks’ network overlaps with Cloudera and MapR’s network by 54% and 42%, respectively. Hortonworks’ partners seem to span or bridge the partner networks of Cloudera and MapR, which are themselves more distinct. Cloudera and MapR overlap each other and Hortonworks between 30% and 35%.
Segmenting the Market
Market segmentation is a technique to understand the cohesive segments or groups of companies that make up its distinct parts. Segmentations are often done manually, using human observation and insight alone. In this case, the market was segmented algorithmically via graph clustering.
The market split into the following groups:
-
Old Data Platforms
-
Servers (hardware and software components)
-
Analytic Software, New Data Platforms
-
Enterprise Software
-
Cloud Computing.
In Table 1-6, the top companies per market segment, ranked by pagerank, illustrate the kinds of companies in that segment.
| Cluster | Company |
|---|---|
|
Old Data Platforms |
IBM, Microsoft, Oracle, Dell, Netapp |
|
Servers |
Intel, SUSE, MSC Software, NVidia, Redline Trading Solutions |
|
Analytic Tools |
Tableau, Teradata, Informatica, Talend, Actian |
|
New Data Platforms |
Cloudera, Hortonworks, MapR, Datastax, Pivotal |
|
Enterprise Software |
HP, SAP, Cisco, VMWare, EMC |
|
Cloud Computing |
Amazon Web Services, Google, Rackspace, MarkLogic, New Relic |
The market as a whole, with segments applied, is shown in Figure 1-10:
Market Relationships
By measuring connectivity between segments of the market, we can determine how one market segment interacts with another. This helps us understand the relationships between markets. For instance, does a market segment connect more heavily to certain other segments? Is there a difference in how much two market segments link back and forth? These measurements yield the following business insights:
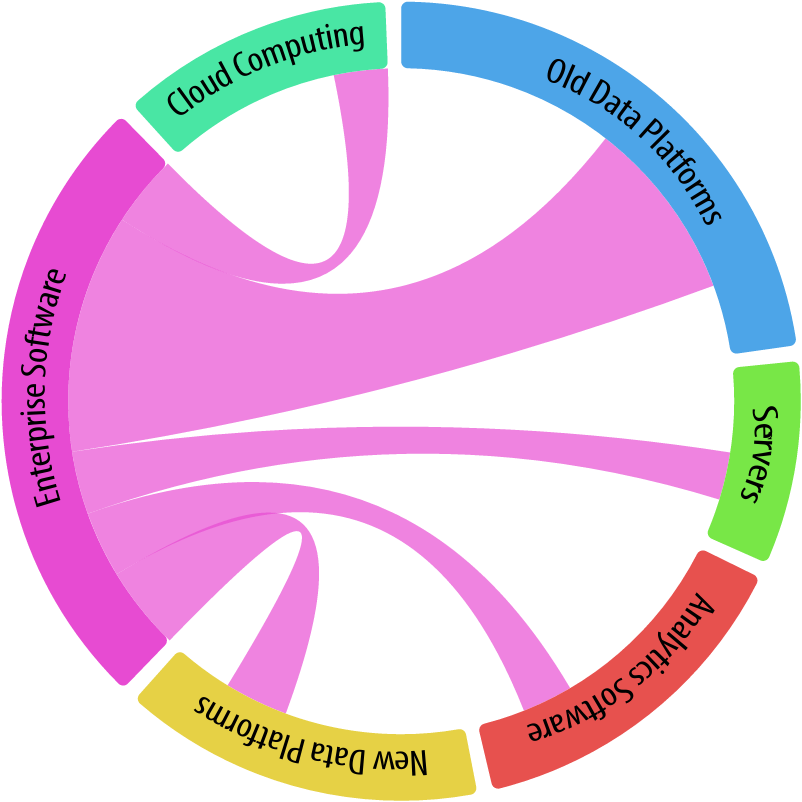
For instance, in Figure 1-11, focusing on Enterprise Software, we see the relative involvement of Enterprise Software with other markets. As expected, Enterprise Software is still heavily invested in Old Data Platforms, but with solid links to all other industries as well. This points to the maturation of New Data Platforms and Cloud Computing.

Figure 1-12 indicates that Cloud Computing links more to New Data Platforms and Enterprise Software than they link back, at a ratio of 1.7 and 1.6, respectively. This represents cloud computing taking more notice of these two markets than they take back, as cloud computing is still an emerging market.
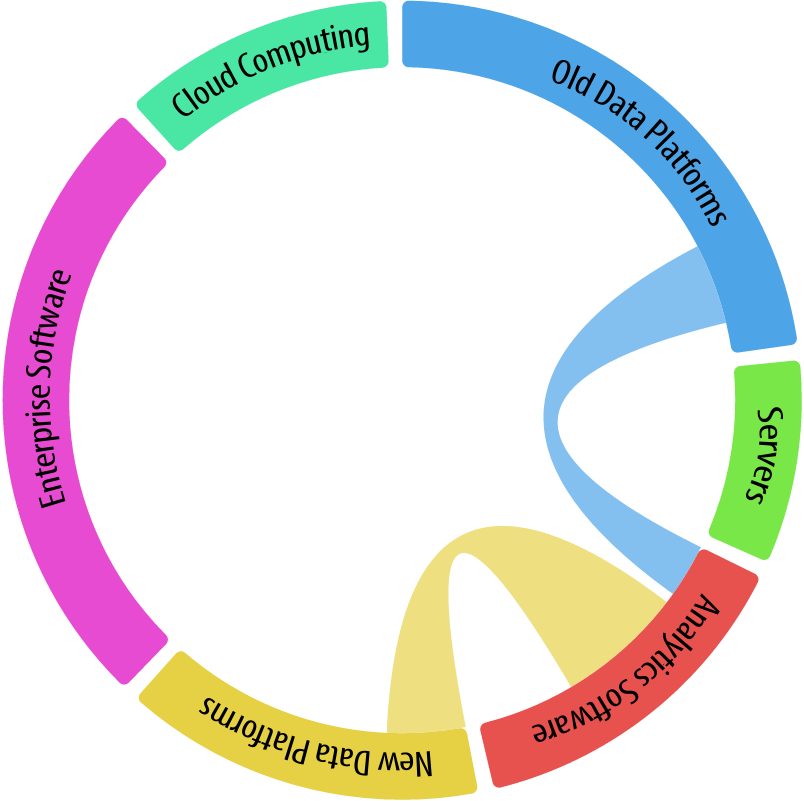
Figure 1-13 shows that New Data Platforms link more heavily to Analytic Software than Old Data Platforms. This indicates that newer data platforms are more data-driven, integrating with Analytic Software and tools.
Conclusion
In this report, we have used business partnerships to understand the structure of collaboration in the big data market. This enabled us to produce new kinds of insight. Through rigorous data collection, analysis, and interpretation, we have reached insights about the big data market in a way that has not been done before. We look forward to your feedback, and to producing additional reports using this method.