Microservices at scale
Learn about architectural safety measures, scaling data, caching schemes, service discovery, and more.
 Alps (source: PublicDomainPictures)
When you’re dealing with nice, small, book-sized examples, everything seems simple. But the real world is a more complex space. What happens when our microservice architectures grow from simpler, more humble beginnings to something more complex? What happens when we have to handle failure of multiple separate services or manage hundreds of services? What are some of the coping patterns when you have more microservices than people? Let’s find out.
Failure Is Everywhere
We understand that things can go wrong. Hard disks can fail. Our software can crash. And as anyone who has read the fallacies of distributed computing can tell you, we know that the network is unreliable. We can do our best to try to limit the causes of failure, but at a certain scale, failure becomes inevitable. Hard drives, for example, are more reliable now than ever before, but they’ll break eventually. The more hard drives you have, the higher the likelihood of failure for an individual unit; failure becomes a statistical certainty at scale.

Learn faster. Dig deeper. See farther.
Even for those of us not thinking at extreme scale, if we can embrace the possibility of failure we will be better off. For example, if we can handle the failure of a service gracefully, then it follows that we can also do in-place upgrades of a service, as a planned outage is much easier to deal with than an unplanned one.
We can also spend a bit less of our time trying to stop the inevitable, and a bit more of our time dealing with it gracefully. I’m amazed at how many organizations put processes and controls in place to try to stop failure from occurring, but put little to no thought into actually making it easier to recover from failure in the first place.
Baking in the assumption that everything can and will fail leads you to think differently about how you solve problems.
I saw one example of this thinking while spending some time on the Google campus many years ago. In the reception area of one of the buildings in Mountain View was an old rack of machines, there as a sort of exhibit. I noticed a couple of things. First, these servers weren’t in server enclosures, they were just bare motherboards slotted into the rack. The main thing I noticed, though, was that the hard drives were attached by velcro. I asked one of the Googlers why that was. “Oh,” he said, “the hard drives fail so much we don’t want them screwed in. We just rip them out, throw them in the bin, and velcro in a new one.”
So let me repeat: at scale, even if you buy the best kit, the most expensive hardware, you cannot avoid the fact that things can and will fail. Therefore, you need to assume failure can happen. If you build this thinking into everything you do, and plan for failure, you can make different trade-offs. If you know your system can handle the fact that a server can and will fail, why bother spending much on it at all? Why not use a bare motherboard with cheaper components (and some velcro) like Google did, rather than worrying too much about the resiliency of a single node?
How Much Is Too Much?
We touched on the topic of cross-functional requirements in Chapter 7. Understanding cross-functional requirements is all about considering aspects like durability of data, availability of services, throughput, and acceptable latency of services. Many of the techniques covered in this chapter and elsewhere talk about approaches to implement these requirements, but only you know exactly what the requirements themselves might be.
Having an autoscaling system capable of reacting to increased load or failure of individual nodes might be fantastic, but could be overkill for a reporting system that only needs to run twice a month, where being down for a day or two isn’t that big of a deal. Likewise, figuring out how to do blue/green deployments to eliminate downtime of a service might make sense for your online ecommerce system, but for your corporate intranet knowledge base it’s probably a step too far.
Knowing how much failure you can tolerate, or how fast your system needs to be, is driven by the users of your system. That in turn will help you understand which techniques will make the most sense for you. That said, your users won’t always be able to articulate what the exact requirements are. So you need to ask questions to help extract the right information, and help them understand the relative costs of providing different levels of service.
As I mentioned previously, these cross-functional requirements can vary from service to service, but I would suggest defining some general cross-functionals and then overriding them for particular use cases. When it comes to considering if and how to scale out your system to better handle load or failure, start by trying to understand the following requirements:
- Response time/latency
-
How long should various operations take? It can be useful here to measure this with different numbers of users to understand how increasing load will impact the response time. Given the nature of networks, you’ll always have outliers, so setting targets for a given percentile of the responses monitored can be useful. The target should also include the number of concurrent connections/users you will expect your software to handle. So you might say, “We expect the website to have a 90th-percentile response time of 2 seconds when handling 200 concurrent connections per second.”
- Availability
-
Can you expect a service to be down? Is this considered a 24/7 service? Some people like to look at periods of acceptable downtime when measuring availability, but how useful is this to someone calling your service? I should either be able to rely on your service responding or not. Measuring periods of downtime is really more useful from a historical reporting angle.
- Durability of data
-
How much data loss is acceptable? How long should data be kept for? This is highly likely to change on a case-by-case basis. For example, you might choose to keep user session logs for a year or less to save space, but your financial transaction records might need to be kept for many years.
Once you have these requirements in place, you’ll want a way to systematically measure them on an ongoing basis. You may decide to make use of performance tests, for example, to ensure your system meets acceptable performance targets, but you’ll want to make sure you are monitoring these stats in production as well!
Degrading Functionality
An essential part of building a resilient system, especially when your functionality is spread over a number of different microservices that may be up or down, is the ability to safely degrade functionality. Let’s imagine a standard web page on our ecommerce site. To pull together the various parts of that website, we might need several microservices to play a part. One microservice might display the details about the album being offered for sale. Another might show the price and stock level. And we’ll probably be showing shopping cart contents too, which may be yet another microservice. Now if one of those services is down, and that results in the whole web page being unavailable, then we have arguably made a system that is less resilient than one that requires only one service to be available.
What we need to do is understand the impact of each outage, and work out how to properly degrade functionality. If the shopping cart service is unavailable, we’re probably in a lot of trouble, but we could still show the web page with the listing. Perhaps we just hide the shopping cart or replace it with an icon saying “Be Back Soon!”
With a single, monolithic application, we don’t have many decisions to make. System health is binary. But with a microservice architecture, we need to consider a much more nuanced situation. The right thing to do in any situation is often not a technical decision. We might know what is technically possible when the shopping cart is down, but unless we understand the business context we won’t understand what action we should be taking. For example, perhaps we close the entire site, still allow people to browse the catalog of items, or replace the part of the UI containing the cart control with a phone number for placing an order. But for every customer-facing interface that uses multiple microservices, or every microservice that depends on multiple downstream collaborators, you need to ask yourself, “What happens if this is down?” and know what to do.
By thinking about the criticality of each of our capabilities in terms of our cross-functional requirements, we’ll be much better positioned to know what we can do. Now let’s consider some things we can do from a technical point of view to make sure that when failure occurs we can handle it gracefully.
Architectural Safety Measures
There are a few patterns, which collectively I refer to as architectural safety measures, that we can make use of to ensure that if something does go wrong, it doesn’t cause nasty ripple-out effects. These are points it is essential you understand, and should strongly consider standardizing in your system to ensure that one bad citizen doesn’t bring the whole world crashing down around your ears. In a moment, we’ll take a look at a few key safety measures you should consider, but before we do, I’d like to share a brief story to outline the sort of thing that can go wrong.
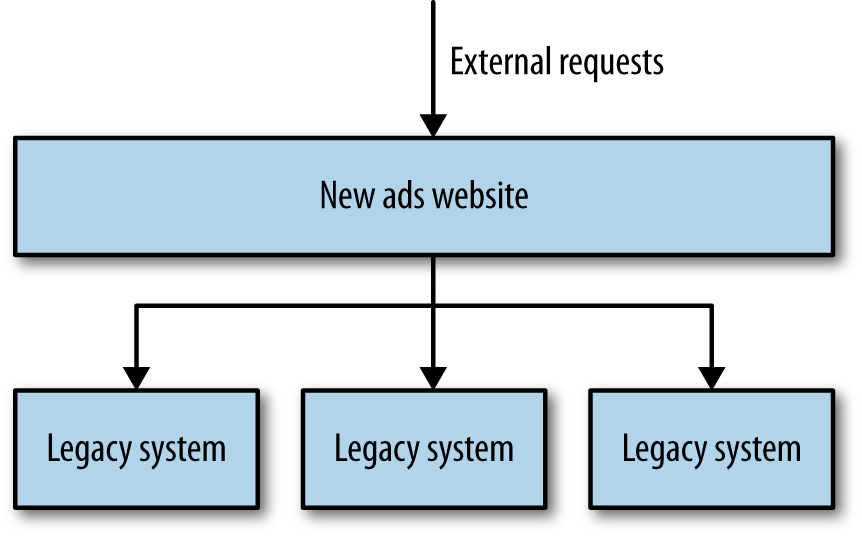
I was a technical lead on a project where we were building an online classified ads website. The website itself handled fairly high volumes, and generated a good deal of income for the business. Our core application handled some display of classified ads itself, and also proxied calls to other services that provided different types of products, as shown in Figure 1-1. This is actually an example of a strangler application, where a new system intercepts calls made to legacy applications and gradually replaces them altogether. As part of this project, we were partway through retiring the older applications. We had just moved over the highest volume and biggest earning product, but much of the rest of the ads were still being served by a number of older applications. In terms of both the number of searches and the money made by these applications, there was a very long tail.
Our system had been live for a while and was behaving very well, handling a not insignificant load. At that time we must have been handling around 6,000–7,000 requests per second during peak, and although most of that was very heavily cached by reverse proxies sitting in front of our application servers, the searches for products (the most important aspect of the site) were mostly uncached and required a full server round-trip.
One morning, just before we hit our daily lunchtime peak, the system started behaving slowly, then gradually started failing. We had some level of monitoring on our new core application, enough to tell us that each of our application nodes was hitting a 100% CPU spike, well above the normal levels even at peak. In a short period of time, the entire site went down.
We managed to track down the culprit and bring the site back up. It turned out one of the downstream ad systems, one of the oldest and least actively maintained, had started responding very slowly. Responding very slowly is one of the worst failure modes you can experience. If a system is just not there, you find out pretty quickly. When it’s just slow, you end up waiting around for a while before giving up. But whatever the cause of the failure, we had created a system that was vulnerable to a cascading failure. A downstream service, over which we had little control, was able to take down our whole system.
While one team looked at the problems with the downstream system, the rest of us started looking at what had gone wrong in our application. We found a few problems. We were using an HTTP connection pool to handle our downstream connections. The threads in the pool itself had timeouts configured for how long they would wait when making the downstream HTTP call, which is good. The problem was that the workers were all taking a while to time out due to the slow downstream system. While they were waiting, more requests went to the pool asking for worker threads. With no workers available, these requests themselves hung. It turned out the connection pool library we were using did have a timeout for waiting for workers, but this was disabled by default! This led to a huge build-up of blocked threads. Our application normally had 40 concurrent connections at any given time. In the space of five minutes, this situation caused us to peak at around 800 connections, bringing the system down.
What was worse was that the downstream service we were talking to represented functionality that less than 5% of our customer base used, and generated even less revenue than that. When you get down to it, we discovered the hard way that systems that just act slow are much harder to deal with than systems that just fail fast. In a distributed system, latency kills.
Even if we’d had the timeouts on the pool set correctly, we were also sharing a single HTTP connection pool for all outbound requests. This meant that one slow service could exhaust the number of available workers all by itself, even if everything else was healthy. Lastly, it was clear that the downstream service in question wasn’t healthy, but we kept sending traffic its way. In our situation, this meant we were actually making a bad situation worse, as the downstream service had no chance to recover. We ended up implementing three fixes to avoid this happening again: getting our timeouts right, implementing bulkheads to separate out different connection pools, and implementing a circuit breaker to avoid sending calls to an unhealthy system in the first place.
The Antifragile Organization
In his book Antifragile (Random House), Nassim Taleb talks about things that actually benefit from failure and disorder. Ariel Tseitlin used this concept to coin the concept of the antifragile organization in regards to how Netflix operates.
The scale at which Netflix operates is well known, as is the fact that Netflix is based entirely on the AWS infrastructure. These two factors mean that it has to embrace failure well. Netflix goes beyond that by actually inciting failure to ensure that its systems are tolerant of it.
Some organizations would be happy with game days, where failure is simulated by systems being switched off and having the various teams react. During my time at Google, this was a fairly common occurrence for various systems, and I certainly think that many organizations could benefit from having these sorts of exercises regularly. Google goes beyond simple tests to mimic server failure, and as part of its annual DiRT (Disaster Recovery Test) exercises it has simulated large-scale disasters such as earthquakes. Netflix also takes a more aggressive approach, by writing programs that cause failure and running them in production on a daily basis.
The most famous of these programs is the Chaos Monkey, which during certain hours of the day will turn off random machines. Knowing that this can and will happen in production means that the developers who create the systems really have to be prepared for it. The Chaos Monkey is just one part of Netflix’s Simian Army of failure bots. The Chaos Gorilla is used to take out an entire availability center (the AWS equivalent of a data center), whereas the Latency Monkey simulates slow network connectivity between machines. Netflix has made these tools available under an open source license. For many, the ultimate test of whether your system really is robust might be unleashing your very own Simian Army on your production infrastructure.
Embracing and inciting failure through software, and building systems that can handle it, is only part of what Netflix does. It also understands the importance of learning from the failure when it occurs, and adopting a blameless culture when mistakes do happen. Developers are further empowered to be part of this learning and evolving process, as each developer is also responsible for managing his or her production services.
By causing failure to happen, and building for it, Netflix has ensured that the systems it has scale better, and better support the needs of its customers.
Not everyone needs to go to the sorts of extremes that Google or Netflix do, but it is important to understand the mindset shift that is required with distributed systems. Things will fail. The fact that your system is now spread across multiple machines (which can and will fail) across a network (which will be unreliable) can actually make your system more vulnerable, not less. So regardless of whether you’re trying to provide a service at the scale of Google or Netflix, preparing yourself for the sorts of failure that happen with more distributed architectures is pretty important. So what do we need to do to handle failure in our systems?
Timeouts
Timeouts are something it is easy to overlook, but in a downstream system they are important to get right. How long can I wait before I can consider a downstream system to actually be down?
Wait too long to decide that a call has failed, and you can slow the whole system down. Time out too quickly, and you’ll consider a call that might have worked as failed. Have no timeouts at all, and a downstream system being down could hang your whole system.
Put timeouts on all out-of-process calls, and pick a default timeout for everything. Log when timeouts occur, look at what happens, and change them accordingly.
Circuit Breakers
In your own home, circuit breakers exist to protect your electrical devices from spikes in the power. If a spike occurs, the circuit breaker gets blown, protecting your expensive home appliances. You can also manually disable a circuit breaker to cut the power to part of your home, allowing you to work safely on the electrics. Michael Nygard’s book Release It! (Pragmatic Programmers) shows how the same idea can work wonders as a protection mechanism for our software.
Consider the story I shared just a moment ago. The downstream legacy ad application was responding very slowly, before eventually returning an error. Even if we’d got the timeouts right, we’d be waiting a long time before we got the error. And then we’d try it again the next time a request came in, and wait. It’s bad enough that the downstream service is malfunctioning, but it’s making us go slow too.
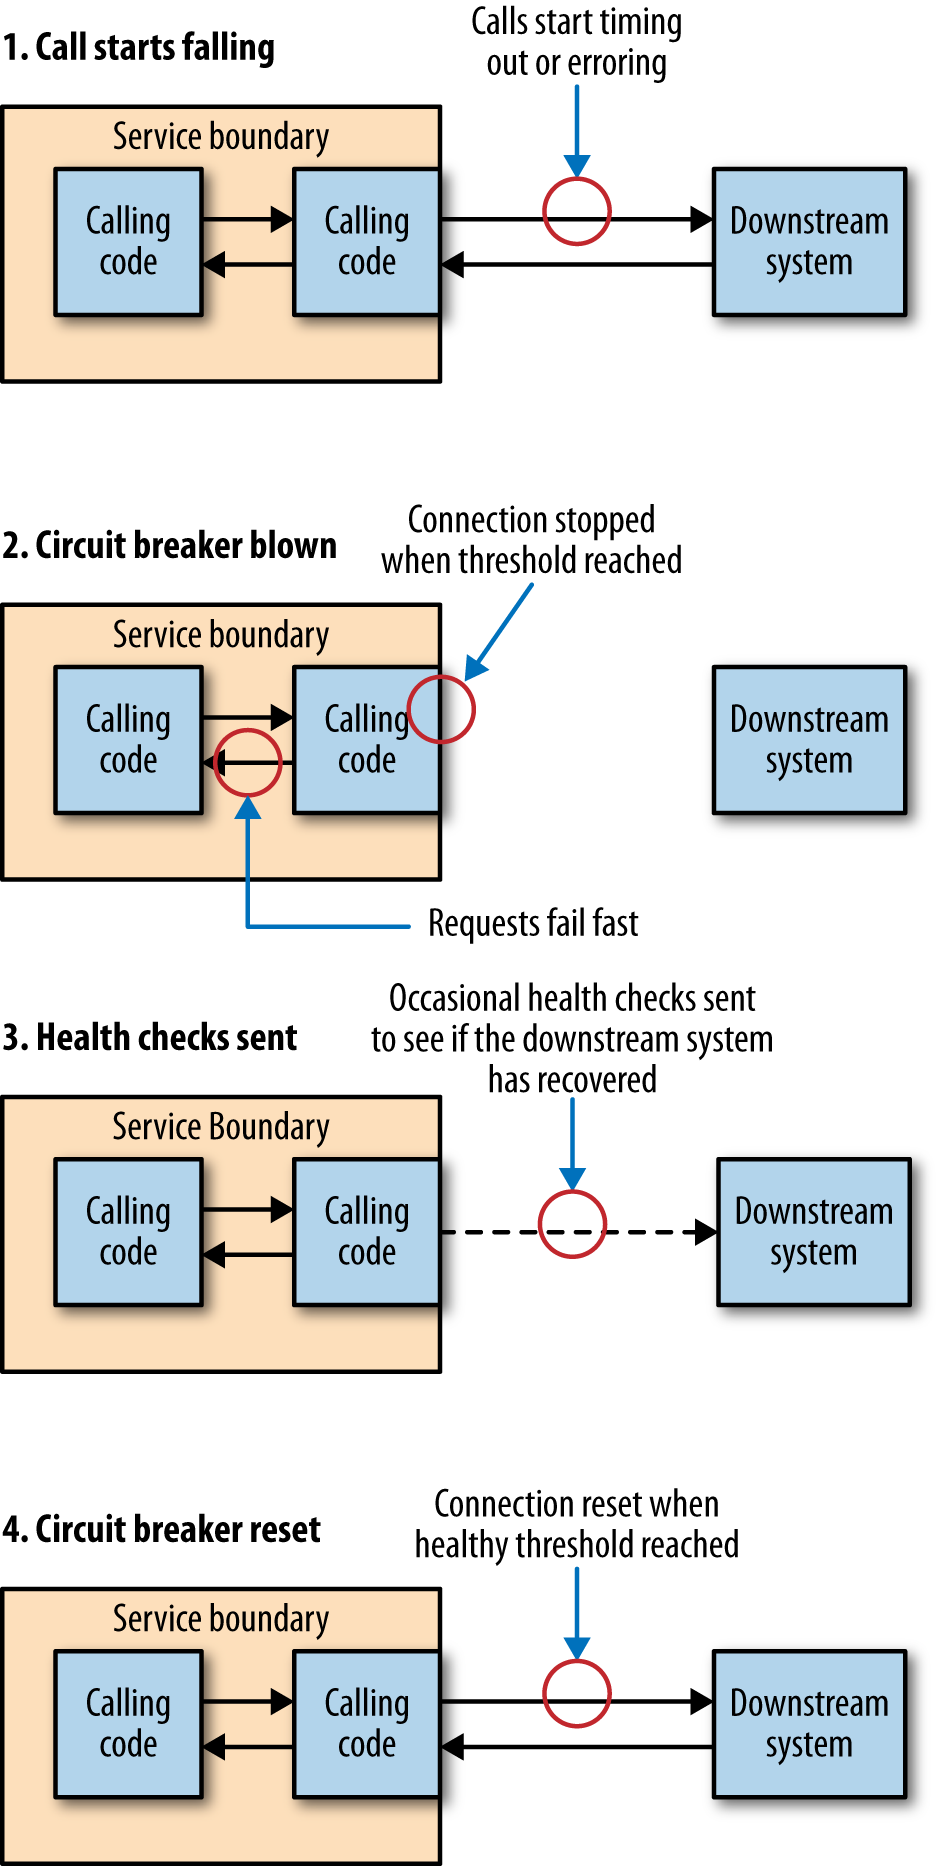
With a circuit breaker, after a certain number of requests to the downstream resource have failed, the circuit breaker is blown. All further requests fail fast while the circuit breaker is in its blown state. After a certain period of time, the client sends a few requests through to see if the downstream service has recovered, and if it gets enough healthy responses it resets the circuit breaker. You can see an overview of this process in Figure 1-2.
How you implement a circuit breaker depends on what a failed request means, but when I’ve implemented them for HTTP connections I’ve taken failure to mean either a timeout or a 5XX HTTP return code. In this way, when a downstream resource is down, or timing out, or returning errors, after a certain threshold is reached we automatically stop sending traffic and start failing fast. And we can automatically start again when things are healthy.
Getting the settings right can be a little tricky. You don’t want to blow the circuit breaker too readily, nor do you want to take too long to blow it. Likewise, you really want to make sure that the downstream service is healthy again before sending traffic. As with timeouts, I’d pick some sensible defaults and stick with them everywhere, then change them for specific cases.
While the circuit breaker is blown, you have some options. One is to queue up the requests and retry them later on. For some use cases, this might be appropriate, especially if you’re carrying out some work as part of an asynchronous job. If this call is being made as part of a synchronous call chain, however, it is probably better to fail fast. This could mean propagating an error up the call chain, or a more subtle degrading of functionality.
If we have this mechanism in place (as with the circuit breakers in our home), we could use them manually to make it safer to do our work. For example, if we wanted to take a microservice down as part of routine maintenance, we could manually blow all the circuit breakers of the dependent systems so they fail fast while the microservice is offline. Once it’s back, we can reset the circuit breakers and everything should go back to normal.
Bulkheads
In another pattern from Release It!, Nygard introduces the concept of a bulkhead as a way to isolate yourself from failure. In shipping, a bulkhead is a part of the ship that can be sealed off to protect the rest of the ship. So if the ship springs a leak, you can close the bulkhead doors. You lose part of the ship, but the rest of it remains intact.
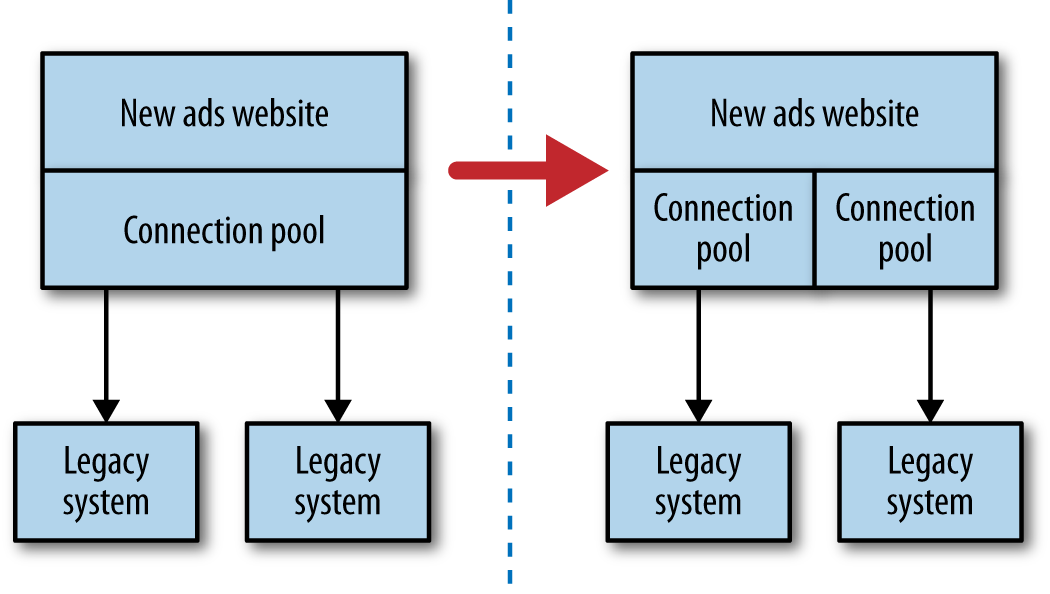
In software architecture terms, there are lots of different bulkheads we can consider. Returning to my own experience, we actually missed the chance to implement a bulkhead. We should have used different connection pools for each downstream connection. That way, if one connection pool gets exhausted, the other connections aren’t impacted, as we see in Figure 1-3. This would ensure that if a downstream service started behaving slowly in the future, only that one connection pool would be impacted, allowing other calls to proceed as normal.
Separation of concerns can also be a way to implement bulkheads. By teasing apart functionality into separate microservices, we reduce the chance of an outage in one area affecting another.
Look at all the aspects of your system that can go wrong, both inside your microservices and between them. Do you have bulkheads in place? I’d suggest starting with separate connection pools for each downstream connection at the very least. You may want to go further, however, and consider using circuit breakers too.
We can think of our circuit breakers as an automatic mechanism to seal a bulkhead, to not only protect the consumer from the downstream problem, but also to potentially protect the downstream service from more calls that may be having an adverse impact. Given the perils of cascading failure, I’d recommend mandating circuit breakers for all your synchronous downstream calls. You don’t have to write your own, either. Netflix’s Hystrix library is a JVM circuit breaker abstraction that comes with some powerful monitoring, but other implementations exist for different technology stacks, such as Polly for .NET, or the circuit_breaker mixin for Ruby.
In many ways, bulkheads are the most important of these three patterns. Timeouts and circuit breakers help you free up resources when they are becoming constrained, but bulkheads can ensure they don’t become constrained in the first place. Hystrix allows you, for example, to implement bulkheads that actually reject requests in certain conditions to ensure that resources don’t become even more saturated; this is known as load shedding. Sometimes rejecting a request is the best way to stop an important system from becoming overwhelmed and being a bottleneck for multiple upstream services.
Isolation
The more one service depends on another being up, the more the health of one impacts the ability of the other to do its job. If we can use integration techniques that allow a downstream server to be offline, upstream services are less likely to be affected by outages, planned or unplanned.
There is another benefit to increasing isolation between services. When services are isolated from each other, much less coordination is needed between service owners. The less coordination needed between teams, the more autonomy those teams have, as they are able to operate and evolve their services more freely.
Idempotency
In idempotent operations, the outcome doesn’t change after the first application, even if the operation is subsequently applied multiple times. If operations are idempotent, we can repeat the call multiple times without adverse impact. This is very useful when we want to replay messages that we aren’t sure have been processed, a common way of recovering from error.
Let’s consider a simple call to add some points as a result of one of our customers placing an order. We might make a call with the sort of payload shown in Example 1-1.
Example 1-1. Crediting points to an account
<credit>
  <amount>100</amount>
  <forAccount>1234</account>
</credit>
If this call is received multiple times, we would add 100 points multiple times. As it stands, therefore, this call is not idempotent. With a bit more information, though, we allow the points bank to make this call idempotent, as shown in Example 1-2.
Example 1-2. Adding more information to the points credit to make it idempotent
<credit>
  <amount>100</amount>
  <forAccount>1234</account>
  <reason>
    <forPurchase>4567</forPurchase>
  </reason>
</credit>
Now we know that this credit relates to a specific order, 4567. Assuming that we could receive only one credit for a given order, we could apply this credit again without increasing the overall number of points.
This mechanism works just as well with event-based collaboration, and can be especially useful if you have multiple instances of the same type of service subscribing to events. Even if we store which events have been processed, with some forms of asynchronous message delivery there may be small windows where two workers can see the same message. By processing the events in an idempotent manner, we ensure this won’t cause us any issues.
Some people get quite caught up with this concept, and assume it means that subsequent calls with the same parameters can’t have any impact, which then leaves us in an interesting position. We really would still like to record the fact that a call was received in our logs, for example. We want to record the response time of the call and collect this data for monitoring. The key point here is that it is the underlying business operation that we are considering idempotent, not the entire state of the system.
Some of the HTTP verbs, such as GET and PUT, are defined in the HTTP specification to be idempotent, but for that to be the case, they rely on your service handling these calls in an idempotent manner. If you start making these verbs nonidempotent, but callers think they can safely execute them repeatedly, you may get yourself into a mess. Remember, just because you’re using HTTP as an underlying protocol doesn’t mean you get everything for free!
Scaling
We scale our systems in general for one of two reasons. First, to help deal with failure: if we’re worried that something will fail, then having more of it will help, right? Second, we scale for performance, either in terms of handling more load, reducing latency, or both. Let’s look at some common scaling techniques we can use and think about how they apply to microservice architectures.
Go Bigger
Some operations can just benefit from more grunt. Getting a bigger box with faster CPU and better I/O can often improve latency and throughput, allowing you to process more work in less time. However, this form of scaling, often called vertical scaling, can be expensive—sometimes one big server can cost more than two smaller servers with the same combined raw power, especially when you start getting to really big machines. Sometimes our software itself cannot do much with the extra resources available to it. Larger machines often just give us more CPU cores, but not enough of our software is written to take advantage of them. The other problem is that this form of scaling may not do much to improve our server’s resiliency if we only have one of them! Nonetheless, this can be a good quick win, especially if you’re using a virtualization provider that lets you resize machines easily.
Splitting Workloads
As outlined in Chapter 6, having a single microservice per host is certainly preferable to a multiservice-per-host model. Initially, however, many people decide to coexist multiple microservices on one box to keep costs down or to simplify host management (although that is an arguable reason). As the microservices are independent processes that communicate over the network, it should be an easy task to then move them onto their own hosts to improve throughput and scaling. This can also increase the resiliency of the system, as a single host outage will impact a reduced number of microservices.
Of course, we could also use the need for increased scale to split an existing microservice into parts to better handle the load. As a simplistic example, let’s imagine that our accounts service provides the ability to create and manage individual customers’ financial accounts, but also exposes an API for running queries to generate reports. This query capability places a significant load on the system. The query capacity is considered noncritical, as it isn’t needed to keep orders flowing in during the day. The ability to manage the financial records for our customers is critical, though, and we can’t afford for it to be down. By splitting these two capabilities into separate services, we reduce the load on the critical accounts service, and introduce a new accounts reporting service that is designed not only with querying in mind (perhaps using some of the techniques we outlined in Chapter 4), but also as a noncritical system doesn’t need to be deployed in as resilient a way as the core accounts service.
Spreading Your Risk
One way to scale for resilience is to ensure that you don’t put all your eggs in one basket. A simplistic example of this is making sure that you don’t have multiple services on one host, where an outage would impact multiple services. But let’s consider what host means. In most situations nowadays, a host is actually a virtual concept. So what if I have all of my services on different hosts, but all those hosts are actually virtual hosts, running on the same physical box? If that box goes down, I could lose multiple services. Some virtualization platforms enable you to ensure that your hosts are distributed across multiple different physical boxes to reduce this chance.
For internal virtualization platforms, it is a common practice to have the virtual machine’s root partition mapped to a single SAN (storage area network). If that SAN goes down, it can take down all connected VMs. SANs are big, expensive, and designed not to fail. That said, I have had big expensive SANs fail on me at least twice in the last 10 years, and each time the results were fairly serious.
Another common form of separation to reduce failure is to ensure that not all your services are running in a single rack in the data center, or that your services are distributed across more than one data center. If you’re using an underlying service provider, it is important to know if a service-level agreement (SLA) is offered and plan accordingly. If you need to ensure your services are down for no more than four hours every quarter, but your hosting provider can only guarantee a downtime of eight hours per quarter, you have to either change the SLA, or come up with an alternative solution.
AWS, for example, is split into regions, which you can think of as distinct clouds. Each region is in turn split into two or more availability zones (AZs). AZs are AWS’s equivalent of a data center. It is essential to have services distributed across multiple availability zones, as AWS does not offer any guarantees about the availability of a single node, or even an entire availability zone. For its compute service, it offers only a 99.95% uptime over a given monthly period of the region as a whole, so you’ll want to distribute your workloads across multiple availability zones inside a single region. For some people, this isn’t good enough, and instead they run their services across multiple regions too.
It should be noted, of course, that because providers give you an SLA guarantee, they will tend to limit their liability! If them missing their targets costs you customers and a large amount of money, you might find yourself searching through contracts to see if you can claw anything back from them. Therefore, I would strongly suggest you understand the impact of a supplier failing in its obligations to you, and work out if you need to have a plan B (or C) in your pocket. More than one client I’ve worked with has had a disaster recovery hosting platform with a different supplier, for example, to ensure they weren’t too vulnerable to the mistakes of one company.
Load Balancing
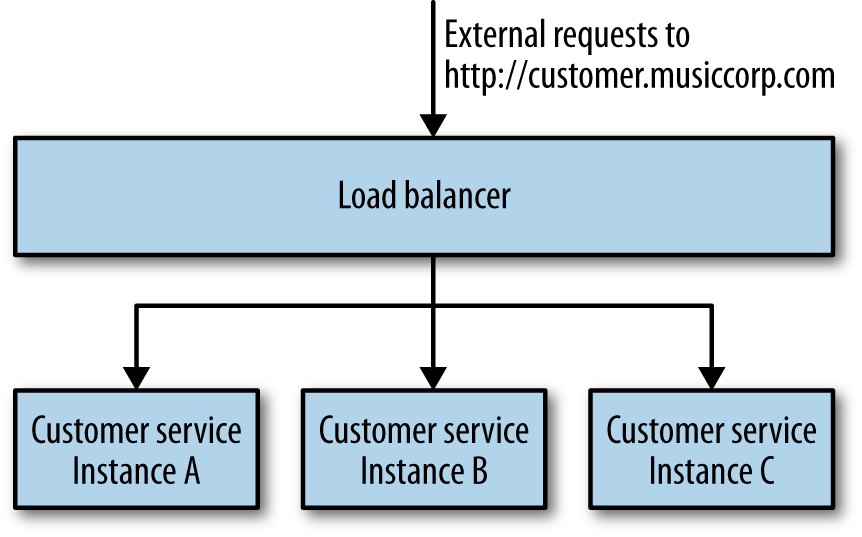
When you need your service to be resilient, you want to avoid single points of failure. For a typical microservice that exposes a synchronous HTTP endpoint, the easiest way to achieve this is to have multiple hosts running your microservice instance, sitting behind a load balancer, as shown in Figure 1-4. To consumers of the microservice, you don’t know if you are talking to one microservice instance or a hundred.
Load balancers come in all shapes and sizes, from big and expensive hardware appliances to software-based load balancers like mod_proxy. They all share some key capabilities. They distribute calls sent to them to one or more instances based on some algorithm, remove instances when they are no longer healthy, and hopefully add them back in when they are.
Some load balancers provide useful features. A common one is SSL termination, where inbound HTTPS connections to the load balancer are transformed to HTTP connections once they hit the instance itself. Historically, the overhead of managing SSL was significant enough that having a load balancer handle this process for you was fairly useful. Nowadays, this is as much about simplifying the set-up of the individual hosts running the instance. The point of using HTTPS, though, is to ensure that the requests aren’t vulnerable to a man-in-the-middle attack, as we discussed in Chapter 9, so if we use SSL termination, we are potentially exposing ourselves somewhat. One mitigation is to have all the instances of the microservice inside a single VLAN, as we see in Figure 1-5. A VLAN is a virtual local area network, that is isolated in such a way that requests from outside it can come only via a router, and in this case our router is also our SSL-terminating load balancer. The only communication to the microservice from outside the VLAN comes over HTTPS, but internally everything is HTTP.
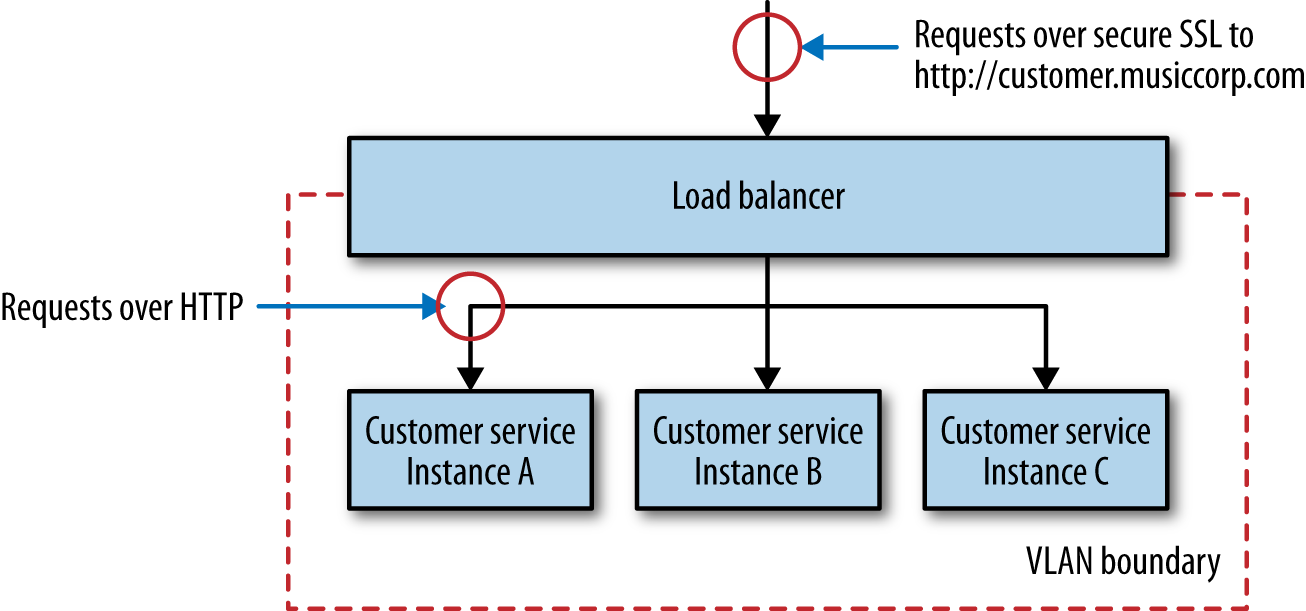
AWS provides HTTPS-terminating load balancers in the form of ELBs (elastic load balancers) and you can use its security groups or virtual private clouds (VPCs) to implement the VLAN. Otherwise, software like mod_proxy can play a similar role as a software load balancer. Many organizations have hardware load balancers, which can be difficult to automate. In such circumstances I have found myself advocating for software load balancers sitting behind the hardware load balancers to allow teams the freedom to reconfigure these as required. You do want to watch for the fact that all too often the hardware load balancers themselves are single points of failure! Whatever approach you take, when considering the configuration of a load balancer, treat it as you treat the configuration of your service: make sure it is stored in version control and can be applied automatically.
Load balancers allow us to add more instances of our microservice in a way that is transparent to any service consumers. This gives us an increased ability to handle load, and also reduce the impact of a single host failing. However, many, if not most, of your microservices will have some sort of persistent data store, probably a database sitting on a different machine. If we have multiple microservice instances on different machines, but only a single host running the database instance, our database is still a single source of failure. We’ll talk about patterns to handle this shortly.
Worker-Based Systems
Load balancing isn’t the only way to have multiple instances of your service share load and reduce fragility. Depending on the nature of the operations, a worker-based system could be just as effective. Here, a collection of instances all work on some shared backlog of work. This could be a number of Hadoop processes, or perhaps a number of listeners to a shared queue of work. These types of operations are well suited to batch work or asynchronous jobs. Think of tasks like image thumbnail processing, sending email, or generating reports.
The model also works well for peaky load, where you can spin up additional instances on demand to match the load coming in. As long as the work queue itself is resilient, this model can be used to scale both for improved throughput of work, but also for improved resiliency—the impact of a worker failing (or not being there) is easy to deal with. Work will take longer, but nothing gets lost.
I’ve seen this work well in organizations where there is lots of unused compute capacity at certain times of day. For example, overnight you might not need as many machines to run your ecommerce system, so you can temporarily use them to run workers for a reporting job instead.
With worker-based systems, although the workers themselves don’t need to be that reliable, the system that contains the work to be done does. You could handle this by running a persistent message broker, for example, or perhaps a system like Zookeeper. The benefit here is that if we use existing software for this purpose, someone has done much of the hard work for us. However, we still need to know how to set up and maintain these systems in a resilient fashion.
Starting Again
The architecture that gets you started may not be the architecture that keeps you going when your system has to handle very different volumes of load. As Jeff Dean said in his presentation “Challenges in Building Large-Scale Information Retrieval Systems” (WSDM 2009 conference), you should “design for ~10× growth, but plan to rewrite before ~100×.” At certain points, you need to do something pretty radical to support the next level of growth.
Recall the story of Gilt, which we touched on in Chapter 6. A simple monolithic Rails application did well for Gilt for two years. Its business became increasingly successful, which meant more customers and more load. At a certain tipping point, the company had to redesign the application to handle the load it was seeing.
A redesign may mean splitting apart an existing monolith, as it did for Gilt. Or it might mean picking new data stores that can handle the load better, which we’ll look at in a moment. It could also mean adopting new techniques, such as moving from synchronous request/response to event-based systems, adopting new deployment platforms, changing whole technology stacks, or everything in between.
There is a danger that people will see the need to rearchitect when certain scaling thresholds are reached as a reason to build for massive scale from the beginning. This can be disastrous. At the start of a new project, we often don’t know exactly what we want to build, nor do we know if it will be successful. We need to be able to rapidly experiment, and understand what capabilities we need to build. If we tried building for massive scale up front, we’d end up front-loading a huge amount of work to prepare for load that may never come, while diverting effort away from more important activities, like understanding if anyone will want to actually use our product. Eric Ries tells the story of spending six months building a product that no one ever downloaded. He reflected that he could have put up a link on a web page that 404’d when people clicked on it to see if there was any demand, spent six months on the beach instead, and learned just as much!
The need to change our systems to deal with scale isn’t a sign of failure. It is a sign of success.
Scaling Databases
Scaling stateless microservices is fairly straightforward. But what if we are storing data in a database? We’ll need to know how to scale that too. Different types of databases provide different forms of scaling, and understanding what form suits your use case best will ensure you select the right database technology from the beginning.
Availability of Service Versus Durability of Data
Straight off, it is important to separate the concept of availability of the service from the durability of the data itself. You need to understand that these are two different things, and as such they will have different solutions.
For example, I could store a copy of all data written to my database in a resilient filesystem. If the database goes down, my data isn’t lost, as I have a copy, but the database itself isn’t available, which may make my microservice unavailable too. A more common model would be using a standby. All data written to the primary database gets copied to the standby replica database. If the primary goes down, my data is safe, but without a mechanism to either bring it back up or promote the replica to the primary, we don’t have an available database, even though our data is safe.
Scaling for Reads
Many services are read-mostly. Think of a catalog service that stores information for the items we have for sale. We add records for new items on a fairly irregular basis, and it wouldn’t at all be surprising if we get more than 100 reads of our catalog’s data for every write. Happily, scaling for reads is much easier than scaling for writes. Caching of data can play a large part here, and we’ll discuss that in more depth shortly. Another model is to make use of read replicas.
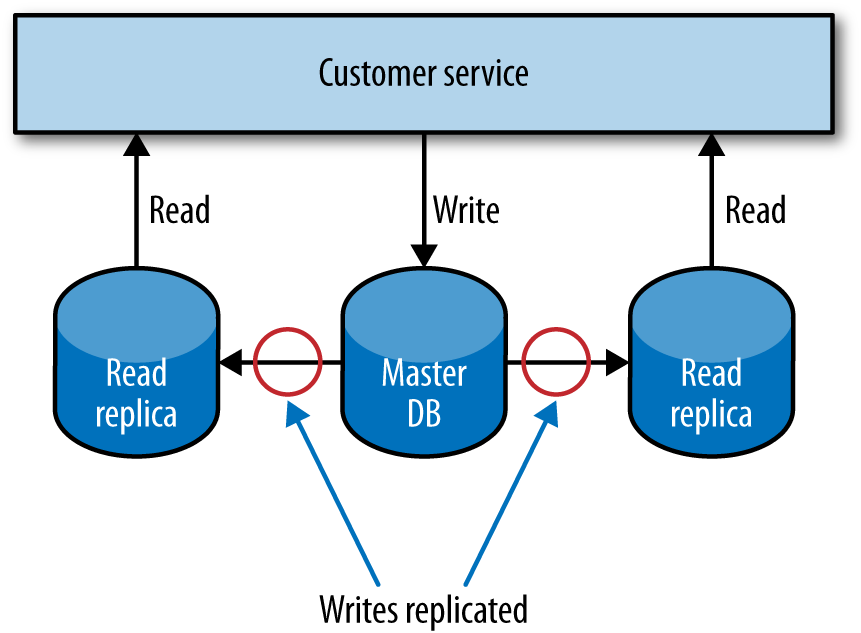
In a relational database management system (RDBMS) like MySQL or Postgres, data can be copied from a primary node to one or more replicas. This is often done to ensure that a copy of our data is kept safe, but we can also use it to distribute our reads. A service could direct all writes to the single primary node, but distribute reads to one or more read replicas, as we see in Figure 1-6. The replication from the primary database to the replicas happens at some point after the write. This means that with this technique reads may sometimes see stale data until the replication has completed. Eventually the reads will see the consistent data. Such a setup is called eventually consistent, and if you can handle the temporary inconsistency it is a fairly easy and common way to help scale systems. We’ll look into this in more depth shortly when we look at the CAP theorem.
Years ago, using read replicas to scale was all the rage, although nowadays I would suggest you look to caching first, as it can deliver much more significant improvements in performance, often with less work.
Scaling for Writes
Reads are comparatively easy to scale. What about writes? One approach is to use sharding. With sharding, you have multiple database nodes. You take a piece of data to be written, apply some hashing function to the key of the data, and based on the result of the function learn where to send the data. To pick a very simplistic (and actually bad) example, imagine that customer records A–M go to one database instance, and N–Z another. You can manage this yourself in your application, but some databases, like Mongo, handle much of it for you.
The complexity with sharding for writes comes from handling queries. Looking up an individual record is easy, as I can just apply the hashing function to find which instance the data should be on, and then retrieve it from the correct shard. But what about queries that span the data in multiple nodes—for example, finding all the customers who are over 18? If you want to query all shards, you either need to query each individual shard and join in memory, or have an alternative read store where both data sets are available. Often querying across shards is handled by an asynchronous mechanism, using cached results. Mongo uses map/reduce jobs, for example, to perform these queries.
One of the questions that emerges with sharded systems is, what happens if I want to add an extra database node? In the past, this would often require significant downtime—especially for large clusters—as you might have to take the entire database down and rebalance the data. More recently, more systems support adding extra shards to a live system, where the rebalancing of data happens in the background; Cassandra, for example, handles this very well. Adding shards to an existing cluster isn’t for the faint of heart, though, so make sure you test this thoroughly.
Sharding for writes may scale for write volume, but may not improve resiliency. If customer records A–M always go to Instance X, and Instance X is unavailable, access to records A–M can be lost. Cassandra offers additional capabilities here, where we can ensure that data is replicated to multiple nodes in a ring (Cassandra’s term for a collection of Cassandra nodes).
As you may have inferred from this brief overview, scaling databases for writes are where things get very tricky, and where the capabilities of the various databases really start to become differentiated. I often see people changing database technology when they start hitting limits on how easily they can scale their existing write volume. If this happens to you, buying a bigger box is often the quickest way to solve the problem, but in the background you might want to look at systems like Cassandra, Mongo, or Riak to see if their alternative scaling models might offer you a better long-term solution.
CQRS
The Command-Query Responsibility Segregation (CQRS) pattern refers to an alternate model for storing and querying information. With normal databases, we use one system for performing modifications to data and querying the data. With CQRS, part of the system deals with commands, which capture requests to modify state, while another part of the system deals with queries.
Commands come in requesting changes in state. These commands are validated, and if they work, they will be applied to the model. Commands should contain information about their intent. They can be processed synchronously or asynchronously, allowing for different models to handle scaling; we could, for example, just queue up inbound requests and process them later.
The key takeaway here is that the internal models used to handle commands and queries are themselves completely separate. For example, I might choose to handle and process commands as events, perhaps just storing the list of commands in a data store (a process known as event sourcing). My query model could query an event store and create projections from stored events to assemble the state of domain objects, or could just pick up a feed from the command part of the system to update a different type of store. In many ways, we get the same benefits of read replicas that we discussed earlier, without the requirement that the backing store for the replicas be the same as the data store used to handle data modifications.
This form of separation allows for different types of scaling. The command and query parts of our system could live in different services, or on different hardware, and could make use of radically different types of data store. This can unlock a large number of ways to handle scale. You could even support different types of read format by having multiple implementations of the query piece, perhaps supporting a graph-based representation of your data, or a key/value-based form of your data.
Be warned, however: this sort of pattern is quite a shift away from a model where a single data store handles all our CRUD operations. I’ve seen more than one experienced development team struggle to get this pattern right!
Caching
Caching is a commonly used performance optimization whereby the previous result of some operation is stored, so that subsequent requests can use this stored value rather than spending time and resources recalculating the value. More often than not, caching is about eliminating needless round-trips to databases or other services to serve results faster. Used well, it can yield huge performance benefits. The reason that HTTP scales so well in handling large numbers of requests is that the concept of caching is built in.
Even with a simple monolithic web application, there are quite a few choices as to where and how to cache. With a microservice architecture, where each service is its own source of data and behavior, we have many more choices to make about where and how to cache. With a distributed system, we typically think of caching either on the client side or on the server side. But which is best?
Client-Side, Proxy, and Server-Side Caching
In client-side caching, the client stores the cached result. The client gets to decide when (and if) it goes and retrieves a fresh copy. Ideally, the downstream service will provide hints to help the client understand what to do with the response, so it knows when and if to make a new request. With proxy caching, a proxy is placed between the client and the server. A great example of this is using a reverse proxy or content delivery network (CDN). With server-side caching, the server handles caching responsibility, perhaps making use of a system like Redis or Memcache, or even a simple in-memory cache.
Which one makes the most sense depends on what you are trying to optimize. Client-side caching can help reduce network calls drastically, and can be one of the fastest ways of reducing load on a downstream service. In this case, the client is in charge of the caching behavior, and if you want to make changes to how caching is done, rolling out changes to a number of consumers could be difficult. Invalidation of stale data can also be trickier, although we’ll discuss some coping mechanisms for this in a moment.
With proxy caching, everything is opaque to both the client and server. This is often a very simple way to add caching to an existing system. If the proxy is designed to cache generic traffic, it can also cache more than one service; a common example is a reverse proxy like Squid or Varnish, which can cache any HTTP traffic. Having a proxy between the client and server does introduce additional network hops, although in my experience it is very rare that this causes problems, as the performance optimizations resulting from the caching itself outweigh any additional network costs.
With server-side caching, everything is opaque to the clients; they don’t need to worry about anything. With a cache near or inside a service boundary, it can be easier to reason about things like invalidation of data, or track and optimize cache hits. In a situation where you have multiple types of clients, a server-side cache could be the fastest way to improve performance.
For every public-facing website I’ve worked on, we’ve ended up doing a mix of all three approaches. But for more than one distributed system, I’ve gotten away with no caching at all. But it all comes down to knowing what load you need to handle, how fresh your data needs to be, and what your system can do right now. Knowing that you have a number of different tools at your disposal is just the beginning.
Caching in HTTP
HTTP provides some really useful controls to help us cache either on the client side or server side, which are worth understanding even if you aren’t using HTTP itself.
First, with HTTP, we can use cache-control directives in our responses to clients. These tell clients if they should cache the resource at all, and if so how long they should cache it for in seconds. We also have the option of setting an Expires header, where instead of saying how long a piece of content can be cached for, we specify a time and date at which a resource should be considered stale and fetched again. The nature of the resources you are sharing determines which one is most likely to fit. Standard static website content like CSS or images often fit well with a simple cache-control time to live (TTL). On the other hand, if you know in advance when a new version of a resource will be updated, setting an Expires header will make more sense. All of this is very useful in stopping a client from even needing to make a request to the server in the first place.
Aside from cache-control and Expires, we have another option in our arsenal of HTTP goodies: Entity Tags, or ETags. An ETag is used to determine if the value of a resource has changed. If I update a customer record, the URI to the resource is the same, but the value is different, so I would expect the ETag to change. This becomes powerful when we’re using what is called a conditional GET. When making a GET request, we can specify additional headers, telling the service to send us the resource only if some criteria are met.
For example, let’s imagine we fetch a customer record, and its ETag comes back as o5t6fkd2sa. Later on, perhaps because a cache-control directive has told us the resource should be considered stale, we want to make sure we get the latest version. When issuing the subsequent GET request, we can pass in a If-None-Match: o5t6fkd2sa. This tells the server that we want the resource at the specified URI, unless it already matches this ETag value. If we already have the up-to-date version, the service sends us a 304 Not Modified response, telling us we have the latest version. If there is a newer version available, we get a 200 OK with the changed resource, and a new ETag for the resource.
The fact that these controls are built into such a widely used specification means we get to take advantage of a lot of preexisting software that handles the caching for us. Reverse proxies like Squid or Varnish can sit transparently on the network between client and server, storing and expiring cached content as required. These systems are geared toward serving huge numbers of concurrent requests very fast, and are a standard way of scaling public-facing websites. CDNs like AWS’s CloudFront or Akamai can ensure that requests are routed to caches near the calling client, making sure that traffic doesn’t go halfway round the world when it doesn’t need to. And more prosaically, HTTP client libraries and client caches can handle a lot of this work for us.
ETags, Expires, and cache-control can overlap a bit, and if you aren’t careful you can end up giving conflicting information if you decide to use all of them! For a more in-depth discussion of the various merits, take a look at the book REST In Practice (O’Reilly) or read section 13 of the HTTP 1.1 specification, which describes how both clients and servers are supposed to implement these various controls.
Whether you decide to use HTTP as an interservice protocol, caching at the client and reducing the need for round-trips to the client is well worth it. If you decide to pick a different protocol, understand when and how you can provide hints to the client to help it understand how long it can cache for.
Caching for Writes
Although you’ll find yourself using caching for reads more often, there are some use cases where caching for writes make sense. For example, if you make use of a write-behind cache, you can write to a local cache, and at some later point the data will be flushed to a downstream source, probably the canonical source of data. This can be useful when you have bursts of writes, or when there is a good chance that the same data will be written multiple times. When used to buffer and potentially batch writes, write-behind caches can be a useful further performance optimization.
With a write-behind cache, if the buffered writes are suitably persistent, even if the downstream service is unavailable we could queue up the writes and send them through when it is available again.
Caching for Resilience
Caching can be used to implement resiliency in case of failure. With client-side caching, if the downstream service is unavailable, the client could decide to simply use cached but potentially stale data. We could also use something like a reverse proxy to serve up stale data. For some systems, being available even with stale data is better than not returning a result at all, but that is a judgment call you’ll have to make. Obviously, if we don’t have the requested data in the cache, then we can’t do much to help, but there are ways to mitigate this.
A technique I saw used at the Guardian, and subsequently elsewhere, was to crawl the existing live site periodically to generate a static version of the website that could be served in the event of an outage. Although this crawled version wasn’t as fresh as the cached content served from the live system, in a pinch it could ensure that a version of the site would get displayed.
Hiding the Origin
With a normal cache, if a request results in a cache miss, the request goes on to the origin to fetch the fresh data with the caller blocking, waiting on the result. In the normal course of things, this is to be expected. But if we suffer a massive cache miss, perhaps because an entire machine (or group of machines) that provide our cache fail, a large number of requests will hit the origin.
For those services that serve up highly cachable data, it is common for the origin itself to be scaled to handle only a fraction of the total traffic, as most requests get served out of memory by the caches that sit in front of the origin. If we suddenly get a thundering herd due to an entire cache region vanishing, our origin could be pummelled out of existence.
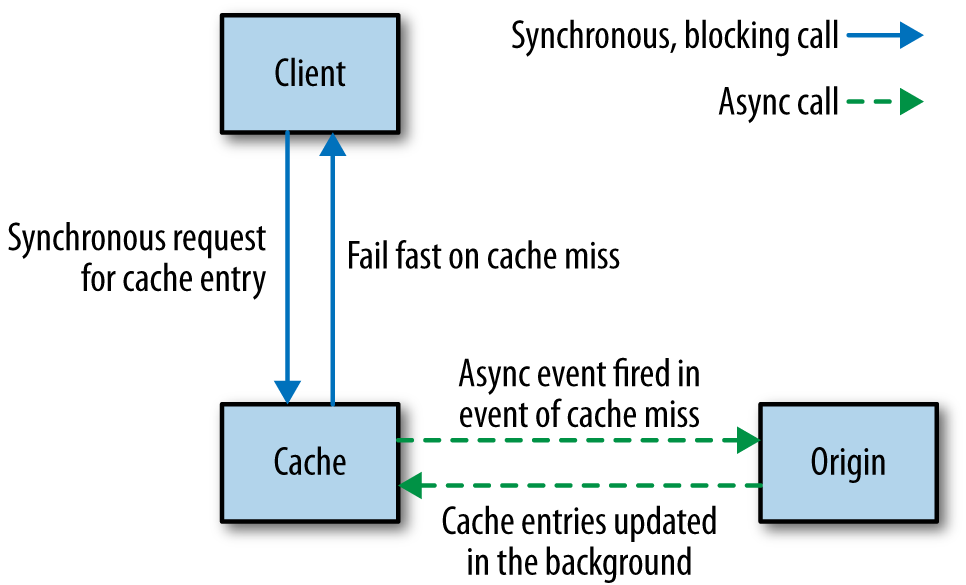
One way to protect the origin in such a situation is never to allow requests to go to the origin in the first place. Instead, the origin itself populates the cache asynchronously when needed, as shown in Figure 1-7. If a cache miss is caused, this triggers an event that the origin can pick up on, alerting it that it needs to repopulate the cache. So if an entire shard has vanished, we can rebuild the cache in the background. We could decide to block the original request waiting for the region to be repopulated, but this could cause contention on the cache itself, leading to further problems. It’s more likely if we are prioritizing keeping the system stable that we would fail the original request, but it would fail fast.
This sort of approach may not make sense for some situations, but it can be a way to ensure the system remains up when parts of it fail. By failing requests fast, and ensuring we don’t take up resources or increase latency, we avoid a failure in our cache from cascading downstream and give ourselves a chance to recover.
Keep It Simple
Be careful about caching in too many places! The more caches between you and the source of fresh data, the more stale the data can be, and the harder it can be to determine the freshness of the data that a client eventually sees. This can be especially problematic with a microservice architecture where you have multiple services involved in a call chain. Again, the more caching you have, the harder it will be to assess the freshness of any piece of data. So if you think a cache is a good idea, keep it simple, stick to one, and think carefully before adding more!
Cache Poisoning: A Cautionary Tale
With caching we often think that if we get it wrong the worst thing that can happen is we serve stale data for a bit. But what happens if you end up serving stale data forever? Earlier I mentioned the project I worked on where we were using a strangler application to help intercept calls to multiple legacy systems with a view of incrementally retiring them. Our application operated effectively as a proxy. Traffic to our application was routed through to the legacy application. On the way back, we did a few housekeeping things; for example, we made sure that the results from the legacy application had proper HTTP cache headers applied.
One day, shortly after a normal routine release, something odd started happening. A bug had been introduced whereby a small subset of pages were falling through a logic condition in our cache header insertion code, resulting in us not changing the header at all. Unfortunately, this downstream application had also been changed sometime previously to include an Expires: Never HTTP header. This hadn’t had any effect earlier, as we were overriding this header. Now we weren’t.
Our application made heavy use of Squid to cache HTTP traffic, and we noticed the problem quite quickly as we were seeing more requests bypassing Squid itself to hit our application servers. We fixed the cache header code and pushed out a release, and also manually cleared the relevant region of the Squid cache. However, that wasn’t enough.
As I mentioned earlier, you can cache in multiple places. When it comes to serving up content to users of a public-facing web application, you could have multiple caches between you and your customer. Not only might you be fronting your website with something like a CDN, but some ISPs make use of caching. Can you control those caches? And even if you could, there is one cache that you have little control over: the cache in a user’s browser.
Those pages with Expires: Never stuck in the caches of many of our users, and would never be invalidated until the cache became full or the user cleaned them out manually. Clearly we couldn’t make either thing happen; our only option was to change the URLs of these pages so they were refetched.
Caching can be very powerful indeed, but you need to understand the full path of data that is cached from source to destination to really appreciate its complexities and what can go wrong.
Autoscaling
If you are lucky enough to have fully automatable provisioning of virtual hosts, and can fully automate the deployment of your microservice instances, then you have the building blocks to allow you to automatically scale your microservices.
For example, you could also have the scaling triggered by well-known trends. You might know that your system’s peak load is between 9 a.m. and 5 p.m., so you bring up additional instances at 8:45 a.m., and turn them off at 5:15 p.m.. If you’re using something like AWS (which has very good support for autoscaling built in), turning off instances you don’t need any longer will help save money. You’ll need data to understand how your load changes over time, from day to day, week to week. Some businesses have obvious seasonal cycles too, so you may need data going back a fair way to make proper judgment calls.
On the other hand, you could be reactive, bringing up additional instances when you see an increase in load or an instance failure, and remove instances when you no longer needed them. Knowing how fast you can scale up once you spot an upward trend is key. If you know you’ll only get a couple of minutes’ notice about an increase in load, but scaling up will take you at least 10 minutes, you know you’ll need to keep extra capacity around to bridge this gap. Having a good suite of load tests is almost essential here. You can use them to test your autoscaling rules. If you don’t have tests that can reproduce different loads that will trigger scaling, then you’re only going to find out in production if you got the rules wrong. And the consequences of failure aren’t great!
A news site is a great example of a type of business where you may want a mix of predictive and reactive scaling. On the last news site I worked on, we saw very clear daily trends, with views climbing from the morning to lunchtime and then starting to decline. This pattern was repeated day in, day out, with traffic less pronounced at the weekend. That gave you a fairly clear trend that could drive proactive scaling up (and down) of resources. On the other hand, a big news story would cause an unexpected spike, requiring more capacity at often short notice.
I actually see autoscaling used much more for handling failure of instances than for reacting to load conditions. AWS lets you specify rules like “There should be at least 5 instances in this group,” so if one goes down a new one is automatically launched. I’ve seen this approach lead to a fun game of whack-a-mole when someone forgets to turn off the rule and then tries to take down the instances for maintenance, only to see them keep spinning up!
Both reactive and predictive scaling are very useful, and can help you be much more cost effective if you’re using a platform that allows you to pay only for the computing resources you use. But they also require careful observation of the data available to you. I’d suggest using autoscaling for failure conditions first while you collect the data. Once you want to start scaling for load, make sure you are very cautious about scaling down too quickly. In most situations, having more computing power at your hands than you need is much better than not having enough!
CAP Theorem
We’d like to have it all, but unfortunately we know we can’t. And when it comes to distributed systems like those we build using microservice architectures, we even have a mathematical proof that tells us we can’t. You may well have heard about the CAP theorem, especially in discussions about the merits of various different types of data stores. At its heart it tells us that in a distributed system, we have three things we can trade off against each other: consistency, availability, and partition tolerance. Specifically, the theorem tells us that we get to keep two in a failure mode.
Consistency is the system characteristic by which I will get the same answer if I go to multiple nodes. Availability means that every request receives a response. Partition tolerance is the system’s ability to handle the fact that communication between its parts is sometimes impossible.
Since Eric Brewer published his original conjecture, the idea has gained a mathematical proof. I’m not going to dive into the math of the proof itself, as not only is this not that sort of book, but I can also guarantee that I would get it wrong. Instead, let’s use some worked examples that will help us understand that under it all, the CAP theorem is a distillation of a very logical set of reasoning.
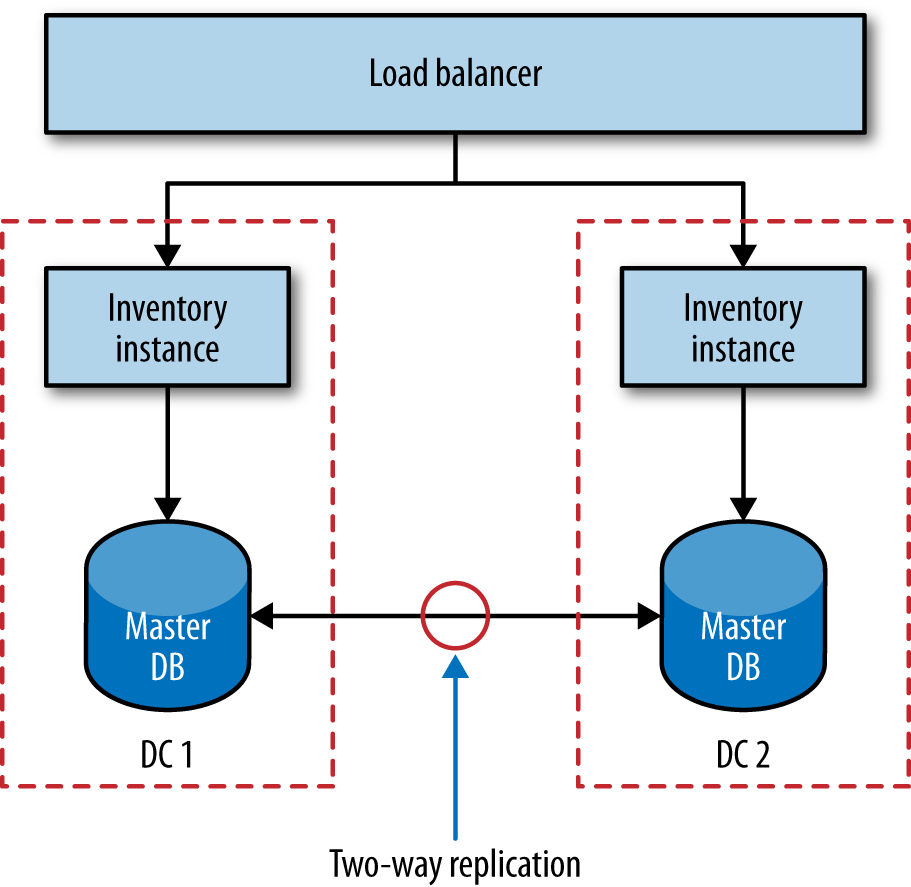
We’ve already talked about some simple database scaling techniques. Let’s use one of these to probe the ideas behind the CAP theorem. Let’s imagine that our inventory service is deployed across two separate data centers, as shown in Figure 1-8. Backing our service instance in each data center is a database, and these two databases talk to each other to try to synchronize data between them. Reads and writes are done via the local database node, and replication is used to synchronize the data between the nodes.
Now let’s think about what happens when something fails. Imagine that something as simple as the network link between the two data centers stops working. The synchronization at this point fails. Writes made to the primary database in DC1 will not propagate to DC2, and vice versa. Most databases that support these setups also support some sort of queuing technique to ensure that we can recover from this afterward, but what happens in the meantime?
Sacrificing Consistency
Let’s assume that we don’t shut the inventory service down entirely. If I make a change now to the data in DC1, the database in DC2 doesn’t see it. This means any requests made to our inventory node in DC2 see potentially stale data. In other words, our system is still available in that both nodes are able to serve requests, and we have kept the system running despite the partition, but we have lost consistency. This is often called a AP system. We don’t get to keep all three.
During this partition, if we keep accepting writes then we accept the fact that at some point in the future they have to be resynchronized. The longer the partition lasts, the more difficult this resynchronization can become.
The reality is that even if we don’t have a network failure between our database nodes, replication of data is not instantaneous. As touched on earlier, systems that are happy to cede consistency to keep partition tolerance and availability are said to be eventually consistent; that is, we expect at some point in the future that all nodes will see the updated data, but it won’t happen at once so we have to live with the possibility that users see old data.
Sacrificing Availability
What happens if we need to keep consistency and want to drop something else instead? Well, to keep consistency, each database node needs to know the copy of the data it has is the same as the other database node. Now in the partition, if the database nodes can’t talk to each other, they cannot coordinate to ensure consistency. We are unable to guarantee consistency, so our only option is to refuse to respond to the request. In other words, we have sacrificed availability. Our system is consistent and partition tolerant, or CP. In this mode our service would have to work out how to degrade functionality until the partition is healed and the database nodes can be resynchronized.
Consistency across multiple nodes is really hard. There are few things (perhaps nothing) harder in distributed systems. Think about it for a moment. Imagine I want to read a record from the local database node. How do I know it is up to date? I have to go and ask the other node. But I also have to ask that database node to not allow it to be updated while the read completes; in other words, I need to initiate a transactional read across multiple database nodes to ensure consistency. But in general people don’t do transactional reads, do they? Because transactional reads are slow. They require locks. A read can block an entire system up. All consistent systems require some level of locking to do their job.
As we’ve already discussed, distributed systems have to expect failure. Consider our transactional read across a set of consistent nodes. I ask a remote node to lock a given record while the read is initiated. I complete the read, and ask the remote node to release its lock, but now I can’t talk to it. What happens now? Locks are really hard to get right even in a single process system, and are significantly more difficult to implement well in a distributed system.
Remember when we talked about distributed transactions in Chapter 5? The core reason they are challenging is because of this problem with ensuring consistency across multiple nodes.
Getting multinode consistency right is so hard that I would strongly, strongly suggest that if you need it, don’t try to invent it yourself. Instead, pick a data store or lock service that offers these characteristics. Consul, for example, which we’ll discuss shortly, implements a strongly consistent key/value store designed to share configuration between multiple nodes. Along with “Friends don’t let friends write their own crypto” should go “Friends don’t let friends write their own distributed consistent data store.” If you think you need to write your own CP data store, read all the papers on the subject first, then get a PhD, and then look forward to spending a few years getting it wrong. Meanwhile, I’ll be using something off the shelf that does it for me, or more likely trying really hard to build eventually consistent AP systems instead.
Sacrificing Partition Tolerance?
We get to pick two, right? So we’ve got our eventually consistent AP system. We have our consistent, but hard to build and scale, CP system. Why not a CA system? Well, how can we sacrifice partition tolerance? If our system has no partition tolerance, it can’t run over a network. In other words, it needs to be a single process operating locally. CA systems don’t exist in distributed systems.
AP or CP?
Which is right, AP or CP? Well, the reality is it depends. As the people building the system, we know the trade-off exists. We know that AP systems scale more easily and are simpler to build, and we know that a CP system will require more work due to the challenges in supporting distributed consistency. But we may not understand the business impact of this trade-off. For our inventory system, if a record is out of date by five minutes, is that OK? If the answer is yes, an AP system might be the answer. But what about the balance held for a customer in a bank? Can that be out of date? Without knowing the context in which the operation is being used, we can’t know the right thing to do. Knowing about the CAP theorem just helps you understand that this trade-off exists and what questions to ask.
It’s Not All or Nothing
Our system as a whole doesn’t need to be either AP or CP. Our catalog could be AP, as we don’t mind too much about a stale record. But we might decide that our inventory service needs to be CP, as we don’t want to sell a customer something we don’t have and then have to apologize later.
But individual services don’t even need to be CP or AP.
Let’s think about our points balance service, where we store records of how many loyalty points our customers have built up. We could decide that we don’t care if the balance we show for a customer is stale, but that when it comes to updating a balance we need it to be consistent to ensure that customers don’t use more points than they have available. Is this microservice CP, or AP, or is it both? Really, what we have done is push the trade-offs around the CAP theorem down to individual service capabilities.
Another complexity is that neither consistency nor availability is all or nothing. Many systems allow us a far more nuanced trade-off. For example, with Cassandra I can make different trade-offs for individual calls. So if I need strict consistency, I can perform a read that blocks until all replicas have responded confirming the value is consistent, or until a specific quorum of replicas have responded, or even just a single node. Obviously, if I block waiting for all replicas to report back and one of them is unavailable, I’ll be blocking for a long time. But if I am satisfied with just a simple quorum of nodes reporting back, I can accept some lack of consistency to be less vulnerable to a single replica being unavailable.
You’ll often see posts about people beating the CAP theorem. They haven’t. What they have done is create a system where some capabilities are CP, and some are AP. The mathematical proof behind the CAP theorem holds. Despite many attempts at school, I’ve learned that you don’t beat math.
And the Real World
Much of what we’ve talked about is the electronic world—bits and bytes stored in memory. We talk about consistency in an almost child-like fashion; we imagine that within the scope of the system we have created, we can stop the world and have it all make sense. And yet so much of what we build is just a reflection of the real world, and we don’t get to control that, do we?
Let’s revisit our inventory system. This maps to real-world, physical items. We keep a count in our system of how many albums we have. At the start of the day we had 100 copies of Give Blood by The Brakes. We sold one. Now we have 99 copies. Easy, right? By what happens if when the order was being sent out, someone knocks a copy of the album onto the floor and it gets stepped on and broken? What happens now? Our systems say 99, but there are 98 copies on the shelf.
What if we made our inventory system AP instead, and occasionally had to contact a user later on and tell him that one of his items is actually out of stock? Would that be the worst thing in the world? It would certainly be much easier to build, scale, and ensure it is correct.
We have to recognize that no matter how consistent our systems might be in and of themselves, they cannot know everything that happens, especially when we’re keeping records of the real world. This is one of the main reasons why AP systems end up being the right call in many situations. Aside from the complexity of building CP systems, they can’t fix all our problems anyway.
Service Discovery
Once you have more than a few microservices lying around, your attention inevitably turns to knowing where on earth everything is. Perhaps you want to know what is running in a given environment so you know what you should be monitoring. Maybe it’s as simple as knowing where your accounts service is so that those microservices that use it know where to find it. Or perhaps you just want to make it easy for developers in your organization to know what APIs are available so they don’t reinvent the wheel. Broadly speaking, all of these use cases fall under the banner of service discovery. And as always with microservices, we have quite a few different options at our disposal for dealing with it.
All of the solutions we’ll look at handle things in two parts. First, they provide some mechanism for an instance to register itself and say, “I’m here!” Second, they provide a way to find the service once it’s registered. Service discovery gets more complicated, though, when we are considering an environment where we are constantly destroying and deploying new instances of services. Ideally, we’d want whatever solution we pick to cope with this.
Let’s look at some of the most common solutions to service delivery and consider our options.
DNS
It’s nice to start simple. DNS lets us associate a name with the IP address of one or more machines. We could decide, for example, that our accounts service is always found at accounts.musiccorp.com. We would then have that entry point to the IP address of the host running that service, or perhaps have it resolve to a load balancer that is distributing load across a number of instances. This means we’d have to handle updating these entries as part of deploying our service.
When dealing with instances of a service in different environments, I have seen a convention-based domain template work well. For example, we might have a template defined as <servicename>-<environment>.musiccorp.com, giving us entries like accounts-uat.musiccorp.com or accounts-dev.musiccorp.com.
A more advanced way of handling different environments is to have different domain name servers for different environments. So I could assume that accounts.musiccorp.com is where I always find the accounts service, but it could resolve to different hosts depending on where I do the lookup. If you already have your environments sitting in different network segments and are comfortable with managing your own DNS servers and entries, this could be quite a neat solution, but it is a lot of work if you aren’t getting other benefits from this setup.
DNS has a host of advantages, the main one being it is such a well-understood and well-used standard that almost any technology stack will support it. Unfortunately, while a number of services exist for managing DNS inside an organization, few of them seem designed for an environment where we are dealing with highly disposable hosts, making updating DNS entries somewhat painful. Amazon’s Route53 service does a pretty good job of this, but I haven’t seen a self-hosted option that is as good yet, although (as we’ll discuss shortly) Consul may help us here. Aside from the problems in updating DNS entries, the DNS specification itself can cause us some issues.
DNS entries for domain names have a time to live (TTL). This is how long a client can consider the entry fresh. When we want to change the host to which the domain name refers, we update that entry, but we have to assume that clients will be holding on to the old IP for at least as long as the TTL states. DNS entries can get cached in multiple places (even the JVM will cache DNS entries unless you tell it not to), and the more places they are cached in, the more stale the entry can be.
One way to work around this problem is to have the domain name entry for your service point to a load balancer, which in turn points to the instances of your service, as shown in Figure 1-9. When you deploy a new instance, you can take the old one out of the load-balancer entry and add the new one. Some people use DNS round-robining, where the DNS entries themselves refer to a group of machines. This technique is extremely problematic, as the client is hidden from the underlying host, and therefore cannot easily stop routing traffic to one of the hosts should it become sick.
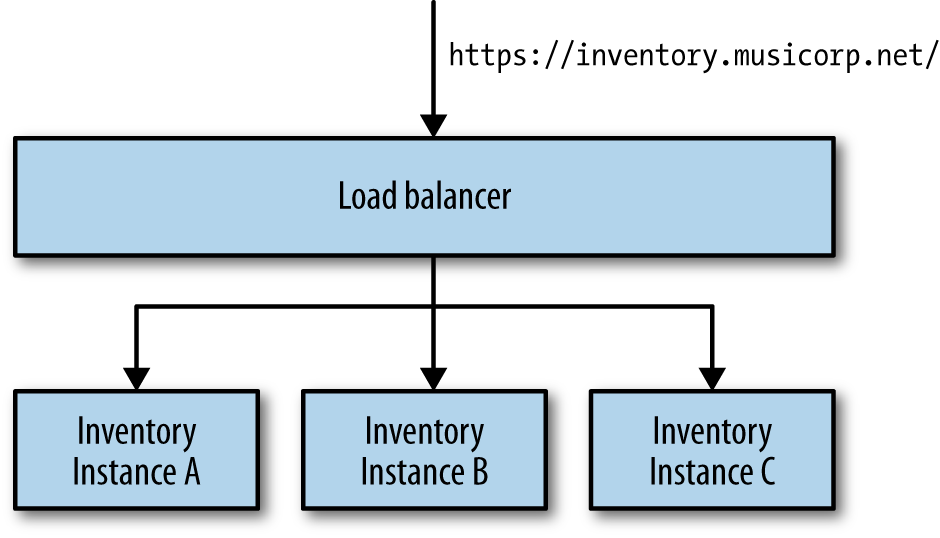
As mentioned, DNS is well understood and widely supported. But it does have one or two downsides. I would suggest investigating whether it is a good fit for you before picking something more complex. For a situation where you have only single nodes, having DNS refer directly to hosts is probably fine. But for those situations where you need more than one instance of a host, have DNS entries resolve to load balancers that can handle putting individual hosts into and out of service as appropriate.
Dynamic Service Registries
The downsides of DNS as a way of finding nodes in a highly dynamic environment have led to a number of alternative systems, most of which involve the service registering itself with some central registry, which in turn offers the ability to look up these services later on. Often, these systems do more than just providing service registration and discovery, which may or may not be a good thing. This is a crowded field, so we’ll just look at a few options to give you a sense of what is available.
Zookeeper
Zookeeper was originally developed as part of the Hadoop project. It is used for an almost bewildering array of use cases, including configuration management, synchronizing data between services, leader election, message queues, and (usefully for us) as a naming service.
Like many similar types of systems, Zookeeper relies on running a number of nodes in a cluster to provide various guarantees. This means you should expect to be running at least three Zookeeper nodes. Most of the smarts in Zookeeper are around ensuring that data is replicated safely between these nodes, and that things remain consistent when nodes fail.
At its heart, Zookeeper provides a hierarchical namespace for storing information. Clients can insert new nodes in this hierarchy, change them, or query them. Furthermore, they can add watches to nodes to be told when they change. This means we could store the information about where our services are located in this structure, and as a client be told when they change. Zookeeper is often used as a general configuration store, so you could also store service-specific configuration in it, allowing you to do tasks like dynamically changing log levels or turning off features of a running system. Personally, I tend to shy away from the use of systems like Zookeeper as a configuration source, as I think it can make it harder to reason about the behavior of a given service.
Zookeeper itself is fairly generic in what it offers, which is why it is used for so many use cases. You can think of it just as a replicated tree of information that you can be alerted about when it changes. This means that you’ll typically build things on top of it to suit your particular use case. Luckily, client libraries exist for most languages out there.
In the grand scheme of things, Zookeeper could be considered old by now, and doesn’t provide us that much functionality out of the box to help with service discovery compared to some of the newer alternatives. That said, it is certainly tried and tested, and widely used. The underlying algorithms Zookeeper implements are quite hard to get right. I know one database vendor, for example, that was using Zookeeper just for leader election in order to ensure that a primary node got properly promoted during failure conditions. The client felt that Zookeeper was too heavyweight and spent a long time ironing out bugs in its own implementation of the PAXOS algorithm to replace what Zookeeper did. People often say you shouldn’t write your own cryptography libraries. I’d extend that by saying you shouldn’t write your own distributed coordination systems either. There is a lot to be said for using existing stuff that just works.
Consul
Like Zookeeper, Consul supports both configuration management and service discovery. But it goes further than Zookeeper in providing more support for these key use cases. For example, it exposes an HTTP interface for service discovery, and one of Consul’s killer features is that it actually provides a DNS server out of the box; specifically, it can serve SRV records, which give you both an IP and port for a given name. This means if part of your system uses DNS already and can support SRV records, you can just drop in Consul and start using it without any changes to your existing system.
Consul also builds in other capabilities that you might find useful, such as the ability to perform health checks on nodes. This means that Consul could well overlap the capabilities provided by other dedicated monitoring tools, although you would more likely use Consul as a source of this information and then pull it into a more comprehensive dashboard or alerting system. Consul’s highly fault-tolerant design and focus on handling systems that make heavy use of ephemeral nodes does make me wonder, though, if it may end up replacing systems like Nagios and Sensu for some use cases.
Consul uses a RESTful HTTP interface for everything from registering a service, querying the key/value store, or inserting health checks. This makes integration with different technology stacks very straightforward. One of the other things I really like about Consul is that the team behind it has split out the underlying cluster management piece. Serf, which Consul sits on top of, handles detection of nodes in a cluster, failure management, and alerting. Consul then adds service discovery and configuration management. This separation of concerns appeals to me, which should be no surprise to you given the themes that run through this book!
Consul is very new, and given the complexity of the algorithms it uses, this would normally make me hesitant in recommending it for such an important job. That said, Hashicorp, the team behind it, certainly has a great track record in creating very useful open source technology (in the form of both Packer and Vagrant), the project is being actively developed, and I’ve spoken to a few people who are happily using it in production. Given that, I think it is well worth a look.
Eureka
Netflix’s open source Eureka system bucks the trend of systems like Consul and Zookeeper in that it doesn’t also try to be a general-purpose configuration store. It is actually very targeted in its use case.
Eureka also provides basic load-balancing capabilities in that it can support basic round-robin lookup of service instances.
It provides a REST-based endpoint so you can write your own clients, or you can use its own Java client. The Java client provides additional capabilities, such as health checking of instances. Obviously if you bypass Eureka’s own client and go directly to the REST endpoint, you’re on your own there.
By having the clients deal with service discovery directly, we avoid the need for a separate process. However, you do require that every client implement service discovery. Netflix, which standardizes on the JVM, achieves this by having all clients use Eureka. If you’re in a more polyglot environment, this may be more of a challenge.
Rolling Your Own
One approach I have used myself and seen done elsewhere is to roll your own system. On one project we were making heavy use of AWS, which offers the ability to add tags to instances. When launching service instances, I would apply tags to help define what the instance was and what it was used for. These allowed for some rich metadata to be associated with a given host, for example:
-
service = accounts
-
environment = production
-
version = 154
I could then use the AWS APIs to query all the instances associated with a given AWS account to find machines I cared about. Here, AWS itself is handling the storing of the metadata associated with each instance, and providing us with the ability to query it. I then built command-line tools for interacting with these instances, and making dashboards for status monitoring becomes fairly easy, especially if you adopt the idea of having each service instance exposing health check details.
The last time I did this we didn’t go as far as having services use the AWS APIs to find their service dependencies, but there is no reason why you couldn’t. Obviously, if you want upstream services to be alerted when the location of a downstream service changes, you’re on your own.
Don’t Forget the Humans!
The systems we’ve looked at so far make it easy for a service instance to register itself and look up other services it needs to talk to. But as humans we sometimes want this information too. Whatever system you pick, make sure you have tools available that let you build reports and dashboards on top of these registries to create displays for humans, not just for computers.
Documenting Services
By decomposing our systems into finer-grained microservices, we’re hoping to expose lots of seams in the form of APIs that people can use to do many, hopefully wonderful, things. If you get your discovery right, we know where things are. But how do we know what those things do, or how to use them? One option is obviously to have documentation about the APIs. Of course, documentation can often be out of date. Ideally, we’d ensure that our documentation is always up to date with the microservice API, and make it easy to see this documentation when we know where a service endpoint is. Two different pieces of technology, Swagger and HAL, try to make this a reality, and both are worth looking at.
Swagger
Swagger lets you describe your API in order to generate a very nice web UI that allows you to view the documentation and interact with the API via a web browser. The ability to execute requests is very nice: you can define POST templates, for example, making it clear what sort of content the server expects.
To do all of this, Swagger needs the service to expose a sidecar file matching the Swagger format. Swagger has a number of libraries for different languages that does this for you. For example, for Java you can annotate methods that match your API calls, and the file gets generated for you.
I like the end-user experience that Swagger gives you, but it does little for the incremental exploration concept at the heart of hypermedia. Still, it’s a pretty nice way to expose documentation about your services.
HAL and the HAL Browser
By itself, the Hypertext Application Language (HAL) is a standard that describes standards for hypermedia controls that we expose. As we covered in Chapter 4, hypermedia controls are the means by which we allow clients to progressively explore our APIs to use our service’s capabilities in a less coupled fashion than other integration techniques. If you decide to adopt HAL’s hypermedia standard, then not only can you make use of a wide number of client libraries for consuming the API (at the time of writing, the HAL wiki listed 50 supporting libraries for a number of different languages), but you can also make use of the HAL browser, which gives you a way to explore the API via a web browser.
Like Swagger, this UI can be used not only to act as living documentation, but also to execute calls against the service itself. Executing calls isn’t quite as slick, though. Whereas with Swagger you can define templates to do things like issue a POST request, with HAL you’re more on your own. The flipside to this is that the inherent power of hypermedia controls lets you much more effectively explore the API exposed by the service, as you can follow links around very easily. It turns out that web browsers are pretty good at that sort of thing!
Unlike with Swagger, all the information needed to drive this documentation and sandbox is embedded in the hypermedia controls. This is a double-edged sword. If you are already using hypermedia controls, it takes little effort to expose a HAL browser and have clients explore your API. However, if you aren’t using hypermedia, you either can’t use HAL or have to retrofit your API to use hypermedia, which is likely to be an exercise that breaks existing consumers.
The fact that HAL also describes a hypermedia standard with some supporting client libraries is an added bonus, and I suspect is a big reason why I’ve seen more uptake of HAL as a way of documenting APIs than Swagger for those people already using hypermedia controls. If you’re using hypermedia, my recommendation is to go with HAL over Swagger. But if you’re not using hypermedia and can’t justify the switch, I’d definitely suggest giving Swagger a go.
The Self-Describing System
During the early evolution of SOA, standards like Universal Description, Discovery, and Integration (UDDI) emerged to help people make sense of what services were running. These approaches were fairly heavyweight, which led to alternative techniques to try to make sense of our systems. Martin Fowler discussed the concept of the humane registry, where a much more lightweight approach is simply to have a place where humans can record information about the services in the organization in something as basic as a wiki.
Getting a picture of our system and how it is behaving is important, especially when we’re at scale. We’ve covered a number of different techniques that will help us gain understanding directly from our system. By tracking the health of our downstream services together with correlation IDs to help us see call chains, we can get real data in terms of how our services interrelate. Using service discovery systems like Consul, we can see where our microservices are running. HAL lets us see what capabilities are being hosted on any given endpoint, while our health-check pages and monitoring systems let us know the health of both the overall system and individual services.
All of this information is available programatically. All of this data allows us to make our humane registry more powerful than a simple wiki page that will no doubt get out of date. Instead, we should use it to harness and display all the information our system will be emitting. By creating custom dashboards, we can pull together the vast array of information that is available to help us make sense of our ecosystem.
By all means, start with something as simple as a static web page or wiki that perhaps scrapes in a bit of data from the live system. But look to pull in more and more information over time. Making this information readily available is a key tool to managing the emerging complexity that will come from running these systems at scale.
Summary
As a design approach, microservices are still fairly young, so although we have some notable experiences to draw upon, I’m sure the next few years will yield more useful patterns in handling them at scale. Nonetheless, I hope this chapter has outlined some steps you can take on your journey to microservices at scale that will hold you in good stead.
In addition to what I have covered here, I recommend Michael Nygard’s excellent book Release It!. In it he shares a collection of stories about system failure and some patterns to help deal with it well. The book is well worth a read (in fact, I would go so far as to say it should be considered essential reading for anyone building systems at scale).
We’ve covered quite a lot of ground, and we’re nearing the end. In our next and final chapter, we will look to pull everything back together and summarize what we have learned in the book overall.