
 Noah's Ark - Nuremburg Chronicle 15th century (source: Noah's Ark - Nuremburg Chronicle 15th century)
 My experience of being a data scientist is not at all like what I’ve read in books and blogs. I’ve read about data scientists working for digital superstar companies. They sound like heroes writing automated (near sentient) algorithms constantly churning out insights. I’ve read about MacGyver-like data scientist hackers who save the day by cobbling together data products from whatever raw material they have around.
The data products my team creates are not important enough to justify huge enterprise-wide infrastructures. It’s just not worth it to invest in hyper-efficient automation and production control. On the other hand, our data products influence important decisions in the enterprise, and it’s important that our efforts scale. We can’t afford to do things manually all the time, and we need efficient ways of sharing results with tens of thousands of people.
There are a lot of us out there — the “regular” data scientists; we’re more organized than hackers but with no need for a superhero-style data science lair. A group of us met and held a speed ideation event, where we brainstormed on the best practices we need to write solid code. This article is a summary of the conversation and an attempt to collect our knowledge, distill it, and present it in one place.
Going pro
Data scientists need software engineering skills — just not all the skills a professional software engineer needs. I call data scientists with essential data product engineering skills “professional” data science programmers. Professionalism isn’t a possession like a certification or hours of experience; I’m talking about professionalism as an approach. The professional data science programmer is self-correcting in their creation of data products. They have general strategies for recognizing where their work sucks and correcting the problem.
The professional data science programmer has to turn a hypothesis into software capable of testing that hypothesis. Data science programming is unique in software engineering because of the types of problems data scientists tackle. The big challenge is that the nature of data science is experimental. The challenges are often difficult, and the data is messy. For many of these problems, there is no known solution strategy, the path toward a solution is not known ahead of time, and possible solutions are best explored in small steps. In what follows, I describe general strategies for a disciplined, productive trial and error: breaking problems into small steps, trying solutions, and making corrections along the way.
Think like a pro
To be a professional data science programmer, you have to know more than how the systems are structured. You have to know how to design a solution, you have to be able to recognize when you have a solution, and you have to be able to recognize when you don’t fully understand your solution. That last point is essential to being self-correcting. When you recognize the conceptual gaps in your approach, you can fill them in yourself. To design a data science solution in a way that you can be self-correcting, I’ve found it useful to follow the basic process of look, see, imagine, and show.
Step 1: Look. Start by scanning the environment. Do background research and become aware of all the pieces that might be related to the problem you are trying to solve. Look at your problem in as much breadth as you can. Get visibility to as much of your situation as you can and collect disparate pieces of information.
Step 2: See. Take the disparate pieces you discovered and chunk them into abstractions that correspond to elements of the blackboard pattern. At this stage, you are casting elements of the problem into meaningful, technical concepts. Seeing the problem is a critical step for laying the groundwork for creating a viable design.
Step 3: Imagine. Given the technical concepts you see, imagine some implementation that moves you from the present to your target state. If you can’t imagine an implementation, then you probably missed something when you looked at the problem.
Step 4: Show. Explain your solution first to yourself, then to a peer, then to your boss, and finally to a target user. Each of these explanations need only be just formal enough to get your point across: a water-cooler conversation, an email, a 15-minute walk-through. This is the most important regular practice in becoming a self-correcting professional data science programmer. If there are any holes in your approach, they’ll most likely come to light when you try to explain it. Take the time to fill in the gaps and make sure you can properly explain the problem and its solution.
Design like a pro
The activities of creating and releasing a data product are varied and complex, but, typically, what you do will fall somewhere in what Alistair Croll describes as the big data supply chain.
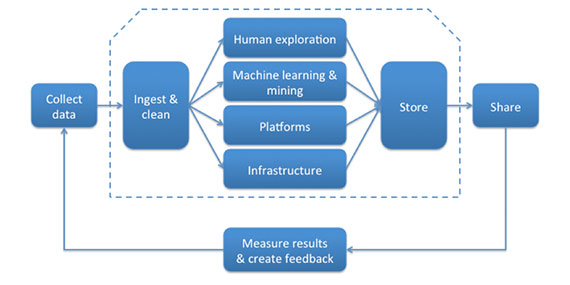
Because data products execute according to a paradigm (real time, batch mode, or some hybrid of the two), you will likely find yourself participating in a combination of data supply chain activity and a data-product paradigm: ingesting and cleaning batch-updated data, building an algorithm to analyze real-time data, sharing the results of a batch process, etc. Fortunately, the blackboard architectural pattern gives us a basic blueprint for good software engineering in any of these scenarios.
The blackboard pattern
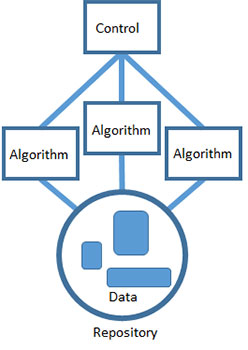
The blackboard pattern tells us to solve problems by dividing the overall task of finding a solution into a set of smaller, self-contained subtasks. Each subtask transforms your hypothesis into one that’s easier to solve or a hypothesis whose solution is already known. Each task gradually improves the solution and leads, hopefully, to a viable resolution.
Data science is awash in tools, each with its own unique virtues. Productivity is a big deal, and I like letting my team choose whatever tools they are most familiar with. Using the blackboard pattern makes it okay to build data products from a collection of different technologies. Cooperation between algorithms happens through a shared repository. Each algorithm can access data, process it as input and deliver the results back to the repository for some other algorithm to use as input.
Last, the algorithms are all coordinated using a single control component that represents the heuristic used to solve the problem. The control is the implementation of the strategy you’ve chosen to solve the problem. This is the highest level of abstraction and understanding of the problem, and it’s implemented by a technology that can interface with and determine the order of all the other algorithms. The control can be something automated like a cron job or a script. Or it can be manual, like a person that executes the different steps in the proper order. But overall, it’s the total strategy for solving the problem. It’s the one place you can go to see the solution to the problem from start to finish.
This basic approach has proven useful in constructing software systems that have to solve uncertain, hypothetical problems using incomplete data. The best part is that it lets us make progress to an uncertain problem using certain, deterministic pieces. Unfortunately, there is no guarantee that your efforts will actually solve the problem. It’s better to know sooner rather than later if you are going down a path that won’t work. You do this using the order in which you implement the system.
Build like a pro
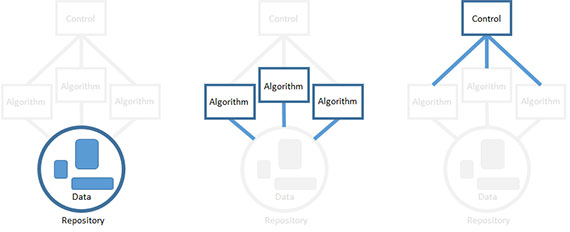
You don’t have to build the elements of a data product in a set order (i.e. build the repository first, then the algorithms, then the controller). The professional approach is to build in the order of highest technical risk. Start with the riskiest element first, and go from there. An element can be technically risky for a lot of reasons. The riskiest part may be the one that has the highest workload or the part you understand the least.
You can build out components in any order by focusing on a single element and stubbing out the rest. If you decide, for example, to start by building an algorithm, dummy up the input data and define a temporary spot to write the algorithm’s output.
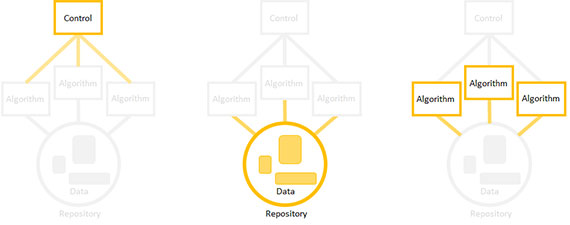
Then, implement a data product in the order of technical risk: riskiest elements first. Focus on a particular element, stub out the rest, replace the stubs later.
The key is to build and run in small pieces: write algorithms in small steps that you understand, build the repository one data source at a time, and build your control one algorithm execution step at a time. The goal is to have a working data product at all times — it just won’t be fully-functioning until the end.
Tools of the pro
Every pro needs quality tools. There are a lot of choices available. The following is a list of some of the most commonly used tools with links you can follow to learn more about them:
Visualization:
- D3.js: D3.js (or just D3, for Data-Driven Documents) is a JavaScript library for producing dynamic, interactive data visualizations in Web browsers. It makes use of the widely implemented SVG, HTML5, and CSS standards.
Version control:
- GitHub: GitHub is a Web-based Git repository hosting service that offers all of the distributed revision control and source code management (SCM) functionality of Git as well as adding its own features. GitHub provides a Web-based graphical interface and desktop as well as mobile integration.
Programming languages:
- R: R is a programming language and software environment for statistical computing and graphics. The R language is widely used among statisticians and data miners for developing statistical software and data analysis.
- Python: Python is a widely used general-purpose, high-level programming language. Its design philosophy emphasizes code readability, and its syntax allows programmers to express concepts in fewer lines of code than would be possible in languages such as C++ or Java.
- Scala: Scala is an object-functional programming language for general software applications. Scala has full support for functional programming and a very strong static type system. This allows programs written in Scala to be very concise and thus smaller in size than other general-purpose programming languages.
- Java: Java is a general-purpose computer programming language that is concurrent, class-based, object-oriented, and specifically designed to have as few implementation dependencies as possible. It is intended to let application developers “write once, run anywhere” (WORA).
The Hadoop ecosystem:
- Hadoop: Hadoop is an open-source software framework written in Java for distributed storage and distributed processing of very large data sets on computer clusters built from commodity hardware.
- Pig: Pig is a high-level platform for creating MapReduce programs used with Hadoop.
- Hive: Hive is a data warehouse infrastructure built on top of Hadoop for providing data summarization, query, and analysis.
- Spark: Spark’s in-memory primitives provide performance up to 100 times faster for certain applications
Epilog: How this article came about
This article started out as a discussion of occasional productivity problems we were having on my team. We eventually traced the issues back to the technical platform and our software engineering knowledge. We needed to plug holes in our software engineering practices, but every available course was either too abstract or too detailed (meant for professional software developers). I’m a big fan of the outside-in approach to data science and decided to hold an open CrowdChat discussion on the matter.
We got great participation: 179 posts in 30 minutes; 600 views, and 28K+ reached. I took the discussion and summarized the findings based on the most influential answers, then I took the summary and used it as the basis for this article. I want to thank all those who participated in the process and take the time to acknowledge their contributions.