
 Container ship ZIM, New York, Miraflores Locks, Panama Canal. (source: Patrick Denker on Wikimedia Commons)
 This article is a step-by-step guide to using Elasticsearch in combination with the rest of the ELK stack (now called Elastic Stack) to ship, parse, store, and analyze logs. Throughout this guide, we’re going to use:
- Filebeat for collecting logs (note: the information presented here may also apply to metrics, SQL transactions, and other sources for which a Beat exists).
- Logstash for enriching logs and metrics, and processing them into structured events that will be indexed in Elasticsearch.
- Kibana for visualizing the structured data stored in Elasticsearch.
In our examples, we’ll use Apache access logs, but all of the knowledge you’ll gain from this article is applicable to working with other types of logs as well. Finally, we’ll look at the challenges of scaling out such a system, either on your own or by using a hosted ELK/Elastic Stack option.
Installing and configuring Elasticsearch, Kibana and Filebeat
Elasticsearch
Elasticsearch is a Java application, so you’ll need to install a recent version of either Oracle’s JDK or OpenJDK. In Ubuntu 16.04, you’ll get OpenJDK 8 with:
sudo apt-get install openjdk-8-jdk
If you’re on an RPM/DEB distribution, we’d recommend the official packages. Here, we’ll use the APT repository to get the 5.x version:
wget -qO - https://packages.elastic.co/GPG-KEY-elasticsearch | sudo apt-key add -
echo "deb https://artifacts.elastic.co/packages/5.x/apt stable main" | sudo tee -a /etc/apt/sources.list.d/elasticsearch-5.x.list
sudo apt-get update && sudo apt-get install elasticsearch
Before starting Elasticsearch (sudo service elasticsearch start), you’ll need to decide how much memory you’re willing to give it. This is specified by changing -Xms and -Xmx in /etc/elasticsearch/jvm.options. The rule of thumb is to start with half of the total available memory of the server as the value for both options; this will leave the other half available to the operating system for caching. Later on, you can monitor Elasticsearch’s heap usage, as well as the IO throughput needs, and adjust the balance.
Kibana
Kibana can be installed from the same repository you added for Elasticsearch:
sudo apt-get install kibana
sudo service kibana start
Filebeat
Once again, we’ll use the APT repository:
sudo apt-get install filebeat
Filebeat 5.0 will, by default, push a template to Elasticsearch that will configure indices matching the filebeat* pattern in a way that works for most use-cases. For example, most string fields are indexed as keywords, which works well for analysis (Kibana’s visualizations). The message field is indexed as text, meaning it can be used for full-text search (Kibana’s Discover tab).
For tailing the Apache log file, you’ll also need to point Filebeat to it via the paths variable under filebeat.prospectors (the first prospector is defined there with input_type: log). You’ll define the path, like:
        paths:
        - /var/log/apache.log
Then start Filebeat and your logs should start pouring in:
sudo service filebeat start
Visualizing logs in Kibana
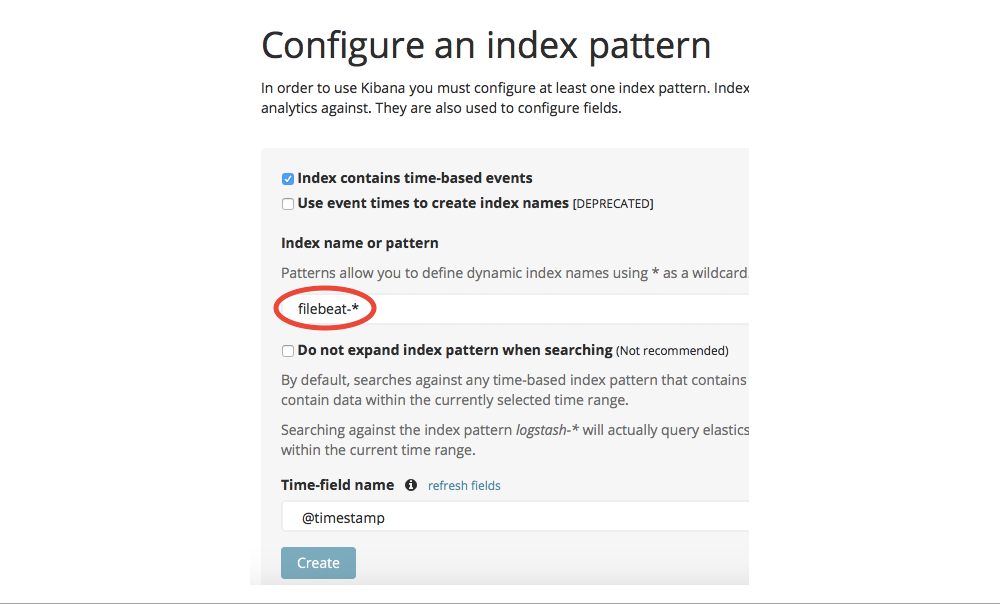
At this point, you can open Kibana in your browser (on port 5601 by default) to explore the logs from Elasticsearch. First, you need to tell it which indices to search on, by defining an index pattern. Set it to filebeat-*:
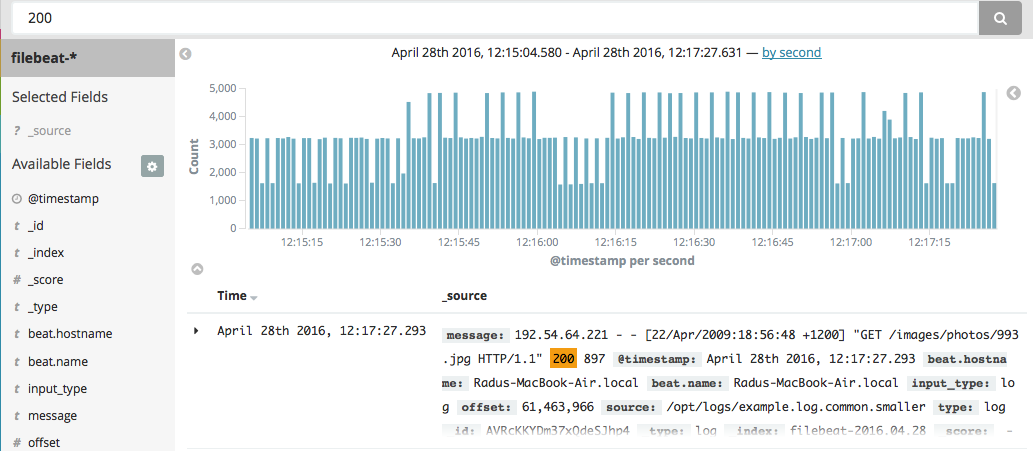
Then, you can go to the Discover pane and search your logs. For example, you can search the contents of logs like you would with grep, but it comes with the same disadvantages. For example, if you search for 200, you can’t tell whether it’s the 200 OK response or 200 bytes were transferred.
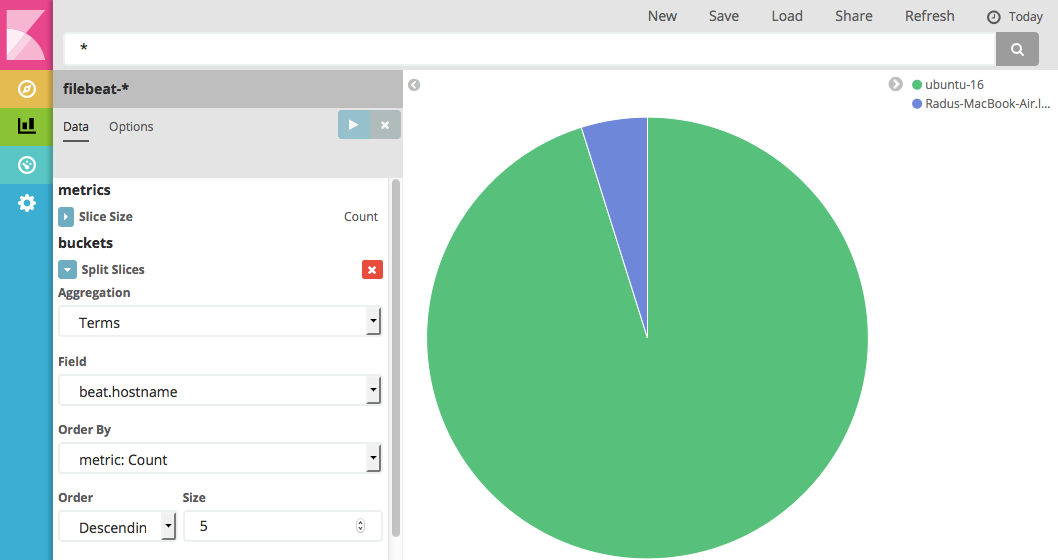
When it comes to visualizing, you can go to the Visualize tab and do a hostname breakdown, but again you can’t use information from the message field because different parts of it, such as the response code, aren’t yet parsed into their own fields:
Parsing data using Logstash
To fully exploit data from your logs, you need a tool that can parse them, and Logstash is such a tool. As of 5.0, you can use an Elasticsearch “ingest node” to do some of this processing, which can give you a significant performance boost. However, ingest pipelines don’t offer Logstash’s flexibility yet (for example, conditionals), so we’ll concentrate on Logstash in this post.
To build your Filebeat -> Logstash -> Elasticsearch -> Kibana pipeline, you need to install and configure Logstash, and then update the Filebeat configuration to point to Logstash, instead of Elasticsearch. Let’s take it step by step:
First, install Logstash from the same repository:
sudo apt-get install logstash
Then, create a file in /etc/logstash/conf.d/ (say, logstash.conf), where you’d specify a beats input for Filebeat to connect to. Next, you can parse your data with the grok filter before pushing it to Elasticsearch:
input {
  beats {
      port => 5044
  }
}

filter {
  grok {
      match => [ "message", "%{COMMONAPACHELOG}" ]
  }
}

output {
  elasticsearch {
      hosts => "localhost:9200"
  }
}
Moving on to Filebeat, you’d comment the whole output.elasticsearch section and configure hosts under output.logstash instead:
  ### Logstash as output
  logstash:
      # The Logstash hosts
      hosts: ["localhost:5044"]
To trigger Filebeat to re-send your logs via Logstash, you’ll need to do a few things:
- Stop it (
sudo service filebeat stop) - Remove the registry file, where Filebeat remembers where it left off tailing the Apache log. This will make Filebeat start over again:
sudo rm /var/lib/filebeat/registry - Delete the data already indexed in Elasticsearch:
curl -XDELETE localhost:9200/filebeat* - Start Logstash and Filebeat:
sudo service logstash start; sudo service filebeat start
Now your logs should be indexed again in Elasticsearch, only now they’re structured, and by default, going to the logstash-* indices. Logstash uses a template similar to Filebeat for its own indices, so you don’t have to worry about settings for now.
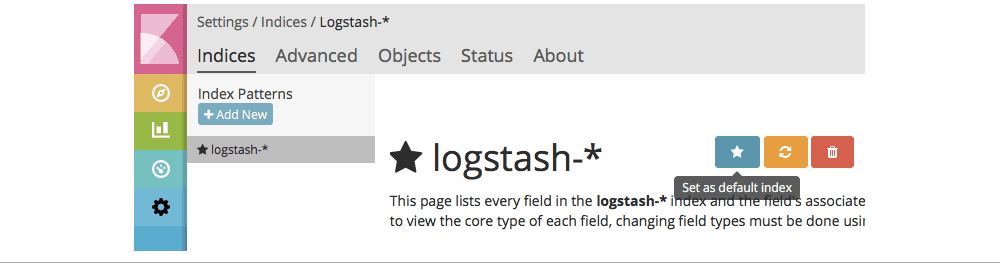
Going back to Kibana, you’d need to point it to the logstash-* indices by adding a new index pattern under the Settings tab. You’ll probably also want to set it to default:
Because the Apache logs are now structured, you can search in specific fields, like the response field:
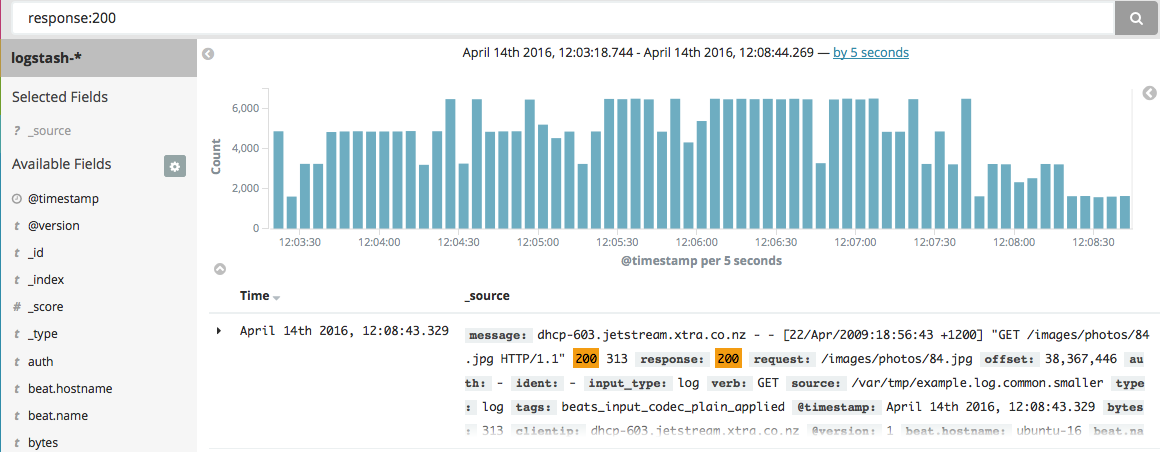
You can also build visualizations that allow you to see the breakdown of responses over time:

Moving from proof of concept to production
As you can see, getting started with the Elastic Stack is straightforward. Scaling the setup for production data will need more work, though.
On the shipper side, Logstash may turn out to be a bottleneck, unless you put it on many nodes, or on multiple nodes. You have alternatives: for example, you could use rsyslog, which is fast and lightweight. You can easily install it on every web server and do the parsing and shipping to Elasticsearch directly. However, different shippers have different feature sets—in this case, rsyslog allows sending different kinds of messages over separate channels via rulesets, but GeoIP isn’t supported out of the box yet.
On the Elasticsearch side, you’ll need to add more nodes to the cluster in order to get fault tolerance, and to handle more logs. To do that, you’d need to do a few changes to elasticsearch.yml.
Achieving fault tolerance
First, define discovery.zen.ping.unicast.hosts so that nodes know of each other and form a cluster. You’ll need at least three nodes in production, so that if one is unreachable, the others can still form a quorum. To define what the quorum size should be to, set discovery.zen.minimum_master_nodes to NUMBER_OF_NODES/2+1. Finally, you can make Elasticsearch listen to an outside interface (instead of the default localhost) via network.host, allowing you to separate Filebeat, Logstash, Elasticsearch, and Kibana, and your browser, to separate machines.
Going beyond a few nodes or tuning the existing cluster will require more understanding of how Elasticsearch works. The O’Reilly training video Working with Elasticsearch, is just under three hours and will give you all of the information you need to configure and manage Elasticsearch—both for logs and other use cases, such as social media analytics and content search.
Build vs buy
Rolling your own Elastic Stack gives you more control over the behavior of Elasticsearch, including when you upgrade, which plugins you install, and how you integrate it with other technologies you’re currently using (i.e., databases, data processing tools). The downside is all of the time, energy, and money you’ll need to put into maintenance, upgrades, tuning, and building various features you will want to have on top of the bare-bones ELK/Elastic Stack. If that doesn’t sound attractive, you have a few alternatives if you want to stick with ELK/Elastic Stack.
One alternative is to use a Cloud log management service. This can get you to production quicker and save you the time and money of configuring and maintaining Elasticsearch. Services typically include monitoring, and performing backups and upgrades.
If you want to roll your own Elastic Stack but want to reduce the time to get started, there are a number of options to consider, including this O’Reilly video course, Elasticsearch training, or ELK/Elastic Stack consulting.