Real-world data collection
Prioritizing and evaluating data sources for ROI.
 3 September 1967: Road traffic in Sweden switched from driving on the left side of the road to the right. (source: Jan Collsiöö on Wikimedia Commons)
Errors using inadequate data are much less than those using no data at all.
Charles Babbage

Learn faster. Dig deeper. See farther.
It’s difficult to imagine the power that you’re going to have when so many different sorts of data are available.
Tim Berners-Lee
In the previous chapter, I covered data quality and collecting data right. In this chapter, we switch focus to choosing the right data sources to consume and provision to the analysts. That is, collecting the right data. I’ll cover such topics as prioritizing which data sources to consume, how to collect the data, and how to assess the value that the data provides to the organization.
Collect All the Things
Imagine that you are rolling out a new checkout process on your website. You will want to know exactly how it is performing against your metrics—you will want to track conversion, basket size, and so on—but it will also be instructive and insightful to understand how it is being used. For instance, on some sites, “add to cart” is a painless single click, so a pattern of customer behavior might be to add a bunch of items to the cart as a holding area and then prune that down to their final choices before clicking the checkout submit button. On other sites, however, “add to cart” might involve multiple clicks, and removing items might be harder or ambiguous—in short, there is more friction—so that customers essentially need to make their final decision before adding items to the cart. You can see why instrumenting the checkout process as much as possible can lead to deeper insights about the feature and can drive ideas for feature additions or refinements and further tests.
In his book, Building Data Science Teams (O’Reilly), DJ Patil remarks:
It’s easy to pretend that you’re data driven. But if you get into the mindset to collect and measure everything you can, and think about what the data you’ve collected means, you’ll be ahead of most of the organizations that claim to be data driven.
Collect and measure everything that you can. You never know what you might need, you often only have one chance to collect the data, and you’ll kick yourself later when you need it and it is no longer accessible. The more data that you collect, the greater the chance that you have to model and understand the users’ behavior (as in the checkout example) and, importantly, their context—context is king. That is, the more that an organization understands about the individual users, their tastes, intentions, and desires, the more it can improve the user experience through personalization, recommendation, or more fine-grained services that reach down the “long tail.”1
When developing online products, collecting everything is a no-brainer. It is a data source that you control, and a click on one feature can use the same or similar collection mechanism as a click on another feature. That is, you can make use of common patterns, data flows, and storage mechanisms. A strongly data-driven organization, however, will likely be thinking much broader than this: data-driven marketing, data-driven sales, data-driven customer service, data-driven supply chain, data-driven HR. If each of those has a suite of internal and external data sources with different formats, latency, data quality issues, security and compliance requirements, etc., then this starts to become daunting for the data team. That’s when “collect everything” sounds great in practice but is a major headache when the rubber meets the road.
Moreover, it is not free. While more data is better2 (see not available for some examples and reasoning why), it can come at a hefty price. It costs money to build pipelines to suck down, cleanse, transform, and store those data. There is a cost to maintain those systems, to back up the data, and to integrate those data sources to provide a holistic view of the business. There can also be a significant downstream cost to provide quality tools for analysts to make good use of disparate data sources. You need all of that to get the right data into the hands of the analysts.
Even organizations that collect a huge amount—Facebook, Google, and yes, the NSA, too—didn’t make it happen overnight. You build the data sources, connections among them, and processing capabilities over time. You have to have a rational, well-thought-out data acquisition or provisioning strategy. Further, data teams in most organizations are resource-constrained; they can’t do everything at once, and so they have to prioritize which data sources to tackle very carefully. The reality is that when collecting data, things happen sequentially and slowly—there are always unforeseen delays and problems, and so you have to focus on value, return on investment, and the impact that a new data source will make upon the organization. That’s a primary focus of this chapter.
Prioritizing Data Sources
How does a typical, smaller, resource-constrained organization, where data engineers have competing calls on their time, choose which data source to consume next? In prioritizing those data sources for consumption and provisioning, a data-driven organization should focus on a fourth and more important V: value to the business.
The primary motivation of the data team should be to meet the business units’ and their analysts’ needs and help provide an impact to the organization. Each team or unit is likely to have a set of “core” data. For a customer service team, that might mean the various forms of interaction data, such as emails, phone calls, social media, perhaps instant message data, case data, and the sales order data. With that, they can perform their primary function—to deliver amazing customer service—but they can combine these sources to produce a holistic view of the set of interactions per case; they can view the high-level metrics about team productivity, such as average time to resolve a case; and they can analyze the type of interactions per source. Teams have to have their core data. However, in addition, they might have another set of data that would augment their core data. For instance, this might be defect rate data from manufacturing or A/B test data that might highlight where customers are getting confused by a new feature. Those might help the team predict the rate and topics of cases that are expected to come in. Those other data sources are likely valuable and impactful but not crucial.
The problem in a resource-constrained organization is that the customer service team is only one of many teams. Other teams have their set of core and nice-to-have data needs, too. Imagine a data engineer or data team project manager trying to balance all these requests from different teams. Table 1-1 sets out a number of dimensions that may help them determine priority. The key facet is return on investment (ROI), but ease, complexity, data quality, and other issues are a consideration.
| Priority | Reason | Explanation |
|---|---|---|
| High | Data is truly and urgently needed. | If there is a genuine need from the business unit and a hard deadline, you need to serve those internal customers ASAP. |
| High | Data will deliver high value. | If there is a high return on investment (ROI), for instance, they can help generate significantly higher revenue or reduce costs, this source should be a high priority. |
| High | Multiple teams need the same data. | There is a higher ROI if you can satisfy multiple business owners simultaneously. |
| High | Data is ephemeral or streaming. | Some streaming social media APIs or hardware devices only allow you to query a certain short time window after which the data is lost forever. It is a case of use it or lose it. |
| Medium | Augment existing data in value-driving way. | New data will augment existing data and provide a significantly richer context. (This is discussed in detail in the next section.) |
| Medium | Data engineers can reuse existing data processing code. | If the team has some familiarity with the data source or its API and can make use of existing code, there are likely to be fewer unknowns or surprises. |
| Medium | Easy to pull down. | Sometimes a request might jump the queue because there exists a nice Python client or API that makes it very easy to pull data down or the data has a clean and simple schema. If this is a data source you can knock out in an afternoon or a day or two, and it will provide some demonstrable value, it might be worth just getting it done quickly. |
| Medium | Good API that allows you to bring down historical data. | If you don’t urgently need the data right now, and you know that you can always go back and retrieve historical data, then there are probably other higher-priority data sources to go after. For instance, if you wanted to pull down raw Google Analytics data for archiving purposes, you can always get it when you really need it. |
| Low | Analysts have some data access and a workaround. | If the analyst has some access to the data source, even if not ideal, such as through a vendor dashboard, but there is a workaround (such as exporting data to CSV that meets their immediate needs), then this is low priority. There are likely other data sources that organization does not currently have access to that might deliver more immediate value. |
| Low | Low-quality data. | If there is little confidence in the quality of the data, then it may, at best, provide little value and, at worst, be counterproductive. |
| Low | Data has to be screen-scraped. | Screen-scraping is where one extracts data from web pages. Because website owners frequently change the underlying HTML and CSS of pages, and they are not always well structured, such data processes tend to be complex, very brittle, and require a lot of maintenance. |
| Low | Low likelihood of the data being used. | If it is only a “nice to have” and is without a clear use case, this is a low ROI choice. |
As you can see, there are a lot of competing considerations that determine what new data source it makes sense to bring into the organization next. There is a delicate balance of the cost and complexity to deliver that new data versus the value that data provides to the analysts and the organization as a whole.
Connecting the Dots
While there is clear value to consuming data across your organization—you obtain some data from digital marketing, some from sales, some from supply chain, etc.—for deeper analytics, there is even greater value when you start to link up “adjacent” data items. What do I mean by that?
Imagine that you are given a thousand-piece jigsaw puzzle, but there is no picture on the box. As you sort the pieces, you identify a group of blue pieces. Those are probably the sky. A group of individual green pieces look like grass. Here is an eye. Is that human or animal? You can get a vague sense of the overall image, but it lacks any detail. The detail comes when you start to click adjacent pieces together. You click that piece with the eye to the piece with an ear. Now you have greater clarity. Let’s translate this more explicitly to analytics.
Suppose that you use Google Analytics to analyze how people come to your website. This gives you a breakdown of referring pages and search terms, locations in the world, and so on, which gives you a sense or picture at the sample or population level (those are the pieces of the sky). You analyze the suite of customer survey responses over the last three months: 75% love the price, 20% were amazed by the customer service, and so on (those are like the pieces of grass). You get a sense of the state of the business, but only a 50,000-foot view because these are independent data points.
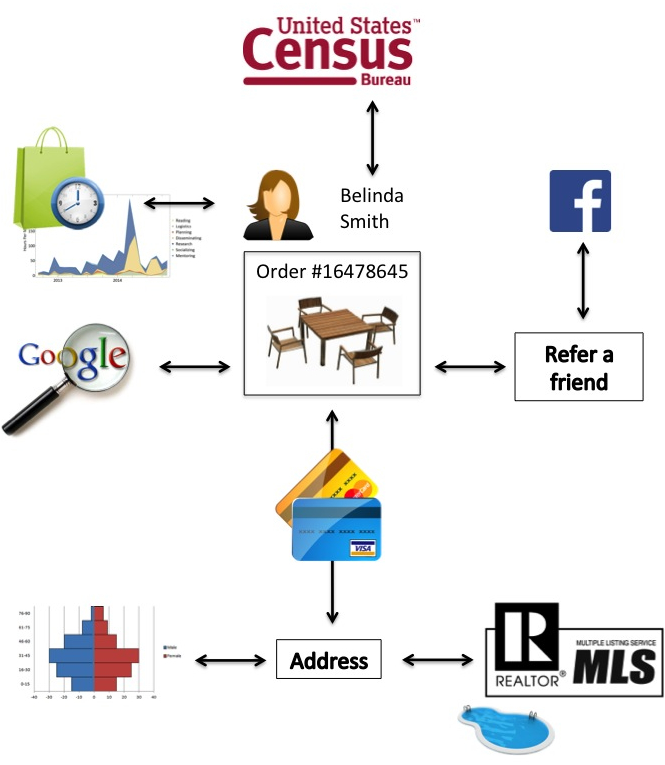
Now, in contrast, imagine a single sales order (Figure 1-1). Belinda Smith orders an outdoor patio set. If you can join the sales order to the transacting session from her clickstream, you can gain greater insight: she spent 30 minutes clicking around 15 different patio sets before she decided on one. Clearly, she did not arrive with a particular patio set in mind. How did she get to the page? If you join in referrer data, she did a Google search for “patio tables” and that led her to your site. That confirms your intuition about her browsing behavior. Now, if you add in her complete sales history, you realize that Belinda is a frequent shopper, often for home goods, and interestingly has a spike in the last month. Together, the information that she used a Google search and is a frequent shopper implies that she may not be brand loyal and that you need to work hard to reacquire her. Each time you add in another dataset at this individual-level, you get a much deeper, richer sense of this person. Let’s keep going. Let’s pull in US census data that maps gender probability given a first name: Belinda is almost certainly female. OK. When she paid, she added in a shipping address. Let’s pull in demographic data from that ZIP code. This is an affluent suburban neighborhood with large lot sizes. What else can we do with that address? Let’s look up that address on the multiple listing service (MLS), which is a central repository of house sales. Interestingly, the listing shows that the house has a pool. That could be useful for recommendations. What else? The house was sold just six weeks ago. Aha, she likely recently moved to that address. From other analysis we have done, we know that new homeowners tend to buy occasional rugs, beds, and lamps (yes, it is true, I did this analysis). Finally, she clicked on a refer-a-friend widget to get a coupon during checkout. Because she accepted Facebook’s terms of service in the process, this opens up her social network. (We’ll cover privacy and ethics in detail in not available.)
For a data analyst or data scientist, this deep profile and context offers a huge amount of raw material to work with. You can get a clear sense of her history, demographic, and even, in this case, current motivation. Do this for some of your other customers, and automate even just some of this analysis, and you have a powerful strategic advantage.
Connecting the dots at this individual level, in contrast to the segment level, has huge value and should drive the decisions about which datasets to bring into the organization next (without violating ethical or privacy concerns) and how to connect them at the individual level.
Data Collection
Now that we have considered the question of what data to collect, let us briefly consider the question of how it should be collected.
For many data sources, you simply take a systematic approach and suck down all the available data for that source (or subset of the fields). There are many ways to consume data feeds. You can use an API, or collect files from an FTP site, or you can even screen-scrape and collect what you can. If this is a one-time dump, you are done. If the data, however, is updated or added to frequently, and this is an ongoing data stream, you have to decide how to consume that data. For small files or tables, it can be easier simply to blow away existing tables and replace them with the current, larger dataset. In my team, we consider “small” to be tables with 100,000 rows or fewer. For larger data sources, you have to set up some more complex delta process. The simplest case is where new data is always entirely new rows (an example is transaction logs where updates or deletes to existing rows should not happen). In that case, you can just append (INSERT) the new data to the existing data table. In more complex cases, you have to work out several cases: a new data row is an INSERT, or it is a DELETE, or it is an UPDATE.
For other data sources, you may have to sample data. It may be very expensive to send out and process surveys, run clinical tests, or even dip into Twitter’s firehose. How you sample has very important implications to data quality. We will cover experimental design in not available, but a poor design can introduce severe bias and reduce data quality and utility dramatically. The simplest approach is a “simple random sample” where one essentially flips a coin to choose randomly those that are in the sample and those that are not. The goal is that the sample is truly representative from the larger population or sample from which it is drawn.
One thing to consider is sampling for longitudinal datasets. Imagine that you wish to sample website sessions per day. You sample 10% of sessions and load those into a database for further analysis. If you do this each day, you will have a set of independently and randomly chosen sessions, but you may miss out on data from visitors that visit the website on consecutive days. That is, your dataset may not contain any individuals with multisession data—they might be in sample on Monday but out of sample on their return on Wednesday. So, if you are more interested in following multiple sessions, and your site tends to have visitors that return frequently, you may fare better, and have higher-quality data to work with, by randomly sampling individuals and following their sessions over time, than by sample sessions. (You will, however, likely suffer attrition as individuals drop out and fail to return.) How you sample should be driven by the business question that you are trying to answer.
One final point: should you consume raw or aggregated data? Some vendors provide dashboards where data has been aggregated up to the key metrics that the analysts need. Those can provide significant value to the analysts. However, if the data is valuable, what I tend to see is that analysts want more; they want to drill down further and slice and dice the data in ways that the vendor dashboard does not support. While those reports and dashboards can be consumed as-is for archiving purposes, my take is that it is usually better to suck down the raw data where possible because you can always aggregate up to those metrics but not vice versa. With the raw data, you can, in principle, support slicing and dicing the data in all the ways that the analyst can imagine. There are cases where consuming raw data is not feasible, such as where the raw data is huge and costly to store, or the vendor provides a valuable service to compute those metrics (a process that you could not perform yourself), but raw is typically the better option.
Purchasing Data
While there is typically a wealth of information from an organization’s internal data systems alone, and it can be supplemented with publicly available data, sometimes you just need to shell out for additional data from third parties.
There are many reasons why you might purchase external datasets. Earlier, we used the example of Belinda Smith’s patio set purchase to make the case about the value of context. First, other partners, vendors, or even government agencies may simply have the data that can provide that context and add the “adjacent pieces” in your puzzle. Second, you may have internal data but a third party can provide higher-volume or higher-quality data.
Sometimes, you may have little choice as to where to purchase data. For instance, MLS has a practical monopoly on housing sales data. In other cases, however, there is direct competition. For instance, you can purchase customer profile data, based on credit card purchases, from a suite of providers, such as Datalogix, Axciom, Epsilon, or Experian. There is a market.
When there is a choice of sources—for instance, a dataset that maps ZIP code to metropolitan area—one has to weigh a number of dimensions, including:
- Price
-
Analysts and their bosses love free, but sometimes it is better to pay for higher-quality data. You have to consider whether it is a fair price and consider the value that it will provide to your organization. This is considered in detail in the next subsection.
- Quality
- Exclusivity
-
Is this a proprietary, exclusive dataset that will provide an advantage over your competitors if used well?
- Sample
-
Can you obtain a sample that will allow you to judge the content and quality and review the format sufficiently without having to make a firm commitment?
- Updates
-
How frequently does the data change, become stale, or irrelevant? How frequently is the data updated?
- Reliability
-
If calling a web service API, what’s its up time? What are the limits on API calls or other service-level agreements?
- Security
-
If the data is sensitive, is it encrypted and transmitted securely?
- Terms of use
-
Are there any licensing terms or restrictions that will limit the value that you can derive from the data?
- Format
-
We all have our favored formats, but generally human-readable formats, such as CSV, JSON, or XML (and which would exclude binary formats, excepting standard compression) are preferred because they are more easily parsed and provide more options to do so. At the end of the day, is this a format that you can easily support, or do you need to chalk up additional development costs and time to consume and support it?
- Documentation
-
Well-documented sources should be favored. Typically, you want to know how data is collected (to know whether it can be trusted and if it provides value) and have a data dictionary (that lists the fields, their data types, example values, and any important business logic incorporated into that field’s value; see Table 1-2). Randall Grossman, the chief data officer of Fulton Financial, has said that “A trusted data dictionary is the most important thing that a CDO can provide to business users.”
- Volume
-
Can you support the volume and storage needs? Valuable datasets need not be large, however. For instance, a ZIP code to DMA (designated market area, i.e., TV viewing region defined by the Nielsen Company) may only have 41,000 rows but can be immensely valuable to a marketing team evaluating TV ad spend.
- Granularity
| SAS variable name (eHARS) | Label | Description | Values | SAS format | HARS variable name |
|---|---|---|---|---|---|
aids_age_mos |
Age at AIDS diagnosis (months) | The calculated age at AIDS (HIV, stage 3) diagnosis, in months. | age_mos |
||
aids_age_yrs |
Age at AIDS diagnosis (years) | The calculated age at AIDS (HIV, stage 3) diagnosis, in years. | age_yrs |
||
aids_categ |
AIDS case definition category | The CDC case definition for AIDS (HIV, stage 3) met by the patient; calculated based on lab information and opportunistic diseases entered for a person.
For a description of the algorithm used to calculate |
7 – AIDS (HIV, stage 3) case defined by immunologic (CD4 count or percent) criteria A – AIDS (HIV, stage 3) case defined by clinical disease (OI) criteria 9 – Not an AIDS (HIV, stage 3) case |
$A_CAT | categ |
aids_cdc |
CDC case definition for AIDS | Has this person met the CDC AIDS (HIV, stage 3) case definition? To meet the CDC AIDS (HIV, stage 3) case definition, the case must be defined by immunologic criteria or clinical disease criteria ( aids_categ = A or 7). |
Y – Yes N – No |
$YN | N/A |
It is clear from a good data dictionary how the data is defined, what the formats and allowable values are, and, in this case, how the data is used by a software package. These are a few rows from eHARS (Enhanced HIV/AIDS Reporting System) in California. (SAS is statistical application suite popular in medicine.)
How Much Is a Dataset Worth?
It is relatively easy to work out how much your data costs you. You can examine the direct storage cost bill (such as from Amazon Web Services), the cost of backup services, the paycheck and overheads to the data team staff who manage and maintain the data, and of course the purchase price of the data (if any). However, a data-driven organization needs to identify the value to the business. What is the ROI? That is more tricky to ascertain.
d’Alessandro et al.4 provide a principled framework that can estimate direct ROI values, in dollars, at least in certain situations. They work in the world of advertising, developing predictive models to compute the best ads to show to each user. They get paid if a user clicks an ad. Thus, in this scenario, the outcome and return is clear: they get paid, say $1, if the user clicks, and $0 if the user does not. They also have their own data that drives their models. Some of that is derived from historical bidding activity, and some that was purchased in the past (which they regard as sunk cost). The question they ask is, “what is my ROI for models built on our own data versus models built with additional third-party data?” This requires determining three components:
- What is the value of an action? In this example, the action is a click, and it is worth $1.
- What is the expected value of a model with our own data?
- What is the expected value of a model with our own data plus additional third-party data?
Combining those:
Value of data = expected value(model with third-party data) – expected value(model without third-party data)
and
incremental return = value(click) × value of data.
Thus, suppose that a model with their own data only has a 1% chance of being clicked upon but a model with additional third-party data has a 5% chance of being clicked upon. The value of the data is a 4% lift, and the incremental value of that data is $1 × (5% – 1%) = $0.04.
Armed with a concrete value such as this, you can then objectively determine the value of purchasing that data. If it would cost $0.04 to purchase those incremental data points, then it is not worth it. If the cost is only $0.01, then it is a no-brainer.
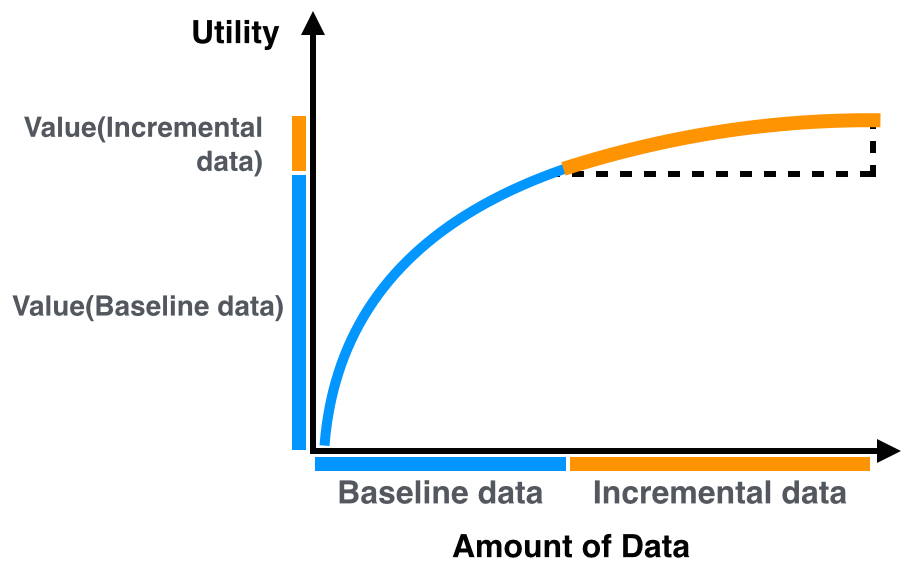
You are not restricted to evaluating the incremental value of third-party data in addition to your own data. As is so often the case in data, context is everything. Interestingly, d’Alessandro et al. ran an experiment where they compared incremental value of third-party data against randomly targeting users, that is, no data versus third-party data only. They showed positive incremental value across a range of segments with segment value / 1000 users as high as $1.80. They then ran an experiment with their own data plus third-party data. What would you expect to happen? The incremental value tanked! Segment value per 1,000 users was now around $0.02 or less. In the context of data they already possessed, the extra data provided positive but negligible value (Figure 1-2), most likely because of redundancies in the data.
This general approach works well because it is possible, at least from their data providers, to obtain a sample of data that they can test. If the economics works out, they can purchase a full dataset. That is, they are not committed to making the data purchase until they have run some experiments to estimate the value. That is not always the case with vendors. However, you may be in a situation where you pay a monthly fee for a data feed. If so, you can run experiments such as these to determine the value of the data and make a decision as to whether it provides a positive ROI or not. If not, cancel the service.
As the authors conclude:
As “big data” becomes the panacea for many business optimization decisions, it is increasingly important for managers to be able to evaluate their data-driven decisions and justify the investments made in acquiring and using data. Without the tools to make such evaluations, big data is more of a faith-based initiative than a scientific practice.
Amen!
Data Retention
In this chapter, we have focused on obtaining and integrating additional data, increasing the data that analysts have to work with. However, data can become stale or irrelevant. We touched on some of the costs in the previous section: storage costs, maintenance costs, and acquisition costs. There are also costs and risks that are less easy to estimate: if there is a data breach, what will be the damage and cost to your business? So, one thing to consider is when to delete data (reduce risk and cost) and when to move data to an appropriate storage medium.
Data has a habit of replicating. You may load a dataset into a relational database, but that isn’t the end of it. A given data point might flow down to one or more slave databases, just in case the master database server dies. Now you have two copies. Then you may do backups onto a server. Typically, you have several days or maybe a week’s worth of backups available in case things go wrong. Now we are up to nine copies of that data point. All those copies cost money. One thing that you can do is match the datasets to the relevant latency required in order to use or restore them.
An example is the following: Amazon S3 (Simple Storage Service) is a cheap and easy-to-use location with which to store data. For instance, it is almost certainly cheaper to store those backups on a service such as this than maintain an additional server to house those backups. When you need the data, you can pull them down instantly. Amazon, however, also provides a similar service called glacier. This is essentially the same as S3 but is meant as an archiving service; however, it can take four to five hours to restore the data. At current prices, this is about one third the cost of S3. If something went wrong, would you need that data instantly, or could you live for half a day or a day without it?
A data-driven organization should think carefully about the value of its data. Primary focus should be on its core data, where any downtime may have a real impact. It should consider deleting old, irrelevant data (this is easier said than done); but if nothing else, it should consider moving it to the cheapest suitable medium, such as offsite tape archives.
A more data-driven organization, for instance, one that has reached the “level” of predictive modeling, can create “rich” data models that capture the key features of the data and discard the rest. For instance, according to Michael Howard, CEO of C9, “Salesforce, for example, doesn’t keep a history of a deal for more than 90 days.” If that is the case, then it is imperative that you select details carefully.
As we have shown, a data-driven organization has to think very strategically about its data sources and the organization’s resources to garner and maintain them. Analysts have an important role here by researching possible sources and vendors, obtaining samples and, where possible, determining quality and putting the samples to work to ascertain their value.
In the next chapter, we consider who those analysts are, what their role is, and how they should be organized.
1Anderson, C. The Long Tail: Why the Future of Business Is Selling Less of More. New York: Hachette Books, 2005.
2Fortuny, E. J. de, D. Martens, and F. Provost, Predictive Modeling with Big Data: Is Bigger Really Better?” Big Data 1, no. 4 (2013): 215–226.
3First coined by Laney, D., “3D Data Management: Controlling Data Volume, Velocity, and Variety,” Application Delivery Strategies by META Group Inc., February 6, 2001.
4d’Alessandro, B., C. Perlich, and T. Raeder, “Bigger is Better, But At What Cost?” Big Data 2, no. 2 (2014): 87–96.