Creating Charts and Diagrams
PowerPoint 2007 has 11 types of charts for you to choose from to help you display your data visually. Charts are a great tool in PowerPoint 2007 because they help the audience focus on key points visually, instead of trying to wrap their brains around lots of numbers in a sea of text. Each type of chart has a set of chart subtypes you can choose from—a Quick Style gallery appears in each chart type to help you quickly determine the chart you want. Figure 18-5 shows the Insert Chart dialog box.
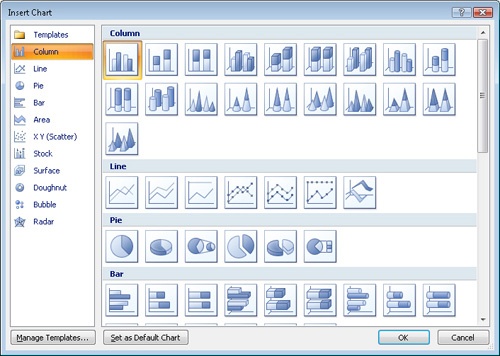
Figure 18-5. In the Insert Chart dialog box, you can see all the chart options available for a given chart type. It takes just ...
Get 2007 Microsoft® Office System Inside Out now with the O’Reilly learning platform.
O’Reilly members experience books, live events, courses curated by job role, and more from O’Reilly and nearly 200 top publishers.

