3 Histograms
An image histogram is an abstraction of an image where the frequency of each image (brightness/intensity) value is determined.
3.1 1D Histograms
In the case of a grey-scale image in which there are 256 grey scale intensities (0–255), 256 counts are computed indicating how many pixels each of the grey-scales in the image have. This can be visualised as in Figure 3.1.
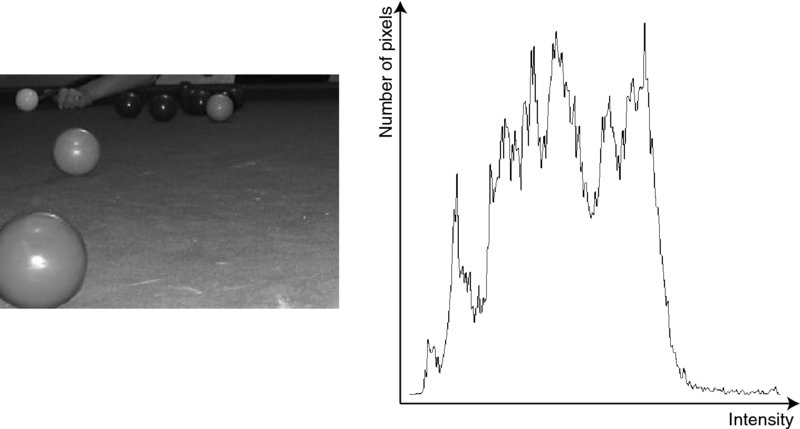
Figure 3.1 A grey-scale image and the histogram derived from it
The algorithm to derive such a histogram h(g) from a grey-scale image f(i,j) is:
Algorithm 3.1
// Initialise the histogram
for (g = 0; g <= 255; g++)
   h(g) = 0
// Compute the histogram
for (i = 0; i < MAXcolumn; i++)
 for (j = 0; j < MAXrow; j++)
  h(f(i,j))++
The histogram contains global information about the image and that information is completely independent of the position and orientation of objects in the scene. In some cases, the histogram or information derived from it (such as the average intensity and its standard deviation) can be used to perform classification (e.g. apples with bruises will result in dark spots, which will change the shape of the histogram when compared to histograms from good apples). However, care must be taken as image histograms are not unique and hence many very different images may have similar (or even the same) histogram.
Get A Practical Introduction to Computer Vision with OpenCV now with the O’Reilly learning platform.
O’Reilly members experience books, live events, courses curated by job role, and more from O’Reilly and nearly 200 top publishers.

