CHAPTER 5
Case Study 5—Time Series Analysis with Seasonal Adjustment
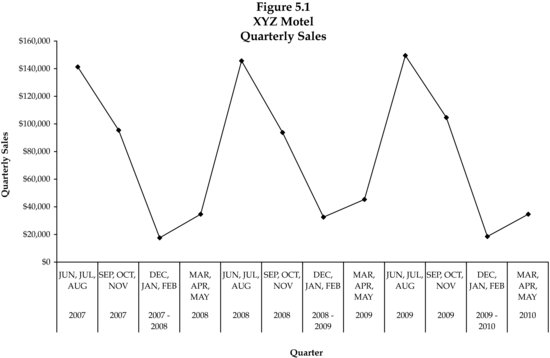
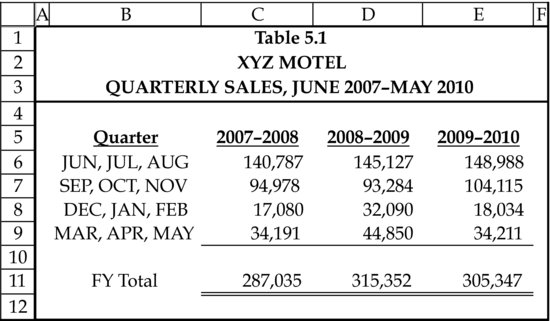
When the XYZ Motel was last seen in Case Study 4, it had been determined that lost sales during the period of interruption were $200,000 using a cross-sectional model in which we regressed monthly XYZ Motel sales against ESA sales. In Case Study 5 we try another approach to modeling lost sales, that of time series analysis with a seasonal adjustment. Again, the 12 quarters of motel sales are presented in Table 5.1 and on the accompanying line chart in Figure 5.1, as better results are expected using less variable quarterly data than more variable monthly data, as we explained in Case Study 4. We will not experience the extrapolation or out-of-sample problem that occurred in Case Study 4 with the quarterly data, as our x variables are time and a seasonal index, and no longer ESA quarterly sales.
Exploratory Data Analysis
Exploratory data analysis is expanded with Figures 5.2 and 5.3, which show, respectively, sales by quarter by year, and sales by year by quarter. The lack of uniformity on these charts can be explained by the facts that for the four months at issue (June, July, August, and September), room rates decreased by 2.2 percent from the summer of 2007 to the summer of 2008, while ...
Get A Quantitative Approach to Commercial Damages: Applying Statistics to the Measurement of Lost Profits, + Website now with the O’Reilly learning platform.
O’Reilly members experience books, live events, courses curated by job role, and more from O’Reilly and nearly 200 top publishers.

