Testing for Normality with PROC UNIVARIATE
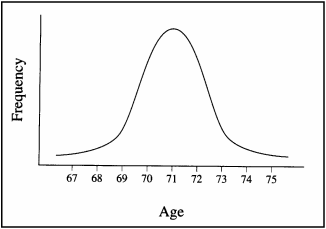
The normal distribution is a symmetrical, bell-shaped distribution of values. The shape of the normal distribution is shown in Figure 5.1.
Figure 5.1. The Normal Distribution

To understand the distribution in Figure 5.1, assume that you are interested in conducting research on people who live in retirement communities. Imagine for a moment that it is possible to assess the age of every person in this population. To summarize this distribution, you prepare a figure similar to Figure 5.1: the variable AGE is plotted on the horizontal axis, and the frequency of persons at each age is plotted on the vertical ...
Get A Step-by-Step Approach to Using SAS® for Univariate & Multivariate Statistics, Second Edition now with the O’Reilly learning platform.
O’Reilly members experience books, live events, courses curated by job role, and more from O’Reilly and nearly 200 top publishers.

