Chapter 6. Debugging and Profiling
One of the biggest differences between a junior developer and a senior developer is the ability to quickly and successfully locate and remove problems within an application. This is where experience truly shines; the more time people spend working with a particular technology, the more likely they are to have already seen an issue and solved it in the past.
As any veteran will tell you, putting tools such as a logger, debugger, and profiler to good use is not just a best practice — it is a must. This chapter introduces you to these tools and teaches you how to efficiently use them. I also share some tips and techniques specifically for optimizing memory and performance in your applications.
Debugging Basics
A few different tools can assist you in debugging a problem within your application. First and foremost is the Flex Builder debugger (see Figure 6.1). If your application is throwing an error, you can use the Integrated Development Environment (IDE) to set breakpoints and then step through the code to monitor property values and see where things go wrong.
Though helpful, use of the debugger alone usually results in slower turnaround times. That is why many developers choose to use a logger for monitoring the internal activities of an application.
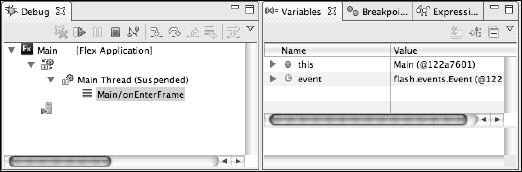
Figure 6.1. The debug controls are located in the top toolbar in the Flex Builder debugging perspective. ...
Get Adobe® AIR™ Bible now with the O’Reilly learning platform.
O’Reilly members experience books, live events, courses curated by job role, and more from O’Reilly and nearly 200 top publishers.

