Chapter 4. Using Devices and Emulators
Using the Emulator
In the previous chapter, we learned how to create emulators. Now we’ll discuss their use. An emulator is a very powerful tool that makes testing easier and allows the developer to simulate a variety of things that would be difficult to accomplish under real-world conditions. For instance, if you are writing a mapping application, you might need to test locations all over the world, and it would be impractical (although quite a bit of fun) to actually travel to each of these locations. The emulator provides the capability to simulate networking configurations, hardware/software configurations, and sensor events. It eliminates the need to have physical devices to represent each configuration that you need to test. For instance, you will use emulators to mock various screen sizes and memory configurations. This chapter describes how to use the emulator to effectively test various parameters.
For the most part, emulators and physical devices interact with the ADT tools in the exact same way. In other words, the operations we discuss in this chapter perform the same way on an emulator as they will on a physical device. In most cases, a physical device is more limited, because options (such as changing network configurations) are locked down by the service provider.
You will likely use many different combinations of physical devices and emulators to test thoroughly. You can run as many different emulators and devices as you like. If you plan on running a lot of emulator instances, you will need a powerful computer to support it (depending on configuration, each emulator can require 1 GB+ of dedicated memory). It is common for a developer to have many different emulator and physical devices running at the same time, then use each of them throughout the test cycle. It is worth noting that the emulator doesn’t support certain actions, such as simulating accelerometer activity, or simulating some sensor activity (such as the magnetometer). You should review the Capabilities and Limitations discussion to determine whether the emulator suits your needs.
Starting the Emulator
In the previous chapter, we discussed using the AVD Manager to create AVDs (Creating AVDs). This tool is also used to start the emulator instances as well. It provides options to control runtime parameters of the emulators you created.
To start it from within Eclipse, click the ![]() icon from the main toolbar.
icon from the main toolbar.
Or start it from the command line with the following command:
android avd
When you launch the AVD Manager, you will see a screen similar to Figure 4-1. This screen displays a list of all the AVDs you have configured on your system, and some options for managing them. To start an emulator, select a particular AVD and click the Start button.
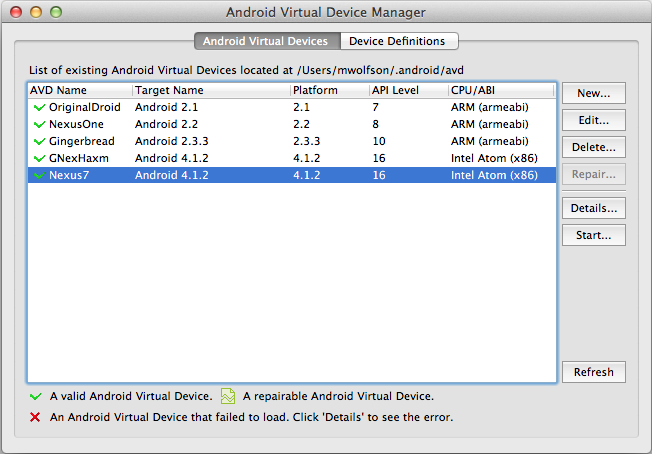
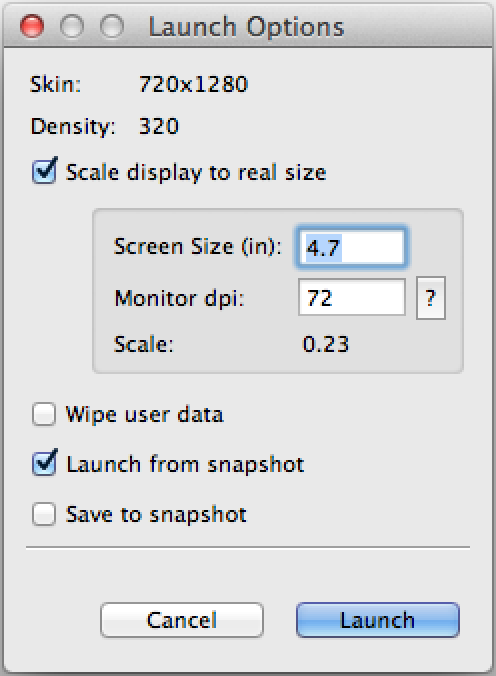
You are then presented with a secondary screen (Figure 4-2) that has a variety of options specific to running an emulator instance.
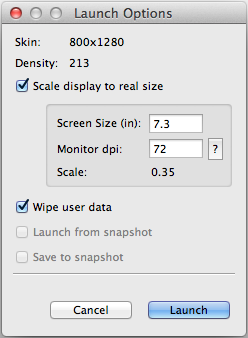
AVD launch options
It is important to understand the launch options, and what they do. Using them allows you to change the size, performance, and data of your emulator.
- Scale factor
This allows you to adjust the size of the emulator on your computer screen. To specify a particular screen size, place a checkmark in the Scale Factor box. Next, click the ? next to the dpi option to set the particular resolution of your computer. Enter the resolution and size of your display. Then type a number in the Screen Size box. Your emulator will be started with the screen size you entered.
- Snapshot
This lets you save an emulator’s state to a snapshot file and restore it later. This can be useful if you would like to preconfigure an emulator to start in a particular state every time, or would like to avoid the lengthy boot process when starting from scratch. This is a great way to speed up the time to boot an emulator, and will save a lot of time. Emulator boot times can be reduced from many minutes to just seconds.
Starting an emulator from the command line
It’s not absolutely necessary to use the AVD Manager to start an emulator. You can also start it from the command line. This is useful when using scripts, or if you would like to run an emulator without the overhead of Eclipse. There are a variety of configuration options you can use when starting an emulator this way. There are options relating to networking, graphics acceleration, sensor abilities, and more. To see a complete list of options, type:
emulator -help
The command to start an emulator has the following syntax:
emulator -avdavd_name[option[value]]...
For example, you could start an emulator with graphics acceleration turned on and boot animation disabled (two good options you can use to improve performance). This would look like:
emulator -avd Nexus7 -gpu on -no-boot-animUsing snapshots to improve performance
The snapshot is a view of your emulator including all data, the current UI being displayed, or any other sensor or data currently being used. This snapshot can be very useful if you wish to start your emulator with a certain configuration or state multiple times. In order to use snapshots with a particular AVD, it needs to be configured appropriately. Reread Creating AVDs to review how to do this.
You will notice three options in the snapshot section of the launch configuration tool.
- Wipe user data
Refreshes your emulator image to remove all data and resets it to a clean configuration (just as if it were started for the very first time).
- Launch from snapshot
Allows you to restore your emulator to the state it was in when the last snapshot was taken. If there is no snapshot in memory, this option is not enabled.
- Save to snapshot
Triggers the system to save a snapshot of the current state of the emulator when you close it.
Tip
I use snapshots as a way to save a clean emulator that I can recover quickly. I save a snapshot the first time I start the emulator, right after it has completed the boot sequence. From that point forward, I make sure I don’t check the “Save Snapshot” box. If I need a clean emulator image, I can just restart this emulator and thanks to snapshots, I will have a fully booted clean emulator ready to go.
Saving and retrieving a snapshot
Snapshots are such a great way of speeding up your emulator usage, it is worth going through an example to show exactly how they work. Let’s step through setting up an emulator using snapshots so you can actually see it for yourself.
The first step when using this functionality is to enable it for the AVD you are using. If you haven’t done this already, review Creating AVDs to do it.
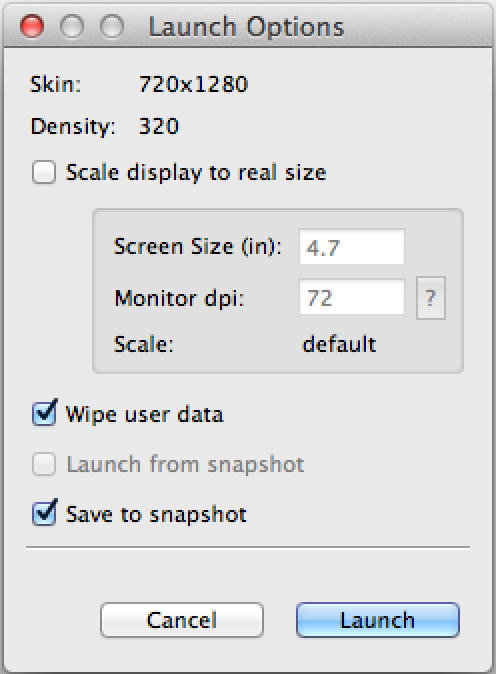
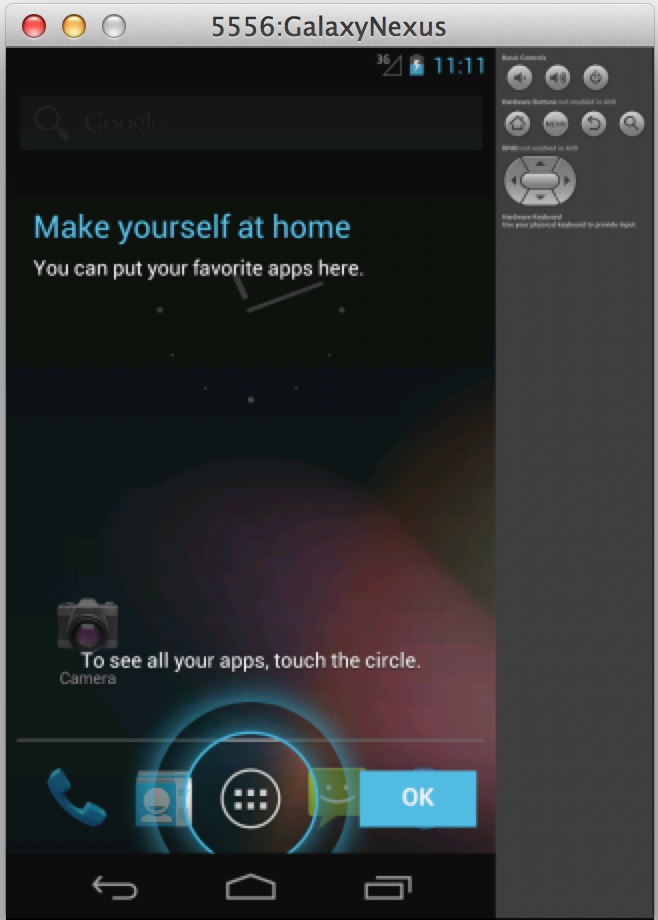
When you start your emulator, the options for snapshots will be enabled. The first time you start your emulator, you should select the “Wipe user data” and “Save to snapshot” options (as shown in Figure 4-3). This starts the emulator with a brand new image, and allows you to save your state when you close it down. Once you have these checkmarks selected, you can press the Launch button to start the emulator. Depending on the speed of your hardware, this can take a long time (anywhere from 90 seconds to many minutes). After the wait, you have an emulator booted to its clean state (Figure 4-4).
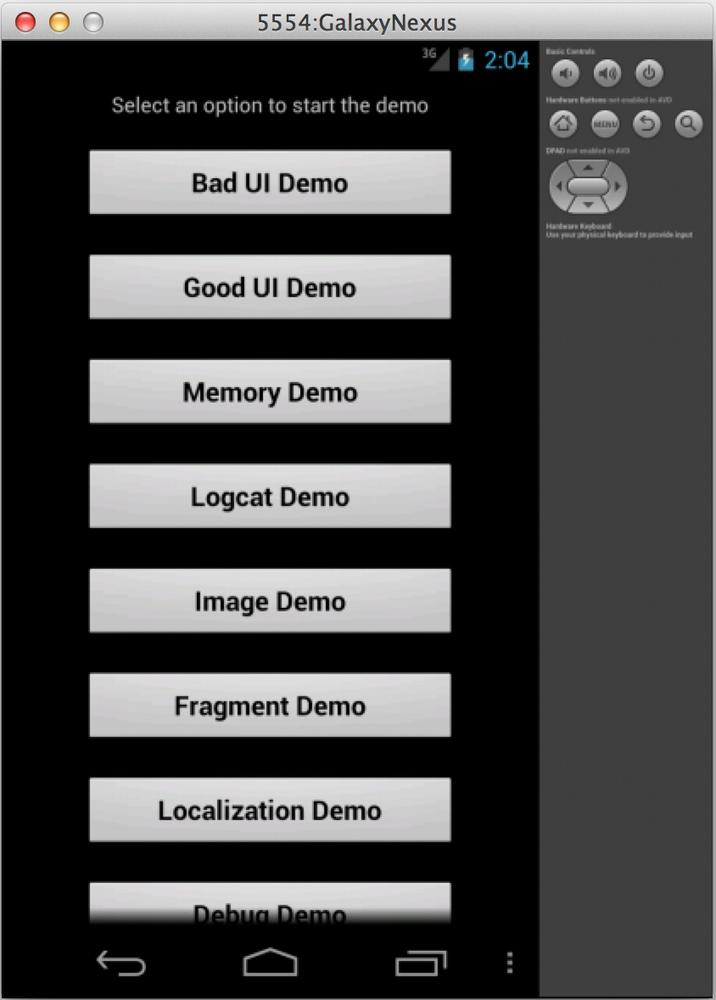
Now configure your device to a state you would like. In this example, the state we’ll save is the emulator started with the main Activity of an app displayed (see Figure 4-5). Now close the process; in this case, that means clicking the red circle on the top left to kill the window. This will take a little bit of time (maybe up to a minute) because a “snapshot” of the current state of the emulator is being saved, which will allow you to recover to this state easily.
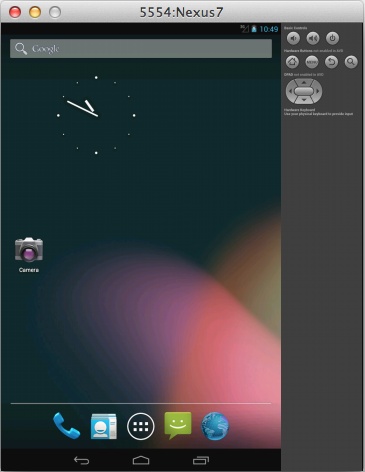
The next time you start your emulator, you can select the middle selection: “Launch from snapshot” (see Figure 4-6). When you select this option, and press the Launch button, instead of the emulator starting from scratch (which takes many minutes), it starts up to the state we saved when we shut down the emulator in the previous step. Because the emulator doesn’t need to go through the entire boot process, startup time is drastically improved (the emulator will start to a snapshot state in around 10 seconds). You will see your emulator booted right to the same place (as shown in Figure 4-7).
The Emulator Application
The emulator you start will look similar to the one in Figure 4-8. The emulator consists of a screen and optionally a keyboard or navigation buttons, if they were enabled when you created your AVD (Creating AVDs). The emulator runs like a native application in your operating system, and can be closed or minimized just like any other window (by clicking an X or red button at the top of the window).
The Devices Tool
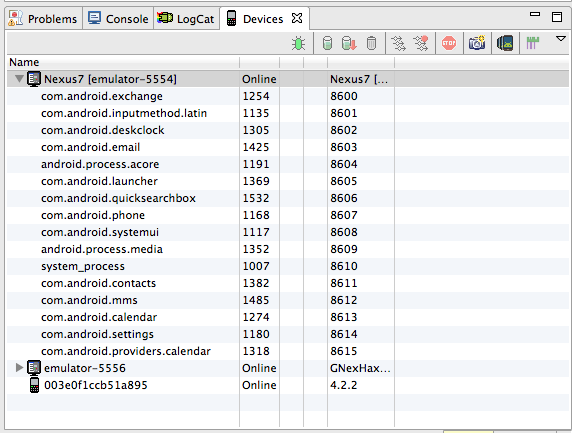
So how do you keep track of the emulators or devices you have hooked to your computer? You can use the Devices tool (shown in Figure 4-9), which allows you to see and control the various devices or emulators connected to your computer. This will be the central location where you control your devices. You will start a variety of important operations from this window (including memory inspection, location and network simulation, and UI inspection). I cover these operations in the DDMS section (Dalvik Debug Monitor Server (DDMS)).
I’ll also highlight frequently used, essential functionality you that you will access directly from this tab.
The primary way to access the Devices tool is from a tab at the bottom of your screen (see Figure 4-9). The devices tab should be there by default. If it is not there, you can add it from the menu: → → → → .
Tip
There is also a version of the tool that can be run from the command line without Eclipse. This is particularly useful for team members that might not have the full development suite installed, but could still benefit from using these tools. The tool is named Android Debug Monitor, and can be started with the following command:
{$android.sdk}\tools $ monitorThe upper left corner contains the Devices view. This will show you all the devices (both physical devices and emulators) that are currently connected and available. You can use the arrow on the left to collapse or expand a particular device tree in order to see details about the current running processes. In Figure 4-9, you’ll see different devices connected. The first two are emulators (the icon and their name both signify this), and the last one in the list (with the funny name that is a mix of letters and numbers) is a physical device.
There are a variety of useful operations that can be launched from this tab, including:
- Debugging
The first button on the top (
 ) allows you to enter debugging mode. In
this mode, you can attach the debugger to an application that is
already running. This means that you can start an application, run
it until it gets to the place you would like to test, and then
start debugging from that point. This can be an efficient way to
directly debug exactly the code you want and avoid other code
paths.
) allows you to enter debugging mode. In
this mode, you can attach the debugger to an application that is
already running. This means that you can start an application, run
it until it gets to the place you would like to test, and then
start debugging from that point. This can be an efficient way to
directly debug exactly the code you want and avoid other code
paths.- Heap
The second set of buttons allows you to start inspection of the memory (heap) of a running application. See Chapter 10 for more information.
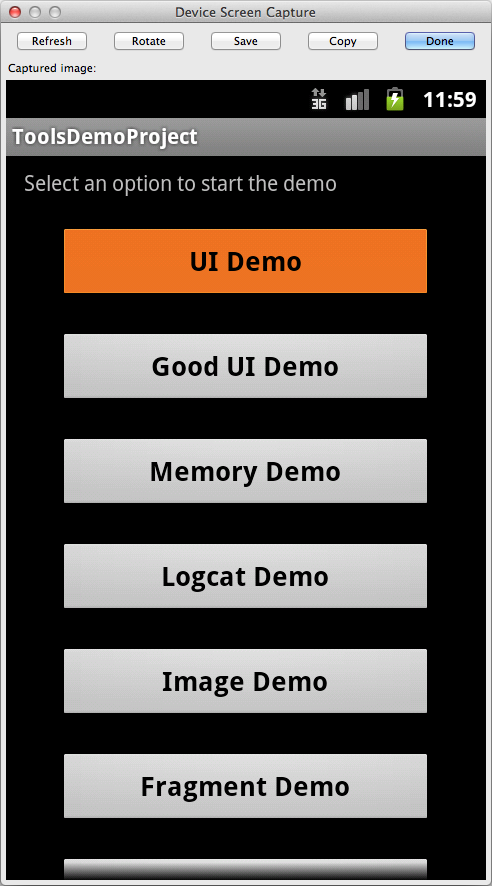
- Device screen capture
The next button (
 ) launches a utility that allows you to take
a screenshot of what is currently displayed on your device.
Pressing this will launch the dialog in Figure 4-10. The dialog shows an image of
whatever is currently displayed on the screen of your device,
along with buttons across the top that will enable you to save,
rotate, or refresh the image.
) launches a utility that allows you to take
a screenshot of what is currently displayed on your device.
Pressing this will launch the dialog in Figure 4-10. The dialog shows an image of
whatever is currently displayed on the screen of your device,
along with buttons across the top that will enable you to save,
rotate, or refresh the image.- Reset ADB
The upside-down triangle (
 ) is a particularly important button.
Pressing this allows you to access the controls to reset the ADB
process. This resets connectivity between the computer and the
devices. You can use it if you encounter connectivity issues
between your computer and device.
) is a particularly important button.
Pressing this allows you to access the controls to reset the ADB
process. This resets connectivity between the computer and the
devices. You can use it if you encounter connectivity issues
between your computer and device.
Keyboard Shortcuts
If you enabled keyboard support when you created your AVD (see Emulator Options), a variety of keys will be mapped between your computer keyboard and the emulator. I have listed some of the more useful mappings in Table 4-1. A description of each option can be found in the emulator documentation on the Android developer website.
File Explorer
ADT provides a GUI tool that makes exploring and interacting with
the files on the device very easy. It allows you to navigate the file
system to discover which files are on the device, move files onto and off
the device, and modify the file system by adding and rearranging folder
locations. To use this tool, open the DDMS perspective, select a device,
and select the File Explorer (![]() ) tab. This allows you to do a variety of things,
including:
) tab. This allows you to do a variety of things,
including:
Developer Tools Application
One more important tool that we need to explore is the “Developer Tools” application. It is installed by default on all system images included with the SDK, and is preinstalled on your emulator.
This application allows you to enable various settings on your device that will make it easier to test and debug.
The application incudes some of the basic items you might expect (such as “Stay Awake When Connected” or “Allow Mock Location”).
In addition to the standard debugging options, there are many other tools designed to help debug applications by enabling visuals when certain events occur (such as touch events, or the UI thread being locked). These tools are very useful when you are testing on a real device, as you can quickly visualize many system operations.
You can find the icon (labeled “Developer Tools”) to launch the application in the main app drawer. It allows you to do a large variety of activities relating to testing, instrumenting, and inspecting the state of various systems on your device. A brief list of some of the core functions follows:
Tip
If you are running a device with Android 4.2 and up, the developer options are hidden by default. You will need to know the “secret” way to enable them.
To enable them, open the Settings app, scroll to the bottom, then click “About phone” (or “About tablet”) and then tap on the Build number at the bottom of the screen seven times. After doing this, you will see a message that says “Congratulations, you are now a developer,” and the “Developer options” will be available.
- Accounts Tester
Allows you to access and configure a variety of user accounts on the emulator. Very useful if you need to test logins or similar authorization functionality.
- Bad Behavior
Allows you to simulate a variety of issues, like creating ANR (Activity Not Responding) events, or crashing key systems (like the main app thread or the system server).
- Configuration
Displays the current configuration values for the keyboard and display parameters. You can also see things like system locale, keyboard type, and display metrics (such as density). This can be extremely useful when trying to determine how your app looks on different resolution devices.
- Connectivity
Allows you to modify the networking parameters or modify the WiFi connectivity of the device. This is useful when you need to test connectivity issues or how your app will perform without connectivity.
- Development Settings
Does a variety of things such as enable debugging, show system statistics (such as running processes, CPU, and memory usage) or display UI hints (like showing the coordinates of touch points or flashing the screen during updates).
- Instrumentation
Runs unit tests directly on the device.
- Media Scanner
Scans the media folder of your SD card and identifies any media available for use.
- Package Browser
This tool should look familiar, as it is the same tool you use to manage apps from the Android Settings app installed on your device. It serves the same purpose (managing applications) here as well.
- Pointer Location
Displays visible lines and coordinates that allow the developer to closely determine specific touch points.
- Running Processes
Presents a list of processes currently running.
- Sync Tester
Tests third-party sync adapters.
- Terminal Emulation
Opens a terminal, allowing command-line access to the Linux shell.
Tip
This application relies on many system-level permissions that aren’t available to third parties. If you would like to run this on an actual physical device, it is necessary to build a custom system image and sign the Dev Tools APK with the same key as the system image. After signing the app correctly, you will be able to install it and run it on a device. This means that you can only run it on a rooted device, or on a device for which you built the system image. The system image signing key is generally only available to the hardware manufacturer.
Get Android Developer Tools Essentials now with the O’Reilly learning platform.
O’Reilly members experience books, live events, courses curated by job role, and more from O’Reilly and nearly 200 top publishers.

