Simulation of the Distribution of Time to the Next Boundary Crossing in Gaussian and Rayleigh Random Processes
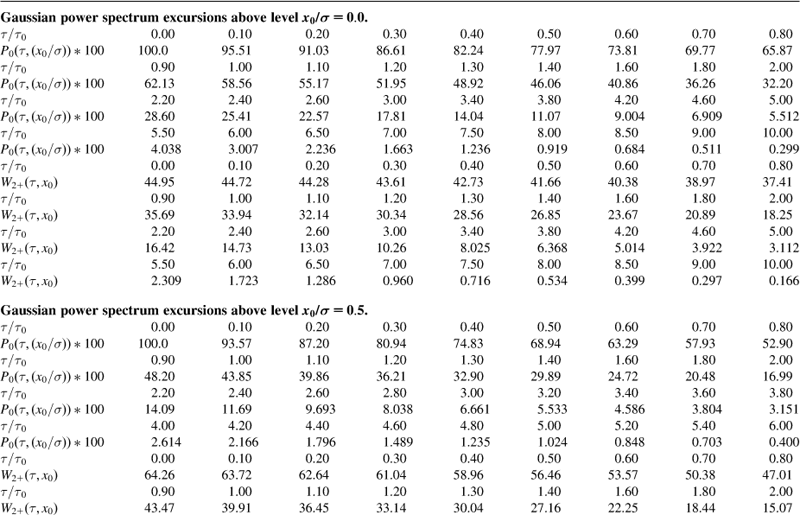
Table А2.1 shows values obtained from the simulation of the cumulative function and distribution density for the time to the next downward crossing of the set boundary in a Gaussian random process with a Gaussian power spectrum. It was assumed that at the arbitrarily chosen starting moment the signal was above the set threshold level; in other words, we are dealing excursions above level. The standardized threshold level was gradually increased from 0.5 to 3.0 in 0.5 incremental steps.
Table A2.1
Gaussian Random Process
Get Applications of Random Process Excursion Analysis now with the O’Reilly learning platform.
O’Reilly members experience books, live events, courses curated by job role, and more from O’Reilly and nearly 200 top publishers.

