10Time-Series Data and the Fourier Transform
Introduction
At the very beginning of this book, we pointed out that some problems are not deterministic. Many real processes include nonlinear, stochastic components that defy conventional modeling efforts. And yet, it is essential that scientists and engineers be able to interpret and analyze such phenomena so that some level of confidence with respect to outcomes can be achieved. The purpose of this chapter is to provide a few tools that can be used in such scenarios.
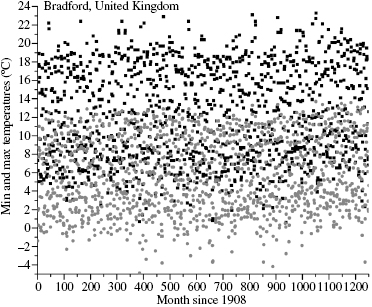
In the applied sciences, it is common to record experimental observations as a function of time, and we refer to such a sequence of data as a time series. We might collect these data to support a model or a hypothesis, or we might obtain them with the hope that a suitable model could be identified later. It is possible that such data might reveal particular functional behavior that could be periodic. Alternatively, the data might contain multiple periodicities or, in the worst case, exhibit fluctuations without a discernible period; that is, the phenomenon under study might be chaotic. Let us examine some meteorological data from the Bradford Station (United Kingdom) in Figure 10.1.
Get Applied Mathematics for Science and Engineering now with the O’Reilly learning platform.
O’Reilly members experience books, live events, courses curated by job role, and more from O’Reilly and nearly 200 top publishers.

