Chapter 13
Drawing Process and Strategy Maps
As I grow older, I pay less attention to what people say. I just watch what they do.
—Andrew Carnegie
Industrialist
1835–1919
Strategy Maps, value stream maps, and process maps of all types provide visual clarity. They make complex processes understandable and memorable. They also make it significantly easier to identify the points in a strategy or process where you can get leverage to create the greatest impact. As soon as you have identified these points of impact, you can identify the metrics to measure.
This chapter shows you how to draw Strategy Maps and simple business process maps using the tools built into Microsoft Office. Additional drawing and mapping tools are described in Chapter 27.
Which Drawing Tool Should You Use?
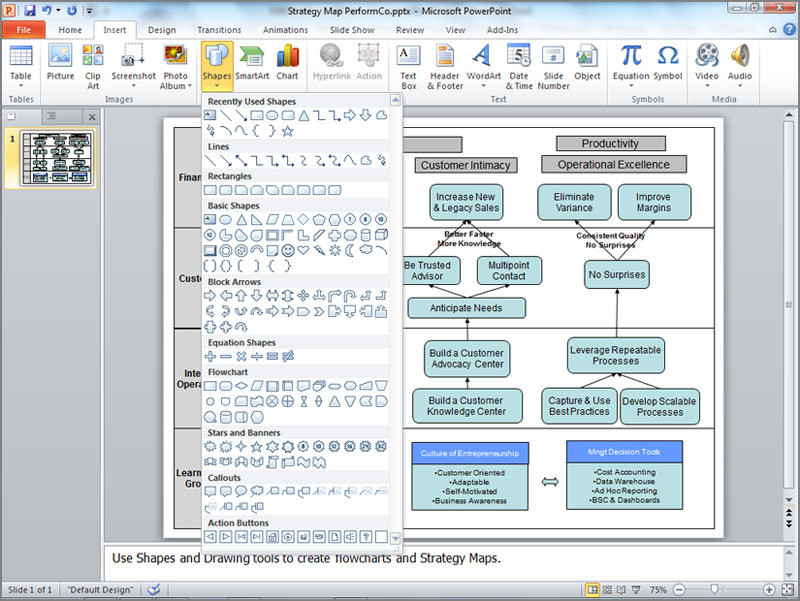
Strategy Maps and process maps range from simple maps you create once, which only need to be “good enough,” to maps that dynamically link to databases that update continuously and are critical to operations. Figure 13-1 shows a Strategy Map drawn in Microsoft PowerPoint 2010. A range of software exists that can satisfy your needs across the spectrum.
Figure 13-1: Microsoft Office has drawing tools that can create Strategy Maps and simple business process maps.
This chapter describes different software solutions with different levels of user knowledge and different levels of output. Of course, these have different ...
Get Balanced Scorecards and Operational Dashboards with Microsoft Excel, 2nd Edition now with the O’Reilly learning platform.
O’Reilly members experience books, live events, courses curated by job role, and more from O’Reilly and nearly 200 top publishers.

