256 Color Inserts
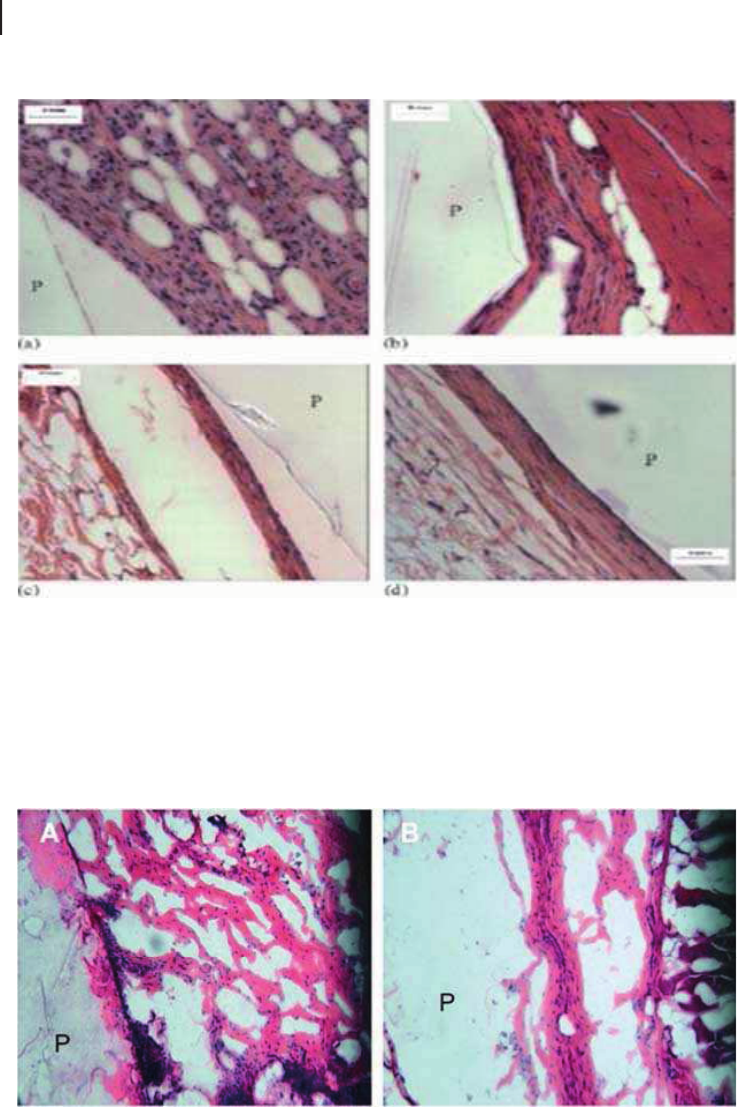
Figure 3.2 Foreign body response of POC (120
◦
C, 2 Pa, 3 d ) implanted subcutaneously in
female Sprague–Dawley rats (scale bar = 50 μm). Implants and surrounding tissues were
harvested after (a) 1 week; (b) 1 month; (c) 2 months; (d) 4 months implantation for H&E
staining. “P” represents polymer section. Reprinted from Biomaterials, 27, Jian Yang et al.,
Synthesis and evaluation of poly(diol citrate) biodegradable elastomers, 1889–1898, 2006,
with permission from Elsevier.
Figure 3.3 Foreign body response of PAMC (POMC 0.8, 20 mins. UV crosslinking)
implanted subcutaneously in female Sprague–Dawley rats. Implants and surrounding
tissues were harvested after (a) 1 week and (b) 4 weeks. “P” represents polymer section.
SO13997_text.indd 264SO13997_text.indd 264 26/01/2011 3:51 PM26/01/2011 3:51 PM
Color Inserts 257
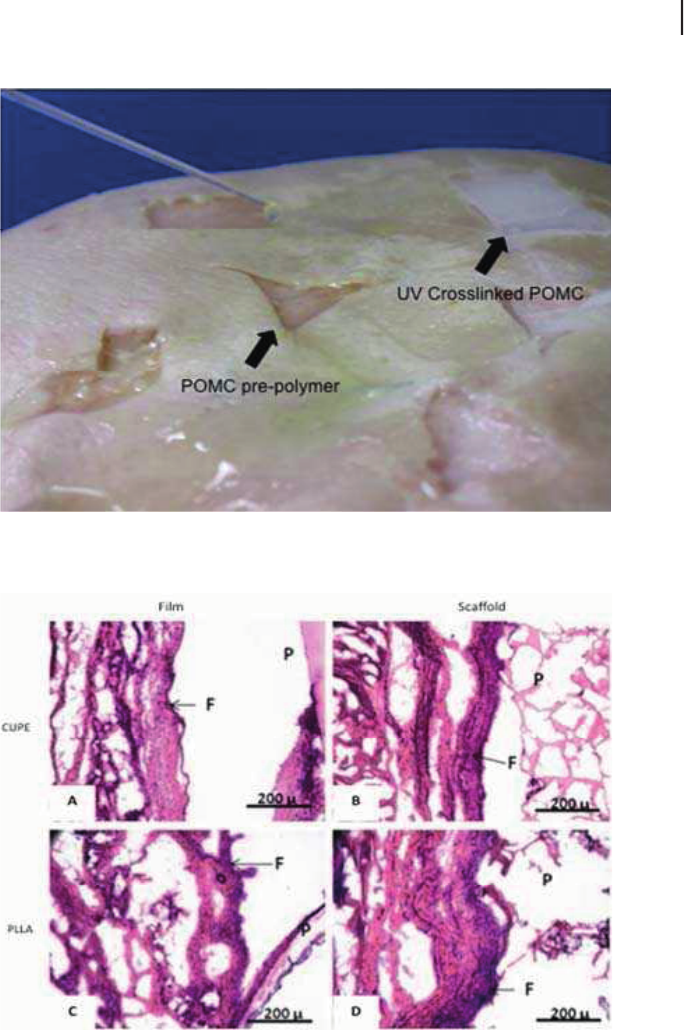
Figure 3.4 Pre-PAMC and ultraviolet crosslinked PAMC on porcine skin.
Figure 3.5 Histology of in vivo response to CUPE film (A) and scaffold discs (B). PLLA
films (C) and scaffolds (D) served as control. P and F are used to indicate the regions of
polymer and fibrous capsule respectively. All images were taken at 10x magnification. On
the 1 week samples, although all samples were covered by a well defined fibrous capsule,
CUPE implants were consistently surrounded by a thinner fibrous capsule as opposed to
PLLA implants. In the case of the 4 week implants, overall, all the implants appear to
trigger similar extent of tissue responses.
SO13997_text.indd 265SO13997_text.indd 265 26/01/2011 3:51 PM26/01/2011 3:51 PM
258 Color Inserts
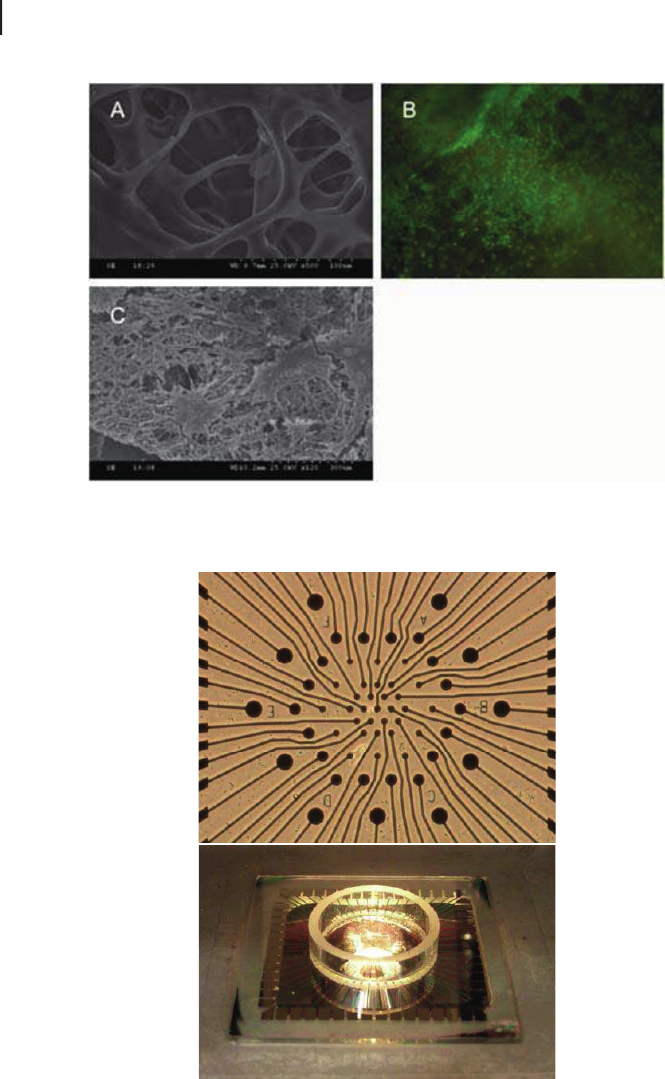
Figure 3.6 SEM images of scaffold surface indicate the presence of well defined pores (A)
and even cell distribution of cells on the scaffold (B and C).
Figure 4.1 One example of a commercially available microelectrode array (Multichannel
Systems Hexagonal Array). Neurons or neural tissues are plated on the array surface, top.
The circular electrodes can be stimulated and recorded from, but the electrical traces are
insulated from neurons plated above. The electrodes are found in the center of the well,
which contains culture media to provide cells with nutrients, bottom.
SO13997_text.indd 266SO13997_text.indd 266 26/01/2011 3:51 PM26/01/2011 3:51 PM
Color Inserts 259
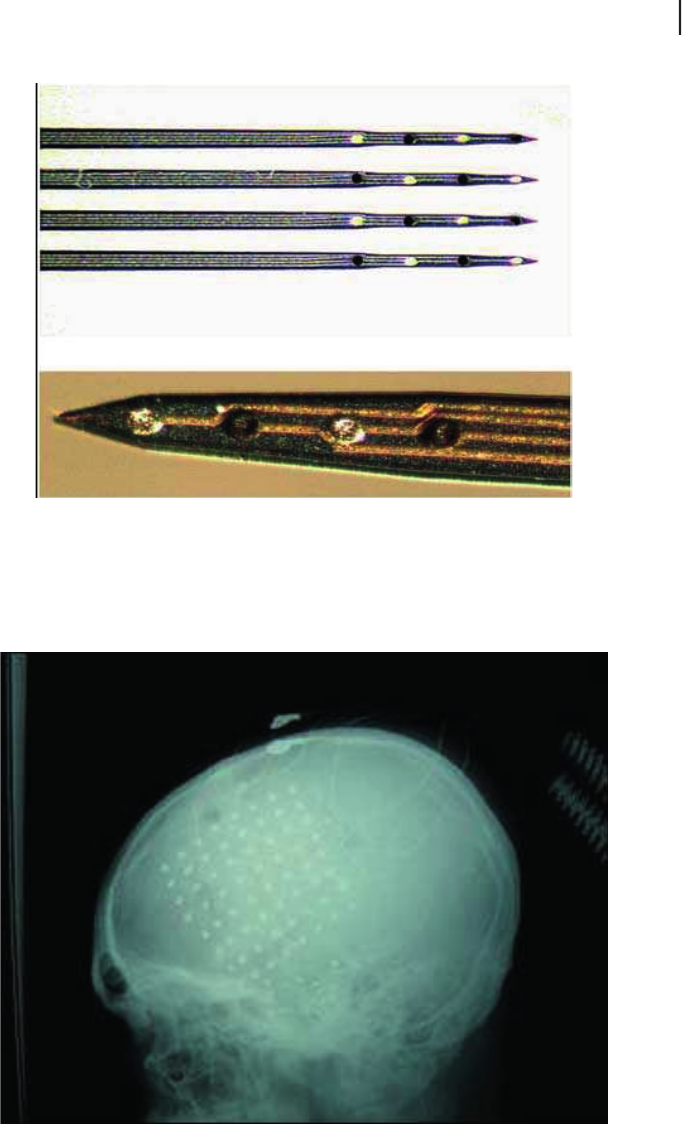
Figure 4.4 The four shanks of a Michigan probe, top; closer image of the four electrodes
per shank, bottom. The darker electrode sites in the lower picture have been treated
with the conductive polymer poly(3,4-ethylenedioxythiophene) (PEDOT).
32
Reprinted with
permission from the Journal of Neural Engineering,Ludwiget al., 2006, Vol 3, Issue 1,
pp. 59–70.
Figure 4.7 An ECoG electrode array located on top of the cortex but inside the s kull.
91
Reprinted with permission from the Journal of Neural Engineering, Leuthanrdt et al., 2004,
Vol 1, Issue 2, pp 63–71.
SO13997_text.indd 267SO13997_text.indd 267 26/01/2011 3:51 PM26/01/2011 3:51 PM

260 Color Inserts
Figure 4.8 The response of rat cortical tissue 8 weeks after insertion. The green stain marks
glial fibrillary acidic protein (GFAP), a marker for astrocytes, and the red NeuN stain marks
neuron nuclei. The scale bar is 100 micrometers. Notice the astrocytes apparent at the
electrode interface, and that the neurons appear further away. Image courtesy of George
McConnell, Bellamkonda Lab, Georgia Institute of Technology.
Figure 5.1 A cell in a three-dimensional culture forming links with the scaffold.
2
SO13997_text.indd 268SO13997_text.indd 268 26/01/2011 3:51 PM26/01/2011 3:51 PM
Get Biomaterials for MEMS now with the O’Reilly learning platform.
O’Reilly members experience books, live events, courses curated by job role, and more from O’Reilly and nearly 200 top publishers.

