Characterization of Biomaterials 237
when the frequency of the IR light is varied (by monochromator), the IR light
after passing the sample is guided through an interferometer. The measured
signal is the interferogram. Performing a mathematical Fourier transform on
this signal results in a spectrum identical to that from conventional (dispersive)
infrared spectroscopy. FTIR spectrometers are cheaper than conventional spec-
trometers because building of interferometers is easier than the fabrication of a
monochromator in the IR wavelength range. In addition, measurement of a single
spectrum is faster for the FTIR technique because the information at all frequencies
is collected simultaneously. Because of its various advantages, virtually all modern
IR spectrometers are FTIR instruments.
A special technique called attenuated total reflection Fourier transform in-
frared spectroscopy (ATR-FTIR) is usually employed to characterize biomaterial
surfaces without using any distructive sample preparation procedures. ATR-FTIR
couples IR spectroscopy analysis with the physical phenomena of total internal
reflection to restrict the analyzed volume to within a few micronmeter depth of
the sample surface. For this technique, the incident electromagnetic waves (IR
light) are entirely reflected back into the initial medium. The electromagnetic
field is established in the second medium as an evanescent wave.
47
In attenuated
total reflectance (ATR) sampling mode the second medium is the material to be
studied and has higher refractive index than the initial medium. Information about
the molecular structure of the biomaterial, inter- and intra-molecular interactions,
crystallinity, conformation (e.g. proteins) and orientation of molecules can be
obtained through analysis of the detected infrared spectra.
19,48
It has also been
used to study the relationship of surface characteristics to cellular attachement.
49
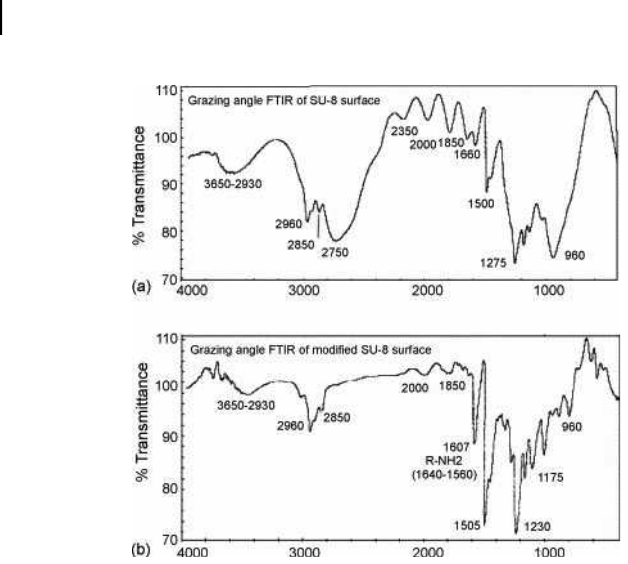
Figure 10.8 shows an example of IR spectroscopy applications in characterizing
SU-8 surface modifications, aimed to functionize SU-8 for immobilization of
biomolecules on a Bio-MEMS structure.
50
10.3.3 Microspectroscopy and Spectral Imaging Methods
There is a clear need to understand not only what chemical and biological species
are present in a biomaterial but also how those species are spatially distributed. In
principle, if we perform any spectroscopy analysis discussed in Section 10.3.2 in
a point by point fashion over an area of the sample surface we will get a spectral
image, in which a spectrum curve is available for each pixel. This huge amount
of data set is often referred as a spectral cube. Analysis of the spectral cube can
generate 2-D distributions/images of the chemical constituents and structures of
the sample surface. In fact, XPS imaging and mass spectrometry imaging (SIMS
imaging and MALDI — matrix-assisted laser desorption ionization imaging) has
recently been realized in biomaterial researches.
51,52
However, widespread pratical
applications of spectral imaging techniques are often hamppered by the length
data acquisition time of point by point spectral mapping and the achievable spatial
resolution of the spectral measurments. Therefore, success of a spectral imaging
mode often depends or is pending on technical advancements to improve the
SO13997_text.indd 245SO13997_text.indd 245 26/01/2011 3:51 PM26/01/2011 3:51 PM
238 H. Zeng
Figure 10.8. ATR-FTIR of SU-8 surface (a) before and (b) after surface modification
showing additional R–NH
2
group at 1607 cm
−1
. The other peaks are 960–1275 cm
−1
:
phenyl in plane bending; 1500–1600 cm
−1
: phenyl nucleus; 1660–2000 cm
−1
: aromatic
overtone of dCH; 2350 cm
−1
:CO
2
; 2750 cm
−1
: chelation intermolecular bond with C=O;
2850 cm
−1
:−CH
2
−; 2960 cm
−1
:−CH
3
−; 2930–3650 cm
−1
: water. With permission from.
50
detection sensitivity and shorten the data acquisition time. In the optics field,
advances on light sources/lasers, spectrographs, detectors, and fast computer data
processing have enabled the successful applications of IR spectral imaging and
Raman spectral imaging in biomaterials reseach. These two techiques will be
discussed in more details below.
10.3.3.1 Infrared Microspetroscopic Imaging
Infrared microspectroscopy measurement was first realized in the 1940s by cou-
pling an FTIR spectrometer to a light microscope.
53
Thus, it is also called FTIR
microspectroscopy. In early instruments, IR spectral imaging is acquired through
point-by-point mapping utilizing mechanical scanning of the sample. These
early instruments has been used for bone characterization and widely applied
to polymer research.
53
Infrared microspectroscopy has also been used to study
tissues and individual cells.
54,55
as well as to identify pathologic inclusions and soft
tissue calcifications.
56
Data collection using point-by-point mapping is relatively
slow and tedious. A technical improvement, the coupling of the FTIR microscope
with an array detector for FIIR imaging changed the way data was collected and
processed.
57,58
The entire field of view of the sample is analyzed simultaneously
SO13997_text.indd 246SO13997_text.indd 246 26/01/2011 3:51 PM26/01/2011 3:51 PM
Get Biomaterials for MEMS now with the O’Reilly learning platform.
O’Reilly members experience books, live events, courses curated by job role, and more from O’Reilly and nearly 200 top publishers.

