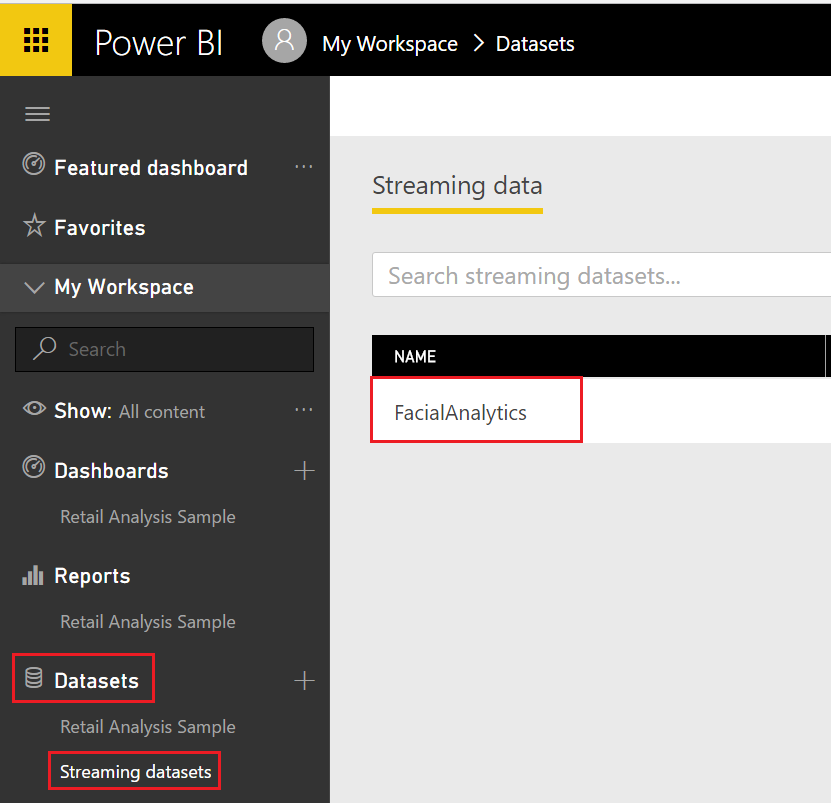
After successful starting a Stream Analytics job, sign in to Power BI and check for the newly created dataset in the Datasets section; click on Streaming datasets and start creating charts based on the data that you received.

Let's see how to create a chart for the data we received from the IoT device:
- Click on the Create Report option under the ACTIONS tab.

- Drag and drop, or select, the fields you want to show on a table chart.
- First, select a Table chart, which is located under the Visualization tab.
- The following ...

