CHAPTER 11
Multicommodity Transport Planning
Let us take the case of a company producing five commodities CA, CB, CC, CD, and CE in four plants located in Vadodara, Visakhapatnam, Nagpur, and Kochi as shown in Figure 11.1.
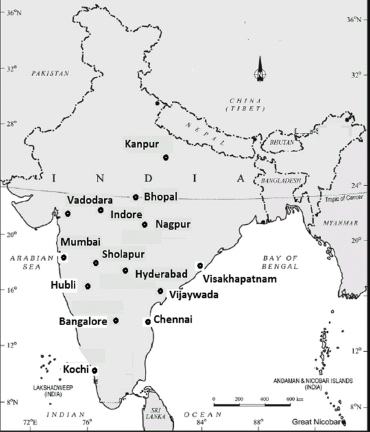
Figure 11.1
Each plant has a certain maximum production capacity for each commodity, as given in Table 11.1. It is assumed that the cost of production of these commodities is the same at all the plants.
Table 11.1
Vadodara |
Visakhapatnam |
Nagpur |
Kochi |
|
| CA | 200 |
400 |
800 |
400 |
| CB | 400 |
600 |
400 |
600 |
| CC | 800 |
200 |
600 |
800 |
| CD | 400 |
400 |
200 |
200 |
| CE | 600 |
800 |
400 |
400 |
The customers for these five commodities are located at different parts ...
Get Business Applications of Operations Research now with the O’Reilly learning platform.
O’Reilly members experience books, live events, courses curated by job role, and more from O’Reilly and nearly 200 top publishers.

