APPENDIX ASELECTED MACROECONOMIC DATA ON CHINA
The Chinese economic miracle of the past thirty years has been well discussed in other publications, and we do not propose to go into all of the aspects here but simply provide some key overview economic data. This appendix contains selected data for readers to understand the scope of what has happened since 1979.
Figure A-1 shows China’s average annual real growth rate from 1979 to 2012. A quick reading indicates a steady nearly double-digit annual growth, with only 1989–1990 being below 6 percent per year.
FIGURE A-1
China's average annual real growth rate (%)
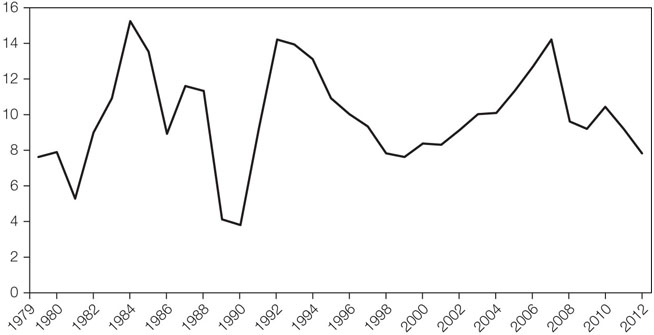
Source: Wayne M. Morrison, “China's ...
Get Can China Lead? now with the O’Reilly learning platform.
O’Reilly members experience books, live events, courses curated by job role, and more from O’Reilly and nearly 200 top publishers.

