The system page shows us the health of the system, separated into the overall system health and nodes and tenants with under 99% health. Faults counts are listed on the right-hand side, by domain, and by type. We can see the controller status in the bottom right-hand corner.
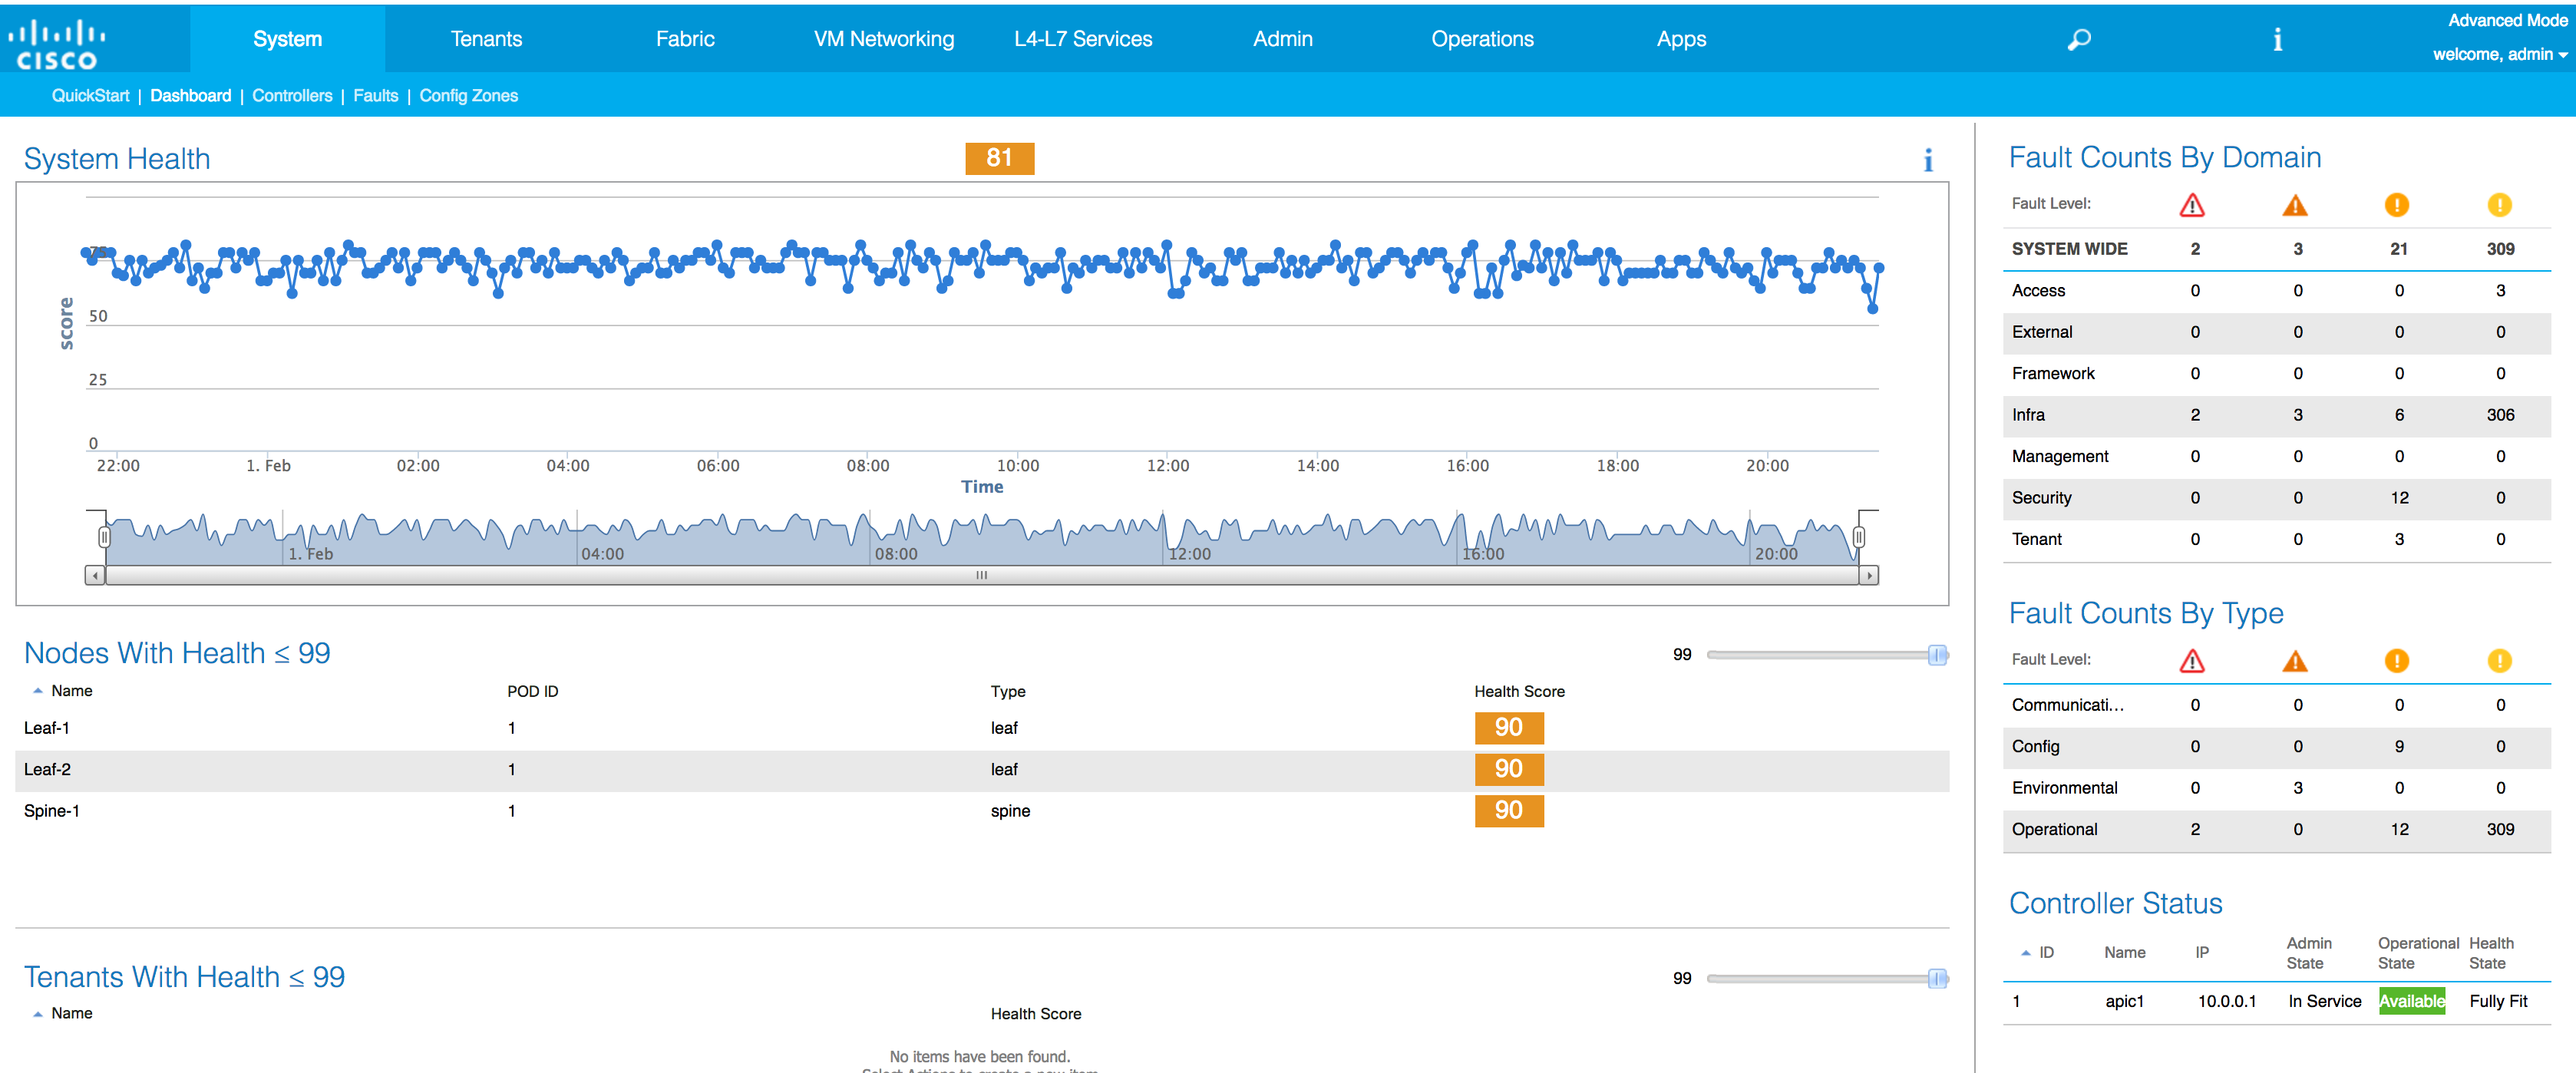
Figure 14
Moving on to the Controllers submenu we can see the screen from the previous section.
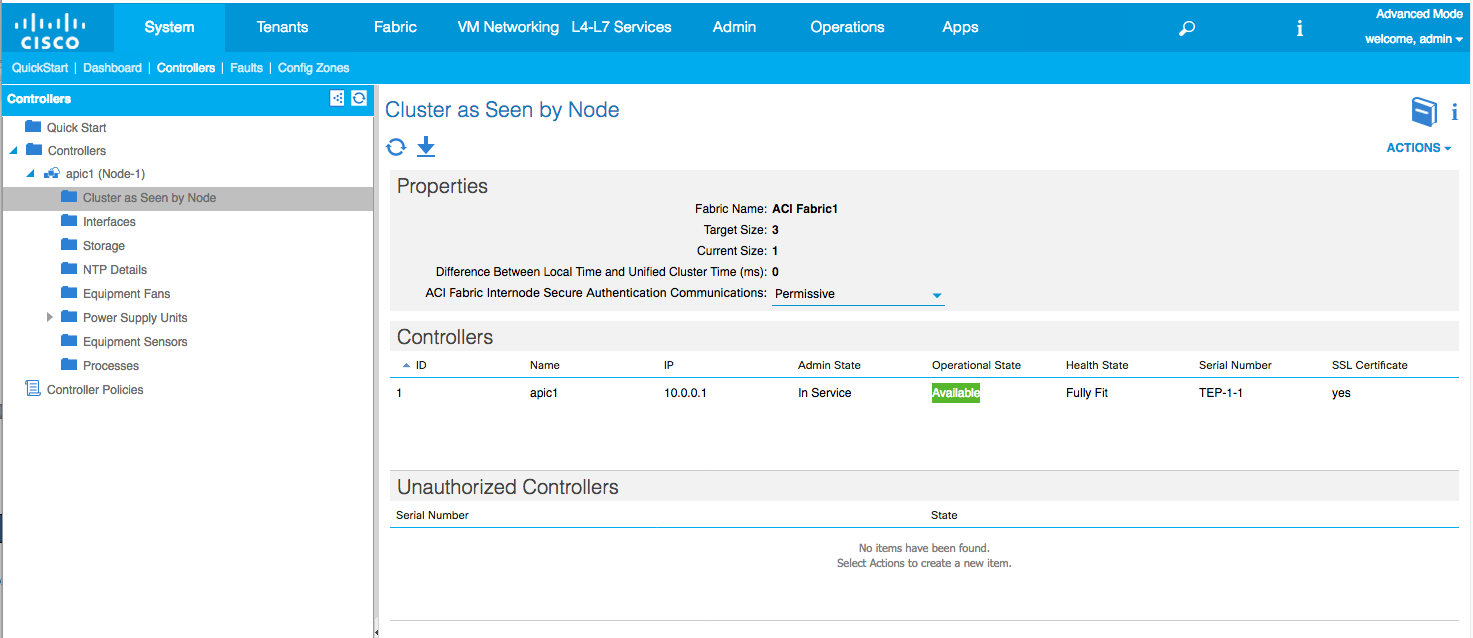
Figure 15
We have one controller (apic1); its IP address is 10.0.0.1, it is in service and available, and the health state is Fully Fit. If we click on any of the ...

