Plot and Compare the Networks
All four networks have the same number of nodes and similar density (and a similar number of edges), which makes them very easy to compare. The following picture shows the charts of all four networks.
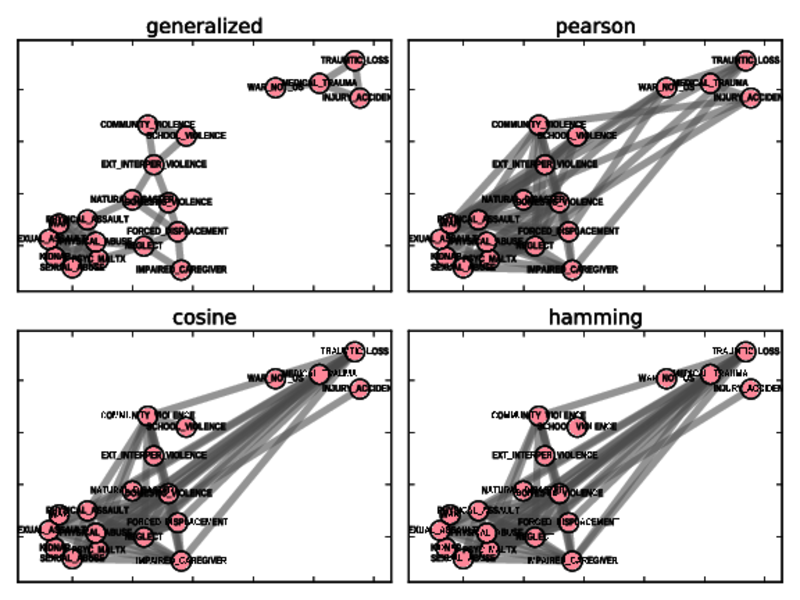
The difference between the tidy generalized similarity network cleanly separated into two components, and its brethren, is striking. You can still see some structure in the Pearson network, but the other two graphs are nearly random.
The numerical experiment with community structure extraction (see Outline Modularity-Based Communities) confirms: the first network has an acceptable modularity of 0.47 and three network ...
Get Complex Network Analysis in Python now with the O’Reilly learning platform.
O’Reilly members experience books, live events, courses curated by job role, and more from O’Reilly and nearly 200 top publishers.

