Chapter 5. Capacity planning in an existing DB2 II environment 381
5.3.1 Capacity planning procedure overview
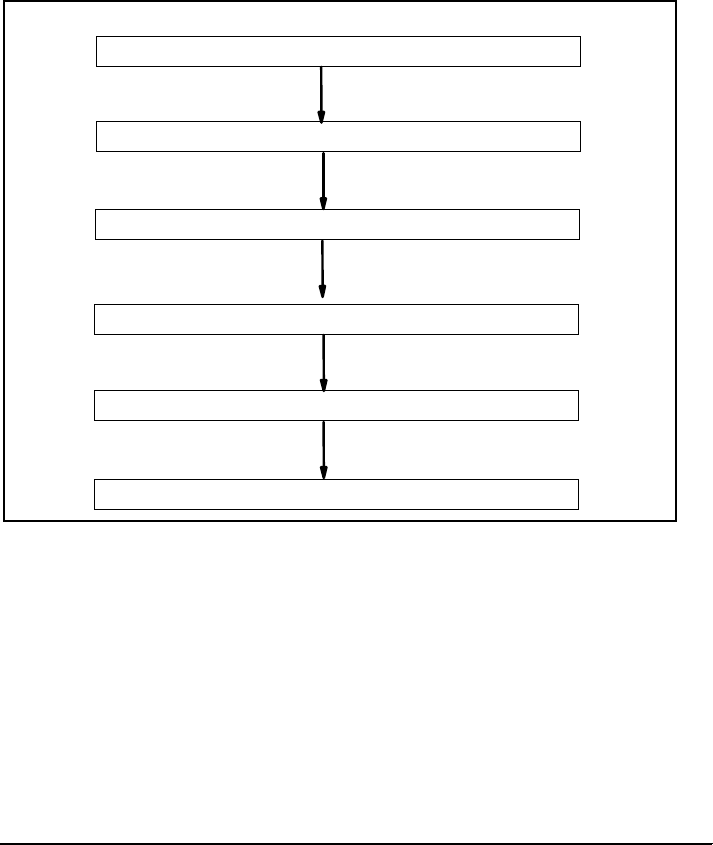
Figure 5-1 on page 382 provides an overview of the steps involved, as follows:
1. Step 1: Establish environment.
This step involves setting the appropriate DB2 monitor switches, creating the
EXPLAIN tables, creating a performance warehouse to store the snapshot
results of the dynamic cache, and summary results of utilization.
2. Step 2: Capture runtime metrics.
This step involves choosing the representative monitoring interval, capturing
the contents of the dynamic cache at representative intervals, capturing the
operating system measure of CPU and memory during these intervals,
explaining the SQL statements in the dynamic cache, and establishing the
relationship between remote SQL fragments in the user query.
3. Step 3: Summarize monitored intervals information.
This step involves summarizing the information about user queries, and their
corresponding query fragments and EXPLAIN output for each monitored
interval. This includes the CPU times, elapsed times and number of rows
processed.
4. Step 4: Identify reporting interval.
This step involves identifying which of the various runtime metrics captured in
the previous step are most relevant to computing the unit CPU cost and
memory utilization for the workload.
5. Step 5: Generate the utilization report.
This step involves generating the unit CPU cost per query, total memory
utilization, and projected growth rate of workload from the reporting interval
identified in the previous step.
6. Step 6: Estimate capacity for the anticipated future growth.
This step involves a spread sheet computation of identifying the queries in a
future workload, their frequency of execution, and throughput in order to
estimate CPU and memory capacity requirements for the anticipated
workload.
Each of these steps is elaborated on in the following sections.
382 DB2 II: Performance Monitoring, Tuning and Capacity Planning Guide
Figure 5-1 Capacity planning procedure overview
Step 1: Establish environment
The following items need to be established before ongoing capacity planning
related monitoring can begin:
1. Set the DB2 monitor switches.
In order to gather the dynamic SQL, buffer pool, and sort memory utilization
information in the snapshot monitor, the DFT_MON_STMT,
DFT_MON_BUFPOOL, and DFT_MON_SORT switches must be set as
shown in Example 5-1.
Example 5-1 Set the DB2 monitor switches
$ db2 -t update dbm cfg using dft_mon_stmt on;
DB20000I The UPDATE DATABASE MANAGER CONFIGURATION command completed
successfully.
$ db2 -t update dbm cfg using dft_mon_bufpool on;
DB20000I The UPDATE DATABASE MANAGER CONFIGURATION command completed
successfully.
$ db2 -t update dbm cfg using dft_mon_sort on;
Step 4: Identify reporting interval
Step 3: Summarize monitored intervals information
Step 1: Establish environment
Step 5: Generate the utilization report
Step 6: Estimate capacity for the anticipated future growth
Step 2: Capture runtime metrics

Chapter 5. Capacity planning in an existing DB2 II environment 383
DB20000I The UPDATE DATABASE MANAGER CONFIGURATION command completed
successfully.
2. Create the EXPLAIN tables.
First create a user for the performance warehouse, and then create the
EXPLAIN tables for that user’s schema. The EXPLAIN tables are created
using the EXPLAIN.DDL script in the $HOME/sqllib/misc/ directory, as
shown in Example 5-2, where $HOME is the DB2/II instance owner's home
directory. On Windows, the EXPLAIN.DDL script can be found in c:\Program
files\IBM\SQLLIB\misc. EXPLAIN tables are used for determining the
relationship between the user query and remote SQL fragments found in the
dynamic cache.
Example 5-2 Create the EXPLAIN tables
$db2 -tvf $HOME/sqllib/misc/EXPLAIN.DDL
3. Create the performance warehouse tables.
There are a number of tables to be created in the performance warehouse, as
shown in Example 5-3 on page 384.
– CREATE SEQUENCE FEDWH.GENSNAPID creates a sequence of name
FEDWH.GENSNAPID. It is used in generating keys for the start and end of
a monitoring interval.
– FEDWH.FEDWH_INSTANCE table that contains the average memory
utilization, maximum connections, operating system recorded CPU (via
sar command), and the computed capture ratio during each monitored
interval.
– FEDWH.FEDWH_SNAPSHOT_DYN_SQL table containing the snapshot
of dynamic cache with an additional “SNAPID” column.
– FEDWH.FEDWH_EXPLAIN_INSTANCE table that stores the relationship
between the explain table contents and the snapshot interval.
– FEDWH.FEDWH_SNAPSHOT_DYN_SQL_INTERVAL table containing
metrics of the dynamic cache for a particular monitoring interval.
– FEDWH.FEDWH_FEDSQL_INTERVAL table containing combined metrics
of the dynamic cache and explain table contents for each query in a
particular monitoring interval.
Note: The EXPLAIN.DDL script file creates EXPLAIN tables in the default
user table space (usually USERSPACE1 if the defaults were taken when
the database was created). You should modify this script to create the
EXPLAIN tables in the desired table space.
Get DB2 II: Performance Monitoring, Tuning and Capacity Planning Guide now with the O’Reilly learning platform.
O’Reilly members experience books, live events, courses curated by job role, and more from O’Reilly and nearly 200 top publishers.

