Appendix B. Statistical Tables
Table B.1. The Cumulative Standardized Normal Distribution
Each entry represents an area under the cumulative standardized normal distribution from –∞ to Z | 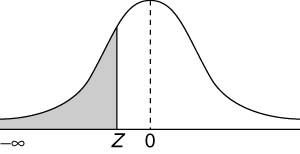 | |||||||||
Z | 0.00 | 0.01 | 0.02 | 0.03 | 0.04 | 0.05 | 0.06 | 0.07 | 0.08 | 0.09 |
–3.9 | 0.00005 | 0.00005 | 0.00004 | 0.00004 | 0.00004 | 0.00004 | 0.00004 | 0.00004 | 0.00003 | 0.00003 |
–3.8 | 0.00007 | 0.00007 | 0.00007 | 0.00006 | 0.00006 | 0.00006 | 0.00006 | 0.00005 | 0.00005 | 0.00005 |
–3.7 | 0.00011 | 0.00010 | 0.00010 | 0.00010 | 0.00009 | 0.00009 | 0.00008 | 0.00008 | 0.00008 | 0.00008 |
–3.6 | 0.00016 | 0.00015 | 0.00015 | 0.00014 | 0.00014 | 0.00013 | 0.00013 | 0.00012 | 0.00012 | 0.00011 |
–3.5 | 0.00023 | 0.00022 | 0.00022 | 0.00021 | 0.00020 | 0.00019 | 0.00019 | 0.00018 | 0.00017 | 0.00017 |
–3.4 | 0.00034 | 0.00032 | 0.00031 | 0.00030 | 0.00029 | 0.00028 | 0.00027 | 0.00026 ... | ||
Get Design for Six Sigma for Green Belts and Champions: Applications for Service Operations—Foundations, Tools, DMADV, Cases, and Certification now with the O’Reilly learning platform.
O’Reilly members experience books, live events, courses curated by job role, and more from O’Reilly and nearly 200 top publishers.

