Chapter 29. What’s Next for Excel and Power View 2013
Quick Explore
If you’re familiar with the Drill Down function in PerformancePoint Services in SharePoint, the new Quick Explore feature in Excel will be very familiar. Quick Explore appears as a small magnifying glass when you select and hover above a measure in an Excel 2013 PivotTable. One can also activate Quick Explore by right-clicking on a measure in a PivotTable and selecting Quick Explore. The most exciting aspect of this feature is that it works via the web in Excel Services. Any PivotTable published in Excel Services 2013 has the full capability of Quick Explore and the field well on the right. In Excel Services 2010, interactivity was limited to navigating hierarchies and applying filters. This is a truly a game changer for Excel Services solutions.
Trend Chart
The BI Semantic Model that we defined in Part III of this book contains a date dimension that we imported from the Azure DataMarket. Because that date dimension was identified in our model, Quick Explore is able to produce an automatic trend chart for us. We can see in Figure 29-1 that Excel offers to create a chart showing a Trend Chart of our Distinct Ticket Count measure slices by Year and by Month.
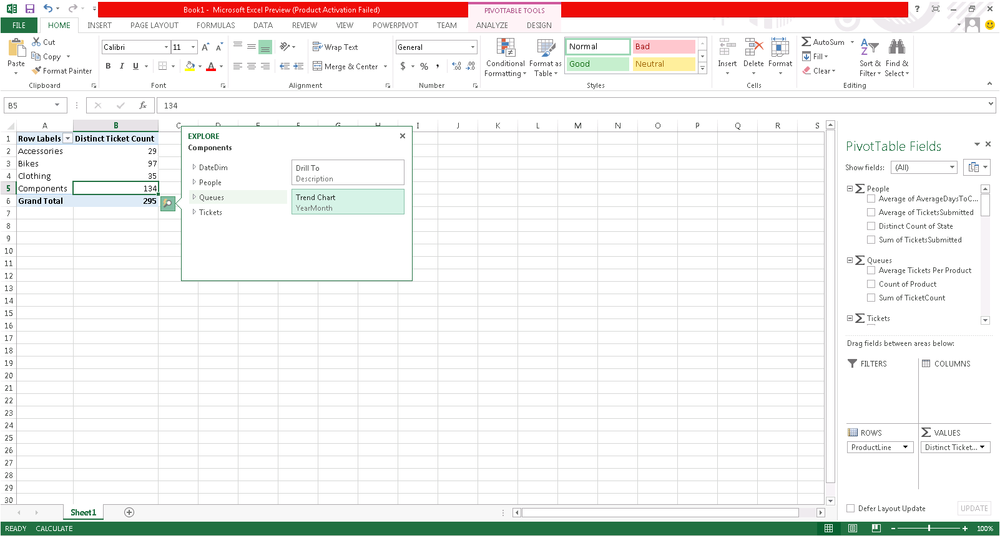
Figure 29-1. Quick Explore in Excel or Excel Services
In Figure 29-2, we can see that Quick Explore automatically creates a line chart showing Distinct Ticket Count ...
Get Developing Business Intelligence Apps for SharePoint now with the O’Reilly learning platform.
O’Reilly members experience books, live events, courses curated by job role, and more from O’Reilly and nearly 200 top publishers.

