5.2. Solved exercises
EXERCISE 5.1.
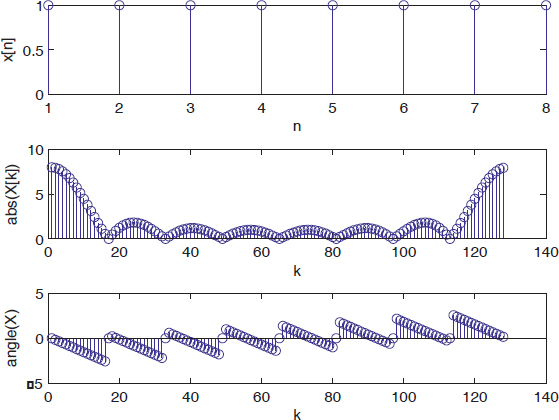
Calculate and plot the spectrum of the 1D digital signal:

x=ones(1,8) ;
X=fft(x,128);
subplot(3,1,1),
stem(x),
xlabel('n'),ylabel('x[n]')
subplot(3,1,2),
stem(abs(X)),
xlabel('k'),ylabel('abs(X[k])')
subplot(3,1,3),
stem(angle(X)),
xlabel('k'),ylabel('angle(X)')

Figure 5.1. Time and frequency representation of a digital pulse signal
EXERCISE 5.2.
This exercise is aimed at stressing how important the phase spectrum is in the case of an image.
Write a MATLAB code to evaluate the two-dimensional Fourier transform of the two images “Clown” and “Gatlin2” from MATLAB. Plot the corresponding frequency representations and reconstruct the two images by inverse transformation, but exchanging their phase spectra.
clear; clf %%%% IMAGE LOADING % Loading the image x from the file clown.mat load clown; x = X; % Loading the image x from the file gatlin2.mat load gatlin2; y = X; % Resizing x and y to have the same size l = min(size(x,1),size(y,1)); c = min(size(x,2),size(y,2)); x = x(1:l,1:c);y = y(1:l,1:c); %%%%% RECONSTRUCTION OF THE NEW IMAGES % Calculation of the FT of x and y X=fft2(x); Y=fft2(y); % Reconstruction of z1 using the magnitude of X and the phase of Y z1 = real(ifft2(abs(X).*exp(i*angle(Y)))); % Reconstruction of z2 using the magnitude of Y ...
Get Digital Signal Processing Using Matlab now with the O’Reilly learning platform.
O’Reilly members experience books, live events, courses curated by job role, and more from O’Reilly and nearly 200 top publishers.

