10.3. Exercises
EXERCISE 10.8.
Consider again the signal from exercise 10.3; calculate its modified periodogram (using the algorithm already proposed) for different windows and conclude.
EXERCISE 10.9.
Generate the mixture of the two sinusoids below, whose frequencies are not harmonic. Add a zero-mean white Gaussian noise with the variance 0.031.
| 1st sinusoid: | 2nd sinusoid: |
| frequency = 25.4 Hz | frequency = 51.3 Hz |
| amplitude = 1 | amplitude = 0.01 |
Calculate the periodogram of this signal for the following signal lengths: K = 256, 512, 1,024, and identify the harmonic frequencies as a function of K?
Then test the averaged periodogram for {K =2,048, L=8}, {K =4,096, L =16} and {K=4,096, L=8}. Which are, in each case, the harmonic frequencies? Do they depend on K ? Comment on these results and highlight the spectral leakage phenomenon. Finally, apply the modified periodogram for different windows and conclude.
EXERCISE 10.10.
Consider again the signal previously generated. Plot its power spectral density using a parametric spectral analysis (assume an AR model for the signal and find out its order – see exercise 10.5). Compare the estimated PSD with that obtained using the averaged and the modified periodogram (see exercise 10.2).
EXERCISE 10.11.
Consider an ARMA(2, 2) model having the following transfer function:
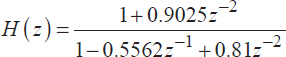
driven by a zero-mean white Gaussian noise with the variance 1. ...
Get Digital Signal Processing Using Matlab now with the O’Reilly learning platform.
O’Reilly members experience books, live events, courses curated by job role, and more from O’Reilly and nearly 200 top publishers.

