Introduction: What Is Distributed Tracing?
If you’re reading this book, you may already have some idea what the words distributed tracing mean. You may also have no idea what they mean—for all we know, you’re simply a fan of bandicoots (the animal on the cover). We won’t judge, promise.
Either way, you’re reading this to gain some insight into what distributed tracing is, and how you can use it to understand the performance and operation of your microservices and other software. With that in mind, let’s start out with a simple definition.
Distributed tracing (also called distributed request tracing) is a type of correlated logging that helps you gain visibility into the operation of a distributed software system for use cases such as performance profiling, debugging in production, and root cause analysis of failures or other incidents. It gives you the ability to understand exactly what a particular individual service is doing as part of the whole, enabling you to ask and answer questions about the performance of your services and your distributed system as a whole.
That was easy—see you next book!
What’s that? Why’s everyone asking for a refund? Oh…
We’re being told that you need a little more than that. Well, let’s take a step back and talk about software, specifically distributed software, so that we can better understand the problems that distributed tracing solves.
Distributed Architectures and You
The art and science of developing, deploying, and operating software is constantly in flux. New advances in computing hardware and software have dramatically pushed the boundaries of what an application looks like over the years. While there’s an interesting digression here about how “everything old is new again,” we’ll focus on changes over the past two decades or so, for the sake of brevity.
Prior to advances in virtualization and containerization, if you needed to deploy some sort of web-based application, you would need a physical server, possibly one dedicated to your application itself. As traffic increased to your application, you would either need to increase the physical resources of that server (adding RAM, for example) or you would need multiple servers that each ran their own copy of your application.
With a monolithic server process, this horizontal scaling often led to unfavorable trade-offs in cost, performance, and organizational overhead. Running multiple instances of your server meant you were duplicating all functionality of the server, rather than scaling individual subcomponents independently. With traditional infrastructure, you were often forced to make a decision about how many minutes (or hours!) of degraded performance was acceptable while you brought additional capacity online—servers aren’t cheap to run, so why would you run at peak capacity if you didn’t need to? Finally, as the size and complexity of your application increased, along with the amount of developers who were working on it, testing and validating new changes became more difficult. As your organization grew, it became unreasonable for developers to understand a single codebase, not to mention the shape of the entire system. Increasingly smaller changes increased the odds of a ripple effect that led to total application failure as their impact radiated out from one component to another.
Time marched on, however, and solutions to these problems were built. Software was created that abstracted away the details of physical hardware such as virtualization, allowing for a single physical server to be split into multiple logical servers. Docker and other containerization technologies extended this concept, providing a lightweight and user-friendly abstraction over heavier-weight virtual machines, moving the question of “who deploys this software” from operators to developers. The popularization of cloud computing and its notion of on-demand computing resources solved the problem of resource scaling, as it became possible to increase the amount of RAM or CPU cores for a given server at the click of a button. Finally, the idea of microservice architectures came about to address the complexity imposed by ever-larger and more complicated software-oriented businesses by structuring large applications around loosely coupled independent services.
Today, it’s arguable that most applications are distributed in some fashion, even if they don’t use microservices. Simple client-server applications themselves are distributed—consider the classic question of “A call to my server has timed out; was the response lost, or was the work not done at all?” Additionally, they may have a variety of distributed dependencies, such as datastores that are consumed as a service offered by a cloud provider, or a whole host of third-party APIs that provide everything from analytics to push notifications and more.
Why is distributed software so popular? The arguments for distributed software are pretty clear:
- Scalability
-
A distributed application can more easily respond to demand, and its scaling can be more efficient. If a lot of people are trying to log in to your application, you could scale out only the login services, for example.
- Reliability
-
Failures in one component shouldn’t bring down the entire application. Distributed applications are more resilient because they split up functions through a variety of service processes and hosts, ensuring that even if a dependent service goes offline, it shouldn’t impact the rest of the application.
- Maintainability
-
Distributed software is more easily maintainable for a couple of reasons. Dividing services from each other can increase how maintainable each component is by allowing it to focus on a smaller set of responsibilities. In addition, you’re freer to add features and capabilities without implementing (and maintaining) them yourself—for example, adding a speech-to-text function in an application by relying on some cloud provider’s speech-to-text service.
This is the tip of the iceberg, so to speak, in terms of the benefits of distributed architectures. Of course, it’s not all sunshine and roses, and into every life, a little rain must fall…
Deep Systems
A distributed architecture is a prime example of what software architects often call a deep system.1 These systems are notable not because of their width, but because of their complexity. If you think about certain services or classes of services in a distributed architecture, you should be able to identify the difference. A pool of cache nodes scales wide (as in, you simply add more instances to handle demand), but other services scale differently. Requests may route through three, four, fourteen, or forty different layers of services, and each of those layers may have other dependencies that you aren’t aware of. Even if you have a comparatively simple service, your software probably has dozens of dependencies on code that you didn’t write, or on managed services through a cloud provider, or even on the underlying orchestration software that manages its state.
The problem with deep systems is ultimately a human one. It quickly becomes unrealistic for a single human, or even a group of them, to understand enough of the services that are in the critical path of even a single request and continue maintaining it. The scope of what you as a service owner can control versus what you’re implicitly responsible for is illustrated in Figure P-1. This calculus becomes a recipe for stress and burnout, as you’re forced into a reactive state against other service owners, constantly fighting fires, and trying to figure out how your services interact with each other.
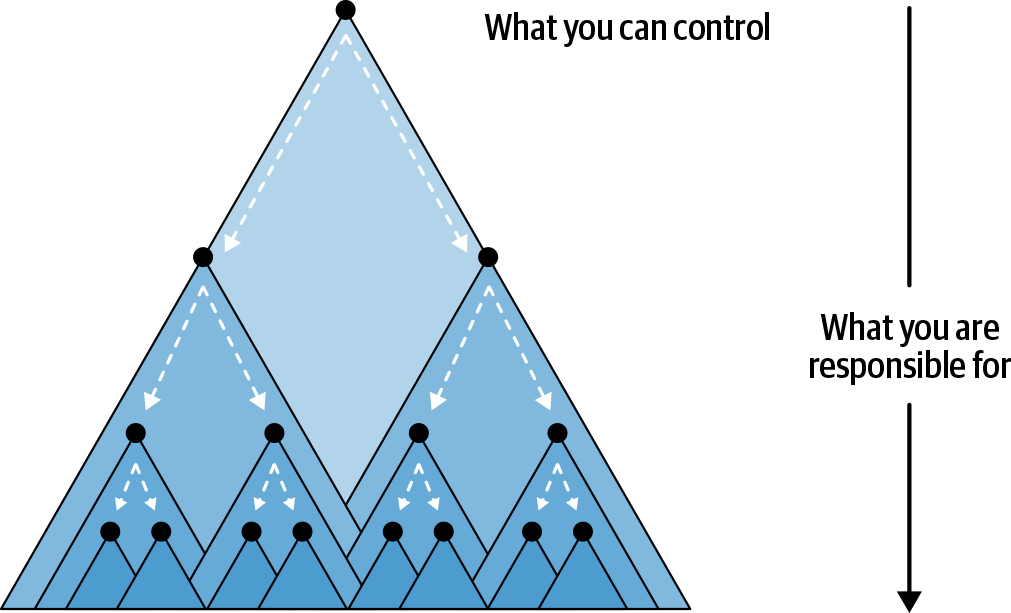
Figure P-1. The service that you can control has dependencies that you’re responsible for but have no direct control over.
Distributed architectures require a reimagined approach to understanding the health and performance of software. It’s not enough to simply look at a single stack trace or watch graphs of CPU and memory utilization. As software scales—in depth, but also in breadth—telemetry data like logs and metrics alone don’t provide the clarity you require to quickly identify problems in production.
The Difficulties of Understanding Distributed Architectures
Distributing your software presents new and exciting challenges. Suddenly, failures and crashes become harder to pin down. The service that you’re responsible for may be receiving data that’s malformed or unexpected from a source that you don’t control because that service is managed by a team halfway across the globe (or a remote team). Failures in services that you thought were rock-solid suddenly cause cascading failures and errors across all of your services. To borrow a phrase from Twitter, you’ve got a microservices murder mystery (see Figure P-2) on your hands.
Figure P-2. It’s funny because it’s true.
To extend the metaphor, monitoring helps determine where the body is, but it doesn’t reveal why the murder occurred. Distributed tracing fills in those gaps by allowing you to easily comprehend your entire system by providing solutions to three major pain points:
- Obfuscation
-
As your application becomes more distributed, the coherence of failures begins to decrease. That is to say, the distance between cause and effect increases. An outage at your cloud provider’s blob storage could fan out to cause huge cascading latency for everyone, or a single difficult-to-diagnose failure at a particular service many hops away that prevents you from uncovering the proximate cause.
- Inconsistency
-
Distributed applications might be reliable overall, but the state of individual components can be much less consistent than they would be in monolithic or non-distributed applications. In addition, since each component of a distributed application is designed to be highly independent, the state of those components will be inconsistent—what happens when someone does a deployment, for example? Do all of the other components understand what to do? How does that impact the overall application?
- Decentralized
-
Critical data about the performance of your services will be, by definition, decentralized. How do you go looking for failures in a service when there may be a thousand copies of that service running, on hundreds of hosts? How do you correlate those failures? The greatest strength of distributing your application is also the greatest impediment to understanding how it actually functions!
You may be wondering, “How do we address these difficulties?” Spoiler: distributed tracing.
How Does Distributed Tracing Help?
Distributed tracing emerges as a critical tool in managing the explosion of complexity that our deep systems bring. It provides context that spans the life of a request and can be used to understand the interactions and shape of your architecture. However, these individual traces are just the beginning—in aggregate, traces can give you important insights about what’s actually going on in your distributed system, allowing you not only to correlate interesting data about your services (for example, that most of your errors are happening on a specific host or in a specific database cluster), but also to filter and rank the importance of other types of telemetry. Effectively, distributed traces provide context that helps you filter problem-solving down to only things that are relevant to your investigation, so you don’t have to guess and check multiple logs and dashboards. In this way, distributed tracing is actually at the center of a modern observability platform, and it becomes a critical component of your distributed architecture rather than an isolated tool.
So, what is a trace? The easiest way to understand is to think about your software in terms of requests. Each of your components is in the business of doing some sort of work in response to a request (aka RPC, from remote procedure call) from another service. This could be as prosaic as a web page requesting some structured data from a service endpoint to present to a user, or as complex as a highly parallelized search process. The actual nature of the work doesn’t matter too much, although there are certain patterns that we’ll discuss later on that lend themselves to certain styles of tracing. While distributed tracing can function in most distributed systems, as we’ll discuss in Chapter 4, its strengths are best demonstrated in modeling the RPC relationships between your services.
In addition to the RPC relationships, think about the work that each of those services does. Maybe they’re authenticating and authorizing user roles, performing mathematical calculations, or simply transforming data from one format to another. These services are communicating with each other through RPCs, sending requests and receiving responses. Regardless of what they’re doing, one thing that all of these services have in common is that the work they’re performing takes some length of time. The basic pattern of services and RPCs is illustrated in Figure P-3.
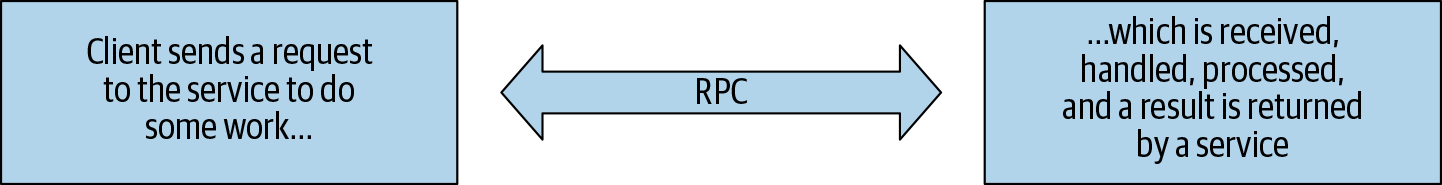
Figure P-3. A request from a client process to a service process.
We call the work that each service is doing a span, as in the span of time that it takes for the work to occur. These spans can be annotated with metadata (known as attributes or tags) and events (also referred to as logs). The RPCs between services are represented through relationships that model the nature of the request and the order in which the requests occur. This relationship is propagated by way of the trace context, some data that uniquely identifies a trace and each individual span within it. The span data that is created by each service is then forwarded to some external process, where it can be aggregated into a trace, analyzed for further insights, and stored for further analysis. A simple example of a trace can be seen in Figure P-4, showing a trace between two services, as well as a subtrace inside the first service.
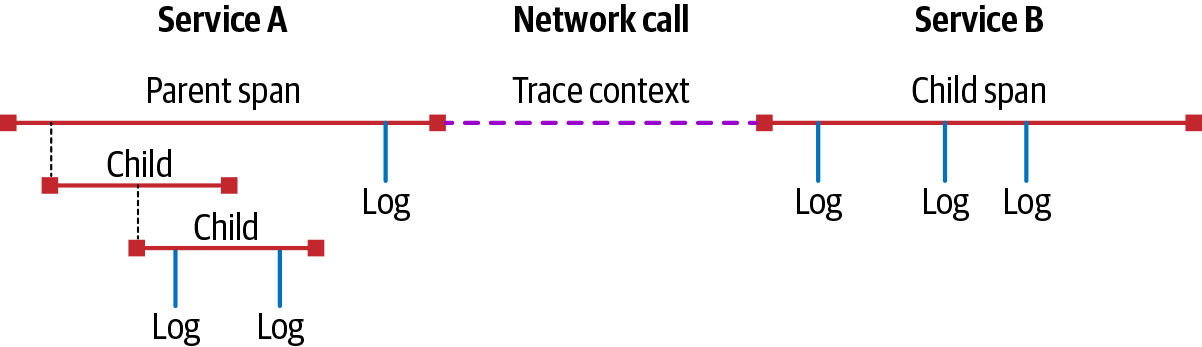
Figure P-4. A simple trace.
Distributed tracing mitigates the obfuscation present in distributed architectures by ensuring that each logical request through your services is presented as that—a single logical request. It ensures that all of the data relevant to a given execution of your business logic remain coupled at the point that they’re analyzed and presented. It addresses the inconsistency issue by allowing queries to be made using relationships between services along specific APIs or other routes, letting you ask questions like “What happens to my API when this other service is down?” Finally, it addresses the decentralization issue by providing a method to ensure that processes can contribute trace data independently to a collector that can centralize it later, allowing you to visualize and understand requests that may be running across multiple datacenters, regions, or other distributions.
With all this in mind, what are some things that you can do with distributed tracing? What makes it crucial to understanding distributed systems? We’ve compiled several real-world examples:
-
A major transactional email and messaging company implemented distributed tracing across its backend platform, including tracing calls to Redis. This trace data quickly showed that there was an unneeded loop in its calls to Redis, which was fetching data from the cache more than necessary. In removing this unneeded call, the company reduced the time it took to send an email anywhere from 100 to 1,000 milliseconds! This worked out to be a roughly 85% reduction in the time for every single email sent—and this is for a platform that was sending over one billion emails a day! Not only was the company able to discover this unneeded call, it was able to validate the impact of removing it on other services and quantify the value of the work.
-
An industrial data company was able to use distributed trace data in order to easily compare requests during an incident where a primary database was overloaded to an earlier baseline. The ability to view aggregate statistical data about historical performance along with the context of individual requests during the regression dramatically reduced the time required to determine the root cause of the incident.
-
A major health and fitness company implemented distributed tracing across its applications. As they analyzed the performance of their document database, engineers were able to identify repeated calls that could be consolidated, leading to reduced latency and more efficient code.
-
A video-delivery platform used distributed tracing to troubleshoot latency issues from managed services that its system relied on. It was able to positively identify an issue with its cloud provider’s Kafka pipeline before the vendor did, enabling a rapid response to the incident and restoration of desired performance.
These are just a handful of examples—distributed tracing has also demonstrated value in teams that are trying to better understand their continuous integration systems by providing visibility into their test pipeline, into the operation of global-scale search technologies at Google, and as a cornerstone of open source projects like OpenTelemetry. The question truly is: what is distributed tracing to you?
Distributed Tracing and You
Distributed tracing, again, is a method to understand distributed software. That’s a lot like saying that water is wet, though—not terribly helpful, and reductive to a fault. Indeed, the best way to understand distributed tracing is to see it in practice, which is where this book comes in!
In the coming chapters, we’ll cover the three major things you need to know to get started with implementing distributed tracing for your applications and discuss strategies that you can apply to solve the problems caused by distributed architectures. You’ll learn about the different ways to instrument your software for distributed tracing and the styles of tracing and monitoring available to you. We’ll discuss how to collect all of the data that your instrumentation produces and the various performance considerations and costs around the collection and storage of trace data. After that, we’ll cover how to generate value from your trace data and turn it into useful, operational insights. Finally, we’ll talk about the future of distributed tracing.
By the end of this book, you should understand the exciting world of distributed tracing and know where, how, and when to implement it for your software. Ultimately, the goal of Distributed Tracing in Practice is to allow you to build, operate, and understand your software more easily. We hope that the lessons in this text will help you in building the next generation of monitoring and observability practice at your organization.
Conventions Used in This Book
The following typographical conventions are used in this book:
- Italic
-
Indicates new terms, URLs, email addresses, filenames, and file extensions.
Constant width-
Used for program listings, as well as within paragraphs to refer to program elements such as variable or function names, databases, datatypes, environment variables, statements, and keywords.
Constant width bold-
Shows commands or other text that should be typed literally by the user.
Constant width italic-
Shows text that should be replaced with user-supplied values or by values determined by context.
Note
This element signifies a general note.
Using Code Examples
Supplemental material (code examples, exercises, etc.) is available for download on GitHub.
If you have a technical question or a problem using the code examples, please send email to bookquestions@oreilly.com.
This book is here to help you get your job done. In general, if example code is offered with this book, you may use it in your programs and documentation. You do not need to contact us for permission unless you’re reproducing a significant portion of the code. For example, writing a program that uses several chunks of code from this book does not require permission. Selling or distributing examples from O’Reilly books does require permission. Answering a question by citing this book and quoting example code does not require permission. Incorporating a significant amount of example code from this book into your product’s documentation does require permission.
We appreciate, but generally do not require, attribution. An attribution usually includes the title, author, publisher, and ISBN. For example: “Distributed Tracing in Practice by Austin Parker, Daniel Spoonhower, Jonathan Mace, and Rebecca Isaacs with Ben Sigelman (O’Reilly). Copyright 2020 Ben Sigelman, Austin Parker, Daniel Spoonhower, Jonathan Mace, and Rebecca Isaacs, 978-1-492-05663-8.”
If you feel your use of code examples falls outside fair use or the permission given above, feel free to contact us at permissions@oreilly.com.
O’Reilly Online Learning
Note
For more than 40 years, O’Reilly Media has provided technology and business training, knowledge, and insight to help companies succeed.
Our unique network of experts and innovators share their knowledge and expertise through books, articles, and our online learning platform. O’Reilly’s online learning platform gives you on-demand access to live training courses, in-depth learning paths, interactive coding environments, and a vast collection of text and video from O’Reilly and 200+ other publishers. Visit http://oreilly.com for more information.
How to Contact Us
Please address comments and questions concerning this book to the publisher:
- O’Reilly Media, Inc.
- 1005 Gravenstein Highway North
- Sebastopol, CA 95472
- 800-998-9938 (in the United States or Canada)
- 707-829-0515 (international or local)
- 707-829-0104 (fax)
We have a web page for this book, where we list errata, examples, and any additional information. You can access this page at https://oreil.ly/distributed-tracing.
Email bookquestions@oreilly.com to comment or ask technical questions about this book.
For news and information about our books and courses, visit http://oreilly.com.
Find us on Facebook: http://facebook.com/oreilly
Follow us on Twitter: http://twitter.com/oreillymedia
Watch us on YouTube: http://www.youtube.com/oreillymedia
Acknowledgments
- Austin Parker
-
Special thanks to everyone at O’Reilly who helped make this possible—our editors, Sarah Grey, Virginia Wilson, and Katherine Tozer; the production staff who worked tirelessly indexing, revising, redrawing, and making sure things fit on the page. Thanks to our technical reviewers for their insights and feedback; you made this a better book! I’d also like to thank Ben Sigelman and the rest of the crew at Lightstep for all their support—truly, without y’all, none of this would have happened.
I’d like to thank my parents, for having me, and to my Dad for being a daily inspiration. Love you both. To my wife: <3.
In solidarity, Austin.
- Daniel Spoonhower
-
I’d like to thank everyone at Lightstep for supporting Austin and me through this work, and especially those that answered my many questions about their experience implementing and using tracing. I’d like to thank Bob Harper and Guy Blelloch for helping me to understand the value of clear writing (and for giving me some practice in writing under a deadline). I’d also like to thank my family for helping me find the time to work on this book.
- Rebecca Isaacs
-
I would like to acknowledge the experience, advice and good ideas of my colleagues, many of whom have high expectations for the utility of distributed tracing in production settings. I would also like to thank Paul Barham for his insights and wisdom about tracing and analysis of distributed systems.
Get Distributed Tracing in Practice now with the O’Reilly learning platform.
O’Reilly members experience books, live events, courses curated by job role, and more from O’Reilly and nearly 200 top publishers.

