366 Ecological Sustainability
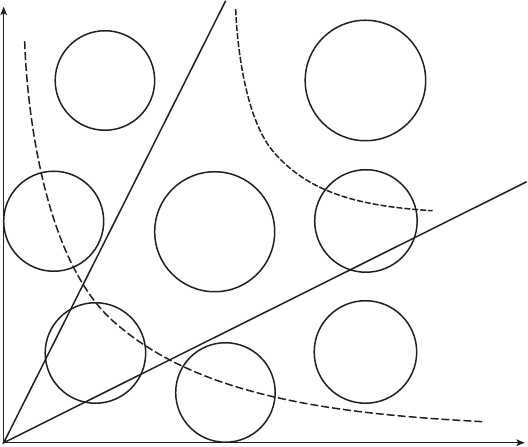
5. The nal operation in the paper computer paradigm is to plot the
2-D vector descriptors for each variable on an x–y graph that Vester
called a diagraph. (Note that a diagraph is not the same thing as a
digraph.) The passive sum numbers are plotted on the positive x-axis,
and the active sum numbers along the positive y-axis. A pair of active
and passive numbers determines the location of that variable in 2-D,
impact vector space in the rst quadrant.
Vester identied eight regions in the diagraph’s 2-D space (see
Figure 8.2). Points lying in region 1 (the top left corner) belong to
active ...


