5Power and Performance of Workloads
5.1. Power and performance of workloads
5.1.1. SKU power and performance variations
The power consumption in a server depends very much on its configuration and the workloads it is executing. As our goal is also to compare the impact of different cooling technologies on power, thermal characteristics and performance, we want to reduce to a minimum the impact of other “variables” such as the power, thermal and performance variations across the same processor chips.
The performance/frequency variations of the same processor SKU have been measured by Aucun et al. (2016). It was also measured on the SuperMUC phase 2 system (see section 7.2.3) on nodes with the same configuration based on Intel Xeon Haswell 2697v3, the same “batch” of boards and with the same cooling/thermal conditions since the system was using water-cooled nodes. Figure 5.1 shows the distribution of node AVX2 frequency (x-axis) measured when running single-node HPL across the nodes with the number of nodes on y-axis.
As we can see, while the AVX2 base frequency of the 2697v3 processor is 2.2 GHz, the distribution of AVX2 measured frequency is a “bell” curve varying between 2.2 GHz and 2.4 GHz, which shows all processors are above Intel’s 2.2GHz minimum specification but some are 8% faster.
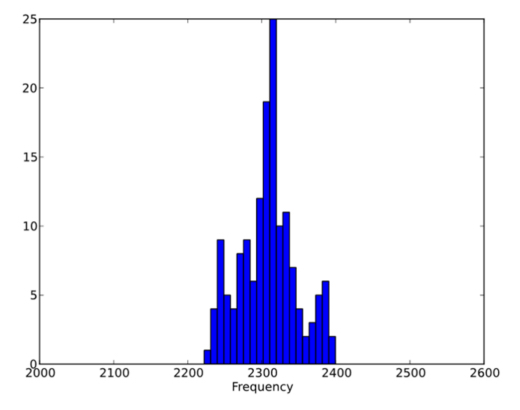
Figure 5.1. AVX2 frequency across different 2697v3 processor SKU
Therefore, we were ...
Get Energy-Efficient Computing and Data Centers now with the O’Reilly learning platform.
O’Reilly members experience books, live events, courses curated by job role, and more from O’Reilly and nearly 200 top publishers.

