Chapter 6. Working with Shapes and Other Graphics
In This Chapter
Inserting and customizing shapes
Working with other types of graphics
Introducing Office 2007 SmartArt
Using shapes with charts
When it comes to visuals to enhance a presentation, Excel has a lot more up its sleeve than charts. As you probably know, you can insert a wide variety of graphic images into your worksheet to add pizzazz to an otherwise boring report. And, as you'll see, you can even combine these graphics with your charts.
This chapter describes the non–chart–related graphic tools available in Excel. These consist of shapes, SmartArt, clip art, and imported images.
Using Shapes
The Microsoft Office applications, including Excel, provide access to a variety of customizable graphic images known as shapes. You can add a shape to a worksheet's drawing layer or to a chart.
Access these shapes by using the Insert
The Shapes gallery is shown in Figure 6-1.
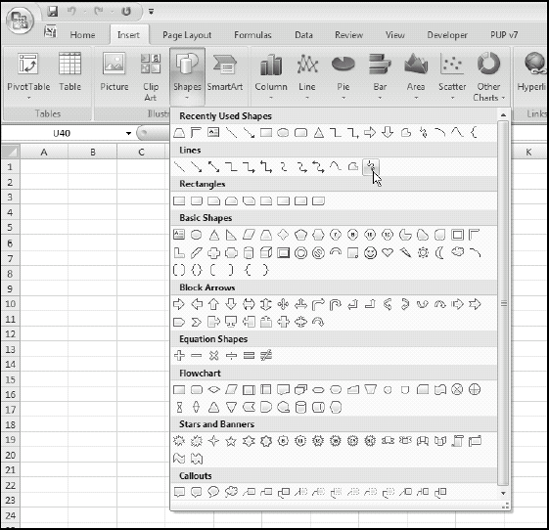
Figure 6-1. The Shapes gallery
Drawing a shape is easy and very intuitive. The shapes in the gallery are grouped into the following categories:
Recently Used Shapes: Contains the shapes that you've used recently, making it easy to find those shapes again
Lines: Twelve styles of lines, including arrows and freehand drawing
Rectangles: Nine styles of rectangles
Basic Shapes: Forty–two ...
Get Excel® 2007 Charts now with the O’Reilly learning platform.
O’Reilly members experience books, live events, courses curated by job role, and more from O’Reilly and nearly 200 top publishers.

