Chapter 12: Visualizing Data with Charts
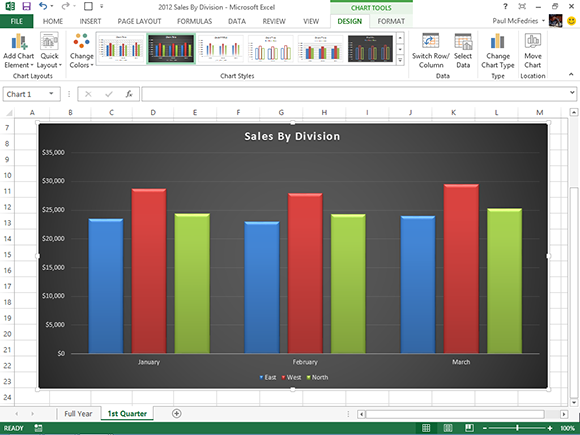
You can take a worksheet full of numbers and display them as a chart. Visualizing your data in this way makes the data easier to understand and analyze. To help you see your data exactly the way you want, Excel offers a wide variety of chart types, including pie charts, column charts, and stock charts. Excel also offers a large number of chart options that enable you to add chart titles and data labels, control the chart legend and gridlines, format the chart layout and style, change the chart type, and more.