Chapter 4. Studying Startup Investments
In this chapter, we will dive into the world of startup investments. This real-world use case shows us how three of the six graph powers help us to reveal high-potential investment opportunities. The first graph power, connecting the dots, allows us to view how various actors in the investment landscape are connected. The second graph power, looking deep, offers investors a method to include connected information about those actors in our analysis. The third graph power, weighing and predicting, enables us to utilize past funding events and investment portfolios to predict the success rate of future investments.
After completing this chapter, you should be able to:
-
Explain how connecting the dots, looking deep, and weighing and predicting address search and analysis needs
-
Model and analyze startup investment opportunities
-
Traverse multihop relationships to filter deeper connected information
-
Read and understand more advanced GSQL queries
Goal: Find Promising Startups
Investing in a startup is an exciting and lucrative way of building wealth. Investors poured over $156 billion into US startups in 2020. Those startups generated over $290 billion of liquidity.1 However, 9 out of 10 startups will fail, and with only 40% becoming profitable, it becomes a challenge to bet on the right horse.2
Startups start with a founding team consisting of only a few members. Over time, as a startup goes through different development stages, its product improves, and the team grows. To fund these developments, the startup needs money from investors. From the perspective of investment, one way to identify which startup is a proper candidate to finance is by looking at the composition of the startup team and its organization. Startups that have the right people at the right places in their organizations tend to have higher chances of success. Therefore, startups led by founders with a positive track record of building up companies are more likely to succeed in other companies. Another way to assess the investment opportunity is by looking at the startup’s existing investors. Investors with a high return on their investment portfolio show that they can see the potential of startups in the early stages and help them grow into more profitable businesses.
Investing in startups is a risky and complex assessment that requires understanding the product and market it tries to take on and the people and organizations that drive it. Investors need to have an overview of the relationships between these aspects that help support the analysis of a startup’s potential.
Solution: A Startup Investment Graph
Data to support the assessment of investments is mainly unstructured because it is collected from different sources. One example of such a source is the Crunchbase dataset. This dataset contains information on investment rounds, founders, companies, investors, and investment portfolios. However, the dataset is in raw format, meaning that the data is not structured to answer the questions we have on the entities related to startups for investment purposes. Data about startups and the entities contributing to the current state is hidden from us unless we query for the data explicitly. With graphs, we can form a schema centered around a target startup that we want to investigate and view the impact of other entities on the startup.
Investing in startups occurs in a series of funding events, as shown in Figure 4-1. Startups typically want to raise more money from a more extensive mixture of investors in every later funding stage. Knowing the timing and sequence of events throughout these funding stages is essential to validate successful investment interactions. Graphs can provide a complete overview of an investment network by searching for multihop chains of events. By doing this, we can connect angel investors and venture capitalists through different funding stages and expose their investment portfolios’ success rates over time.
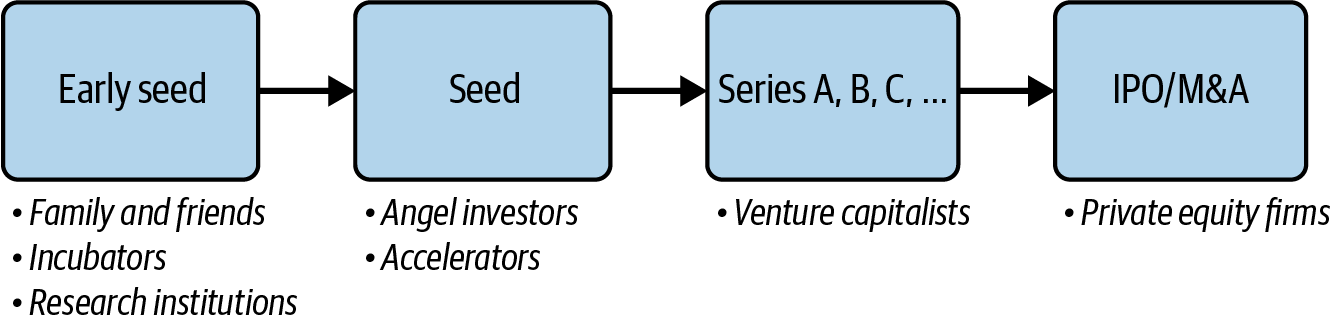
Figure 4-1. Startup funding stages and types of investors per stage
Traditional relational database queries provide us with a snapshot of an event and the state of each entity at a single point in time. However, when assessing investment portfolios, we need to understand the relationships between investors and the companies they have invested in and how these relationships have evolved. Graphs solve this by showing the investment portfolio as a series of events using multihop queries. We can also use multiple hops to perform complex searches and filtering, such as “find companies that have board members who are from a top-ranked VC firm and who previously served on the board of startups that had successful exits.”
For example, we want to know what startups colleagues of a successful investor are investing in now. This insight allows us to utilize successful investors’ expertise and network based on their past investments. A multihop query can realize this by first selecting one or more successful investors. We might already have some in mind, or we could find them by counting the number of successful investors per investor; that would be one hop. The second hop selects all financial organizations where the investors work. The third hop query selects colleagues at those financial organizations, and the fourth hop selects other funding events where those colleagues participate.
Implementing a Startup Investment Graph and Queries
TigerGraph Cloud offers a starter kit for the startup investment analysis use case. In the remainder of this chapter, we will describe how we model startups and their funding with a graph schema. Then we’ll look at four different graph analyses that could help an investor select promising startups.
The Crunchbase Starter Kit
Use the TigerGraph Cloud account that you created in Chapter 3 to deploy a new use case and select “Enterprise Knowledge Graph (Crunchbase).” Once this starter kit is installed, follow the steps in the section “Load data and install queries for a starter kit” in Chapter 3.
Graph Schema
The starter kit includes actual data from investments in startups in 2013 collected by Crunchbase. It has more than 575K vertices and over 664K edges, with 10 vertex types and 24 edge types. Figure 4-2 shows the graph schema of this starter kit. We can immediately see that Company is a vertex type that acts as a hub because it connects to many other vertex types.
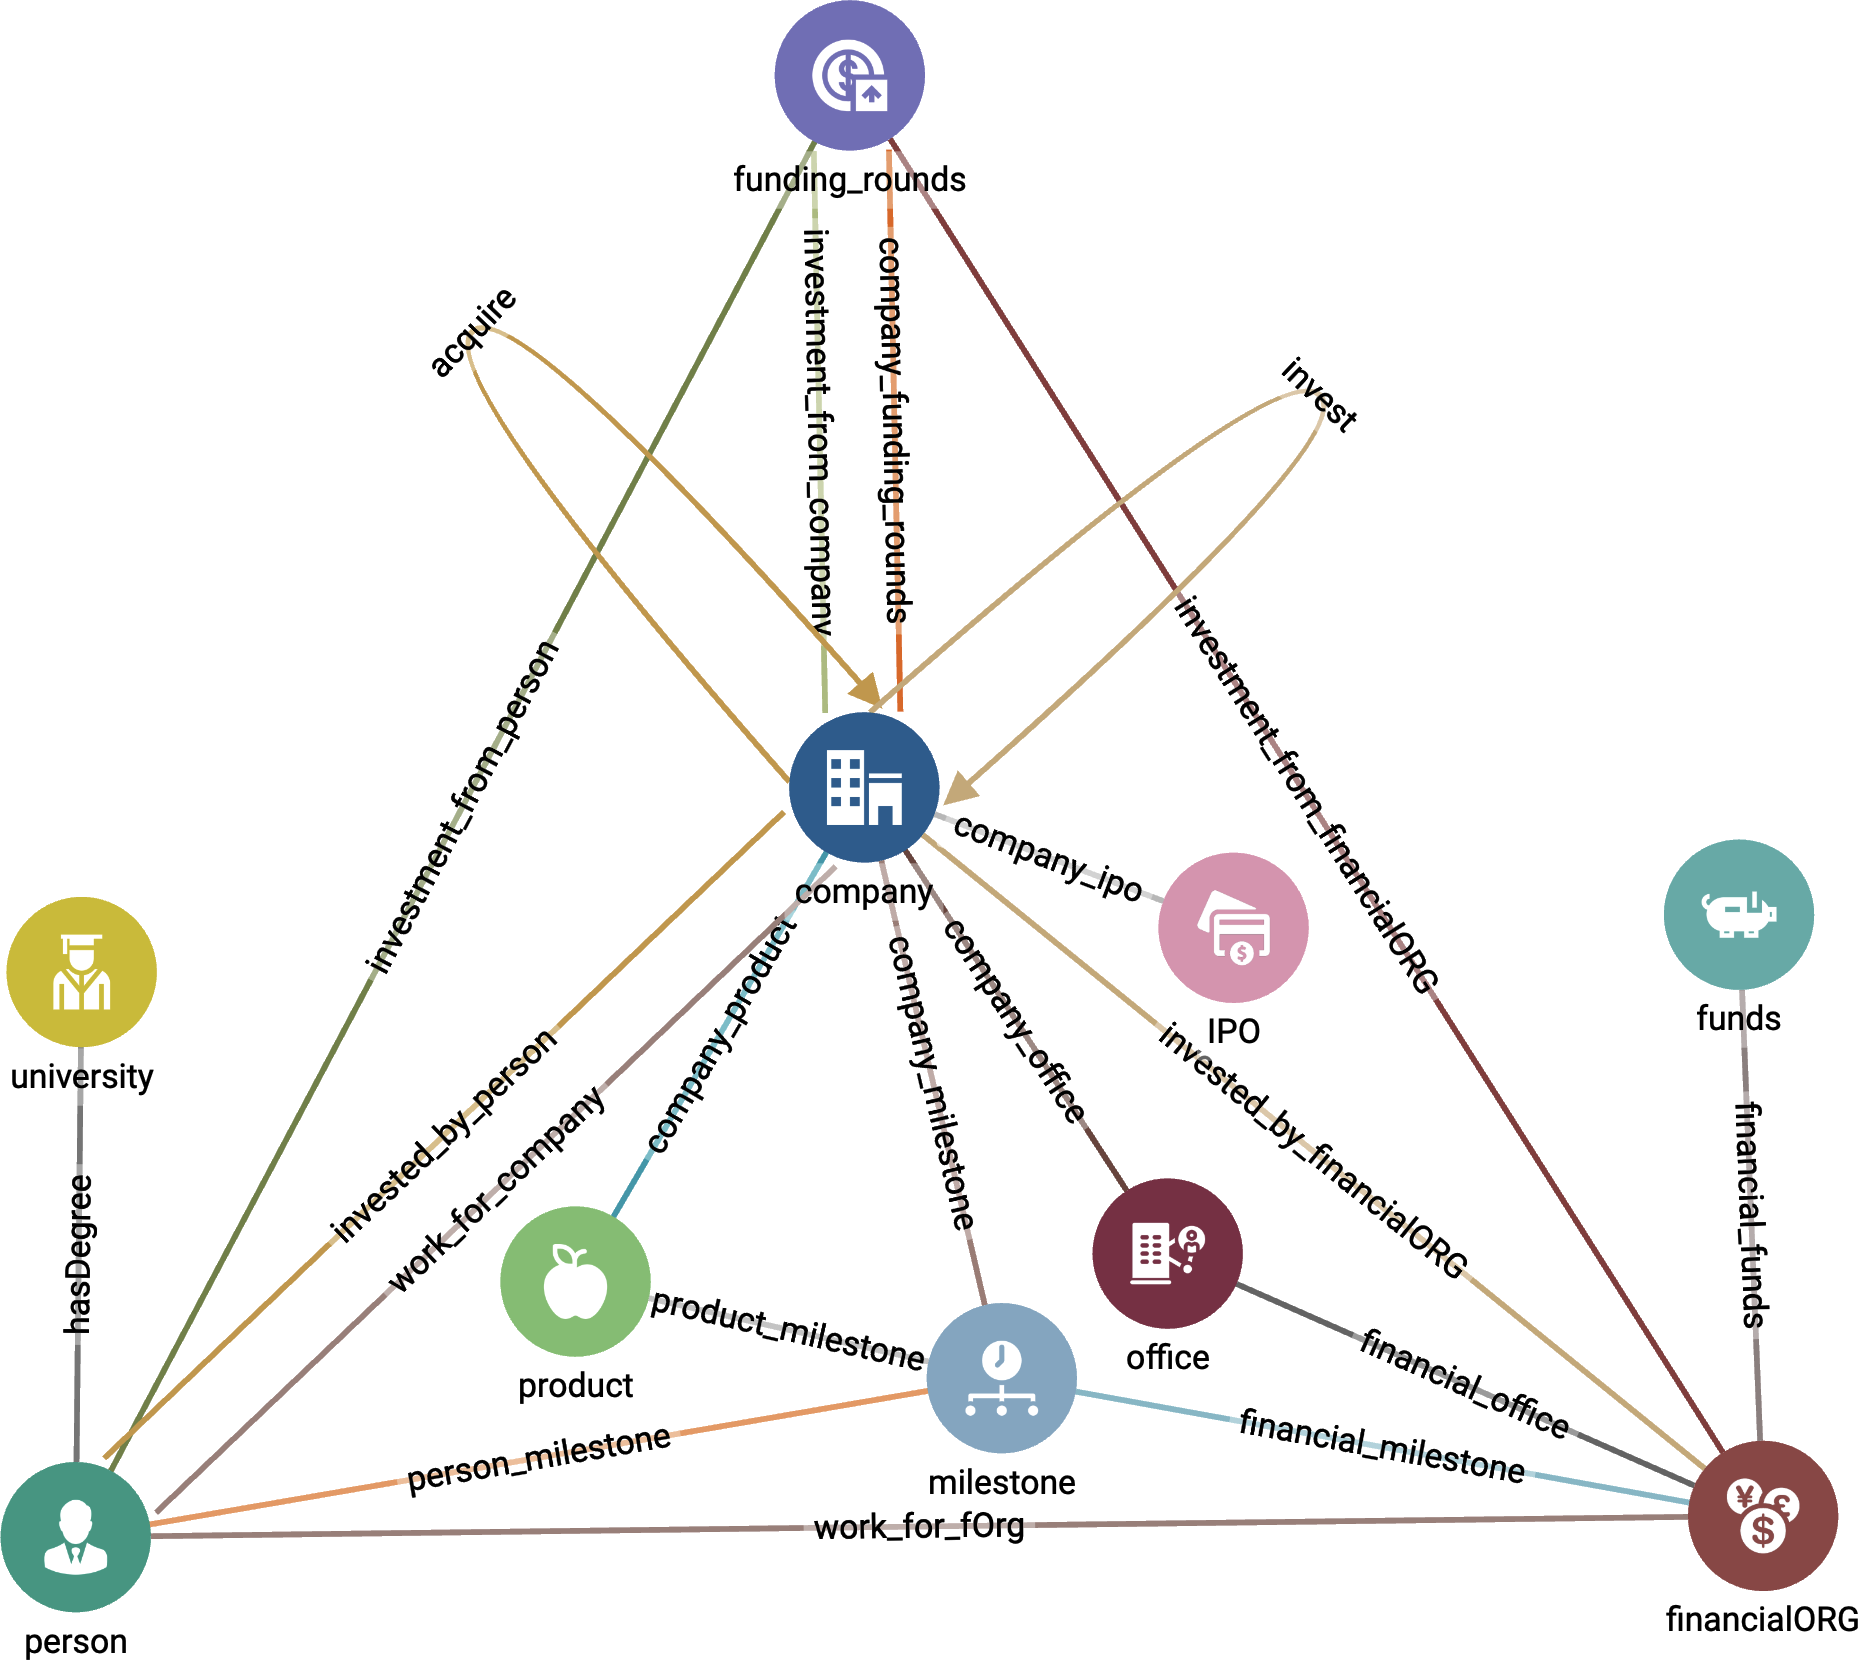
Figure 4-2. Graph schema for Enterprise Knowledge Graph (Crunchbase) (see a larger version of this figure at https://oreil.ly/gpam0402)
Furthermore, there are two types of self edges. A Company can acquire another Company, and a Company can also invest in another Company. A Person type vertex, on the other hand, does not have self edges, which means that a social connection always goes through another vertex type such as University, Financial_Org, Funding_Rounds, or Company. For example, if a Person works for a company, this type of relationship is indicated with the edge type work_for_company.
In Table 4-1, we describe the 10 vertex types in the starter kit. From the description, we can see that Company vertices have potential relationships with many other vertex types. Some of them even have multiple relationship types that connect to Company. For example, a Person can invest in a Company, but it can also work for a Company.
Queries and Analytics
Let’s look at the queries in the Enterprise Knowledge Graph (Crunchbase) Starter Kit. There are four queries in this starter kit. Each query is designed to answer questions that a potential investor or employer might ask.
- Key role discovery
- This query finds all the persons with a key role at a given
Companyand its parent companies. A key role for aPersonis defined as serving as a founder, CEO, CTO, director, or executive for theCompanywhere they work. - Investor successful exits
- Given a certain investor, this query finds the startups that had a successful exit within a certain number of years after the investor invested. A successful exit is when a company has an IPO or is acquired by another company. The visual output of the query is the subgraph of the given investor with all its relationships with
IPOand acquiringCompanyelements. An investor could be any element of typePerson,Financial_Org, orCompany. - Top startups based on board
- This query ranks startups based on the number of times that a current board member working for a top investment firm (
Financial_Org) was also a board member of a previous startup that had a successful exit. Investment firms are ranked by the amount of funds they invested in the past N years. Board members are scored according to their number of successful exits. In addition, the query filters output startups that are beyond a certain funding-round stage. - Top startups based on leader
- This query ranks startups based on the number of times one of its founders previously worked at another
Company, during an early stage of that company, which then went on to have a successful exit. The search is filtered to look only at a given industry sector.
Key role discovery
The key_role_discovery query has two arguments. The first argument, company_name, is our target Company for which we want to find the persons who played key roles either there or at a parent company. The second argument, k, determines how many hops from our starting company_name we will search for parent companies. This query fits very naturally with a graph model because of the k hops parameter. Figure 4-3 shows part of the graph traversal for two hops. Starting from company Com A, we could find connections to a parent company Com B and two key persons, Ben and Adam. We then look to see if Com B has key persons or has another parent company.
We’ll now walk you through the GSQL implementation. In your starter kit, look for the query called key_role_discovery. Select it so you can see the code.
First, we declare some accumulators3 in which to gather our output objects, @@output_vertices and @@output_edges. We also declare visited to mark vertices that the query has encountered already, to avoid double-counting or searching in circles. In this dataset, if a time variable does not have a genuine value, it is set to code 0, which translates to January 1, 1970. We declare TNULL as a more descriptive name for this situation:
    OrAccum @visited;
    SetAccum<VERTEX> @@output_vertices;
    SetAccum<EDGE> @@output_edges;
    DATETIME TNULL = to_datetime("1970-01-01 00:00:00");
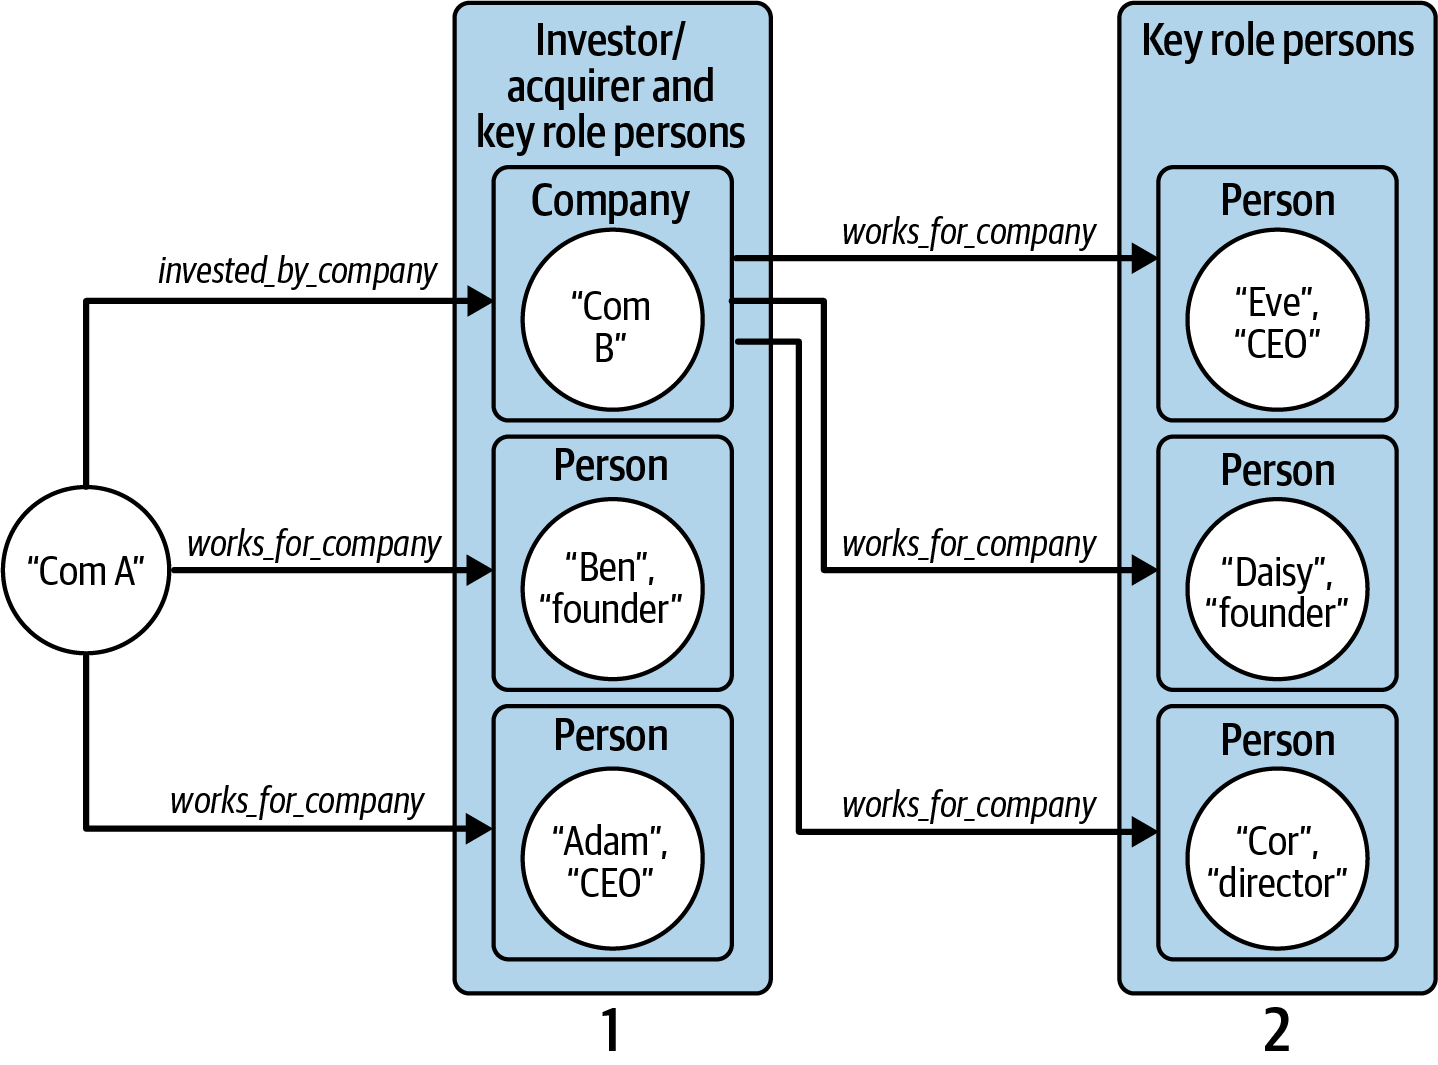
Figure 4-3. Graph traversal pattern to find employees who have a key role at a company and its parent companies
Next, we select all the company elements whose name attribute matches the input parameter company_name. The functions lower(trim()) remove any leading or trailing blank spaces and convert all the letters to lowercase so that differences in capitalization won’t matter. Each vertex whose name matches is added to the @@output_vertices set and is also marked as @visited:
    Linked_companies (ANY) = SELECT tgt
        FROM Company:tgt
        WHERE lower(trim(tgt.name)) == lower(trim(company_name))
        ACCUM @@output_vertices += tgt
        POST-ACCUM tgt.@visited = TRUE;
Now, we start a WHILE loop to look for key persons and parent companies up to k levels deep. At each iteration, we select all Company elements that have an invested_by_company, acquired_by, or work_for_company edge to a Company or Person. This is a good example of the importance of selecting descriptive names for your vertices and edges:
    WHILE TRUE LIMIT k DO
        Linked_companies = SELECT tgt
            FROM Linked_companies:s
                - ((invested_by_company> | acquired_by> | work_for_company):e)
                - (Company | Person):tgt
There is more to this SELECT block. Its WHERE clause performs additional filtering of the selected companies and persons. First, to make sure we are traversing company-to-person edges in the correct direction, we require that the source vertex (using the alias s) is a company. We also require that we haven’t visited the target vertex before (NOT tgt.@visited). Then, if the edge type is work_for_company, the job title must contain “founder,” “CEO,” “CTO,” “[b]oard [of] directors,” or “[e]xecutive”:
            WHERE s.type == "Company" AND tgt.@visited == FALSE AND
              (e.type == "work_for_company" AND
                (e.title LIKE "%founder%" OR e.title LIKE "%Founder%" OR
                 e.title LIKE "%CEO%" OR e.title LIKE "% ceo%" OR
                 e.title LIKE "%CTO%" OR e.title LIKE "% cto%" OR
                 ((e.title LIKE "%oard%irectors%" OR e.title LIKE "%xecutive%")
                   AND datetime_diff(e.end_at, TNULL) == 0))
                ) OR
                 e.type != "work_for_company"
We then add the selected vertices and edges to our accumulators @@output_vertices and @@output_edges, and we mark the vertices as visited.
Finally, we display the selected companies and persons with their interconnecting edges, both graphically and as JSON data. The line Results = {@@output_vertices} creates a vertex set from a SetAccum<VERTEX>. If we printed @@output_vertex directly, we would see only the vertices’ IDs. Printing a vertex set like Results will display all of the vertices’ properties:
IF @@output_vertices.size() != 0 THEN
    Results = {@@output_vertices}; // conversion to output more that just id
    PRINT Results;
    PRINT @@output_edges;
ELSE
    PRINT "No parties with key relations to the company found within ", k,
        " steps" AS msg;
GSQL: Printing Vertices
For efficiency, accumulators containing vertices store only their IDs. To print vertex properties, copy the accumulator into a regular vertex set and print the vertex set.
In Figure 4-4, we show the output when company_name = LuckyCal and k = 3. While the name of the company in the center is missing, we can see that it is Facebook, based on the list of founders, including Mark Zuckerberg.
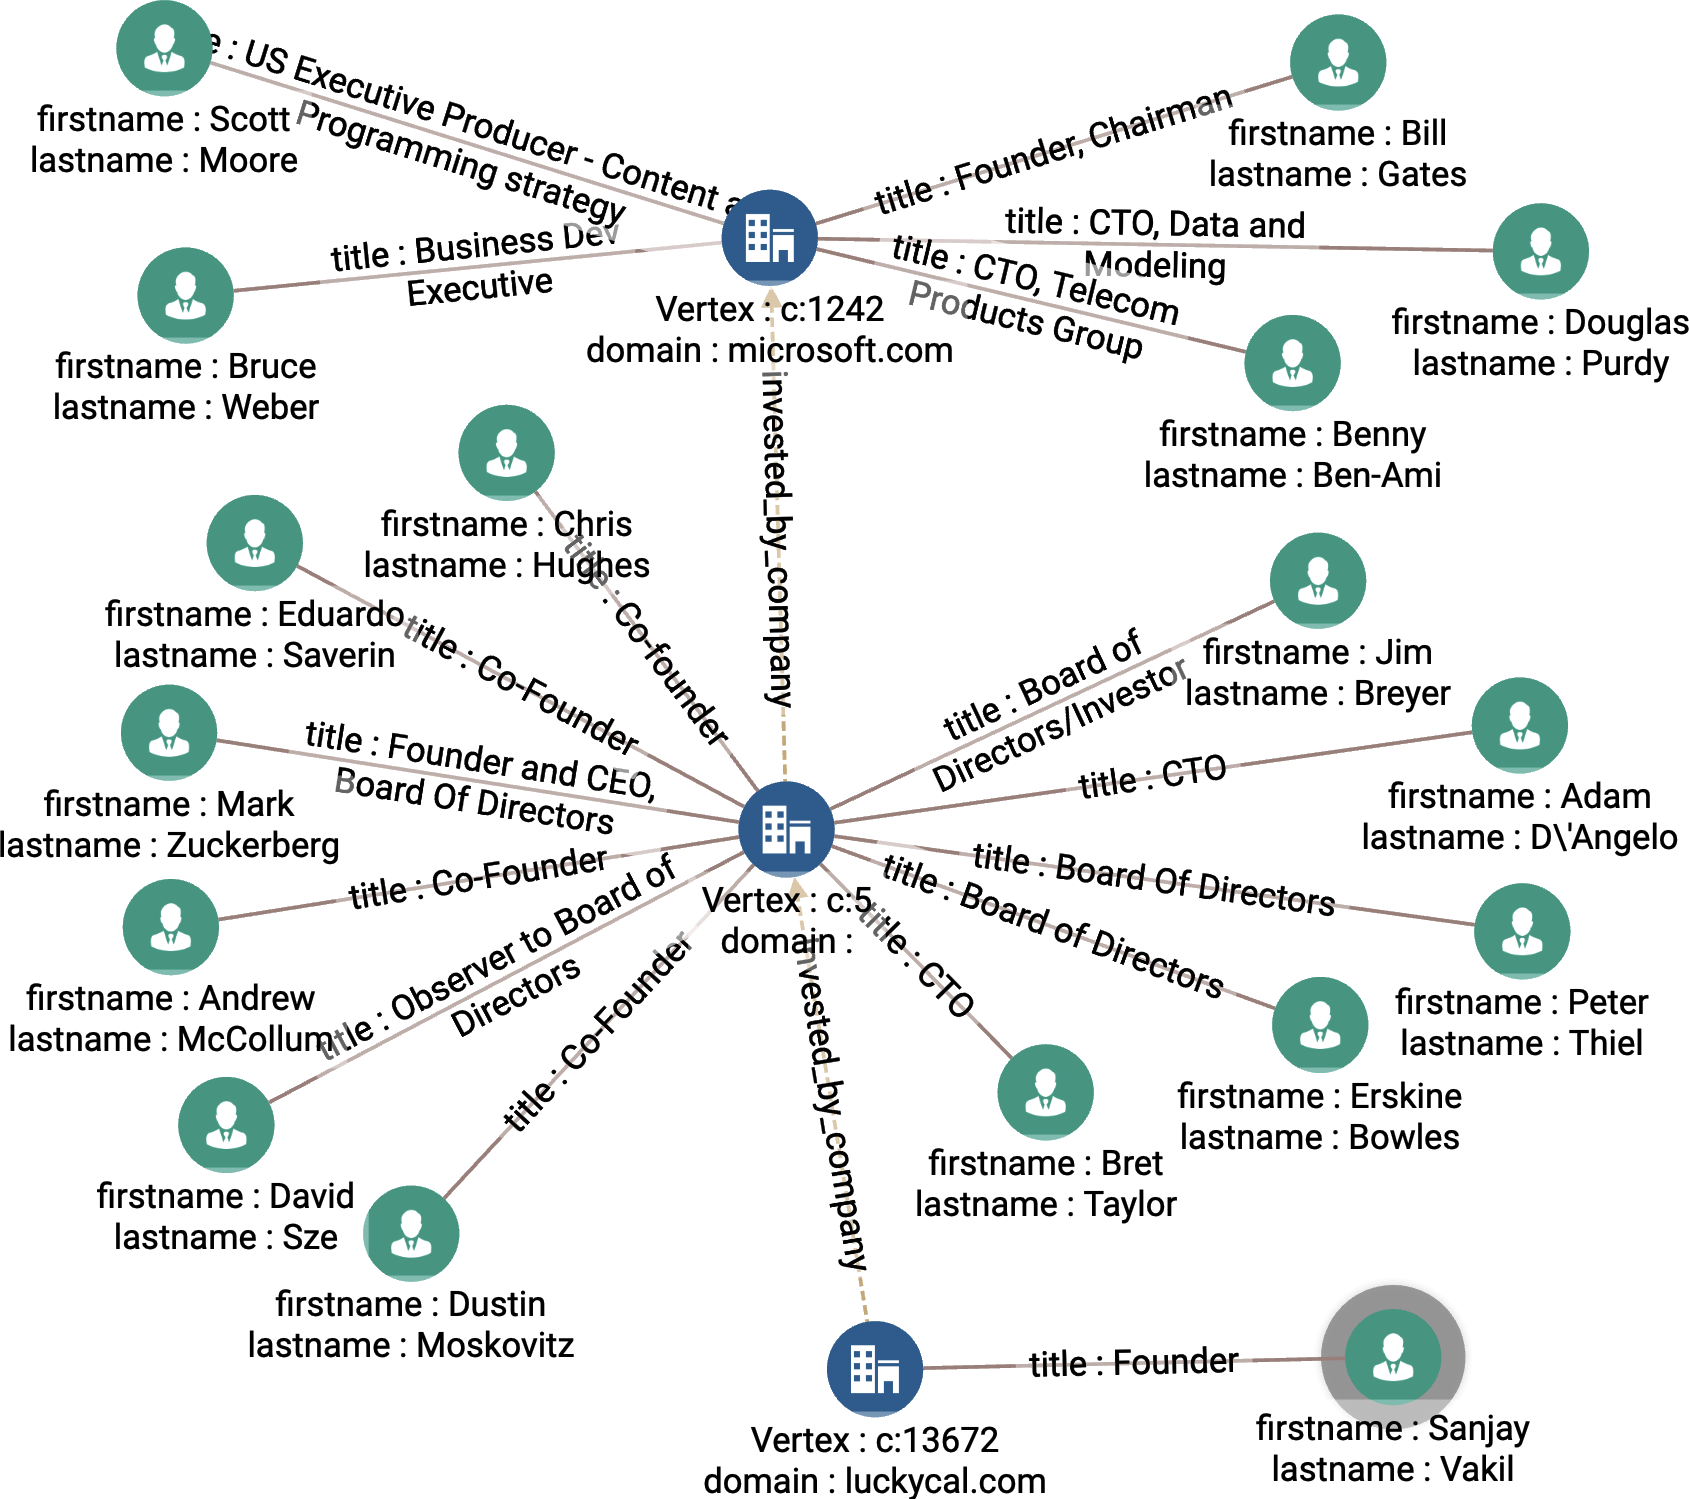
Figure 4-4. Key role discovery when company_name = LuckyCal and k = 3 (see a larger version of this figure at https://oreil.ly/gpam0404)
Investor successful exits
The investor_successful_exits query finds the achievement of a given investor, where achievement is measured by the number of investments that lead to IPOs and acquisitions. It takes three arguments. investor_name is the name of our target investor of whom we want to know the achievements, and investor_type is the type of investor, which could be Company, Person, or Financial_Org. We use year to test if an exit occurred soon enough after the funding. We can answer this query by using the following graph traversal pattern as illustrated in Figure 4-5. Start from the selected investor vertex (investor_name):
-
Hop to the funding rounds the investor participated in.
-
Hop to the companies funded by these rounds.
-
Hop to the exit events (
acquired_byorcompany_ipoedges).
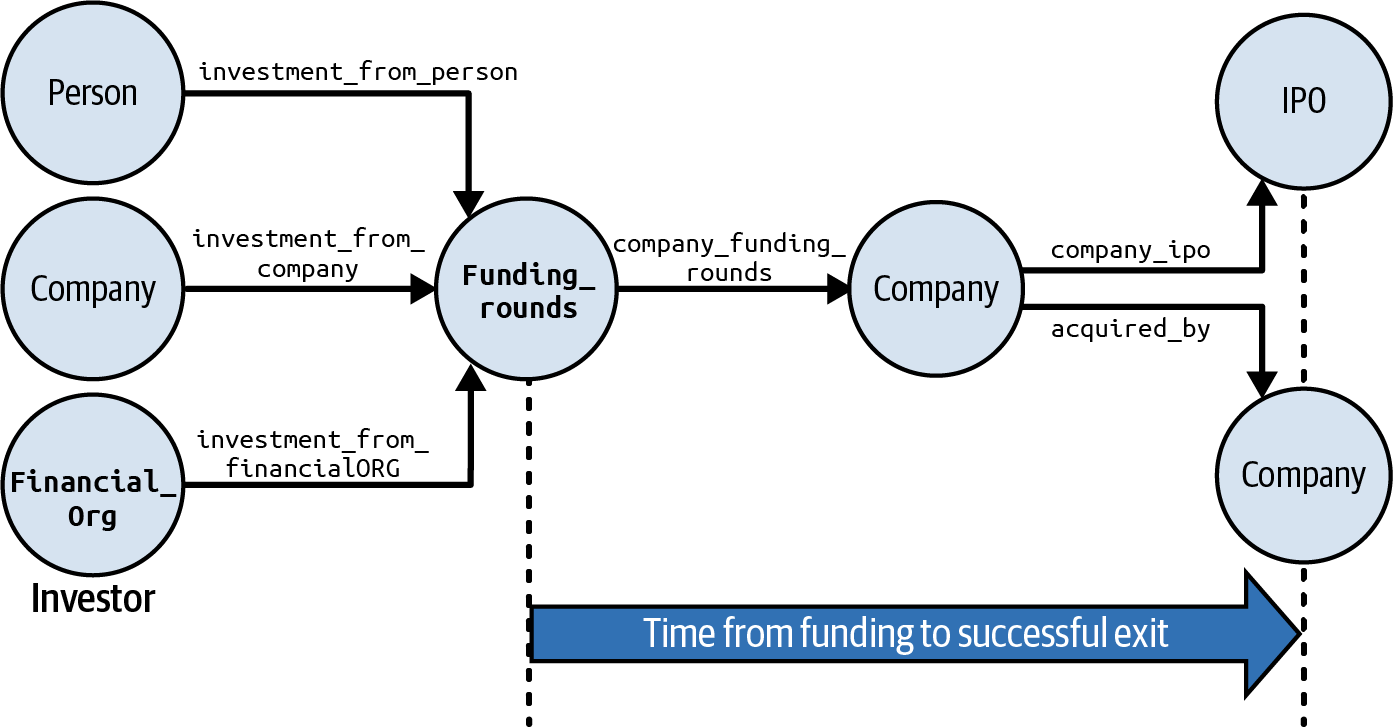
Figure 4-5. Graph traversal pattern to find investors with successful exits (see a larger version of this figure at https://oreil.ly/gpam0405)
We’ll walk you through key parts of the GSQL code for the investor_successful_exits query.
We start by declaring several variables. We want to show the paths from investor to successful exits. As we traverse through the graph, @parent_vertex_set and @parent_edge_set act like breadcrumbs. At each newly visited vertex, we use them to record how we got there. After we reach the end, we use these accumulators to find our way back. During the backtrack, we gather all the vertices and edges on these paths into the global accumulators @@result_vertex_set and @@result_edge_set:
    SetAccum<VERTEX> @parent_vertex_set;
    SetAccum<EDGE> @parent_edge_set;
    SetAccum<VERTEX> @@result_vertex_set;
    SetAccum<EDGE> @@result_edge_set;
Next we create the Start set of vertices, using a CASE statement and the investor_type parameter to select the type of investors indicated by the user:
    Start (ANY) = {};
    CASE lower(trim(investor_type))
        WHEN "person"    THEN Start = {Person.*};
        WHEN "company"    THEN Start = {Company.*};
        WHEN "financialorg"  THEN Start = {Financial_Org.*};
    END;
We complete the preliminaries by finding the individual investor who has investor_name. If the investor is a Person, we check the attribute called fullname; otherwise, we check the attribute called name:
     Investor (ANY) = SELECT inv
        FROM Start:inv
        WHERE ( inv.type == "Person"
              AND lower(trim(inv.fullname)) == lower(trim(investor_name))
         ) OR lower(trim(inv.name)) == lower(trim(investor_name));
Now we begin our graph hops. First we select all the Funding_Rounds linked to the investor. At each selected Funding_Rounds vertex, we store the identity of the vertex and edge traversed to arrive there. The target vertices of this hop are stored in a variable called Funding_rounds:
    Funding_rounds = SELECT tgt
        FROM Investor:s - ((investment_from_company | investment_from_person |
            investment_from_financialORG):e) - Funding_Rounds:tgt
        ACCUM
            tgt.@parent_vertex_set += s,
            tgt.@parent_edge_set += e;
Now we take another hop from the selected funding rounds to the companies they funded. An investor can invest in a company at more than one funding round. For example, in Figure 4-6, we see that Ted Leonsis invested in Revolution Money in both rounds B and C. An investor’s success should be judged from the time of their first investment. Each Funding_Rounds vertex sends its funded_at parameter value to a MinAccum @min_invested_time, which remembers the minimum value that it is given:
    Invested_companies = SELECT tgt
        FROM Funding_rounds:s - ((company_funding_rounds):e) - Company:tgt
        ACCUM
            tgt.@parent_vertex_set += s,
            tgt.@parent_edge_set += e,
            tgt.@min_invested_time += s.funded_at;
Finally, for each company that received investment funding, we look to see if it had a successful exit within the required time window. A company_ipo or acquired_by edge indicates an exit. If it was an IPO, we check that the IPO date (the public_at attribute) is later than the investment date but not more than the value of years later. An analogous check is performed on the acquired_at attribute if it was an acquisition event:
    IPO_acquired_companies = SELECT tgt
        FROM Invested_companies:s - ((company_ipo | acquired_by>):e) -:tgt
        ACCUM
            tgt.@parent_vertex_set += s,
            tgt.@parent_edge_set += e,
            // See if IPO occurred within `years` after Investor's investment
            IF (e.type == "company_ipo"
                AND datetime_diff(tgt.public_at, s.@min_invested_time) > 0
                AND datetime_diff(
                tgt.public_at, s.@min_invested_time) <= years * SECS_PER_YR)
            // See if Acquisition occurred within `years` of investment
            OR (e.type == "acquired_by"
                AND datetime_diff(e.acquired_at, s.@min_invested_time) > 0
                AND datetime_diff(
                e.acquired_at, s.@min_invested_time) <= years * SECS_PER_YR)
            THEN @@result_vertex_set += tgt
            END;
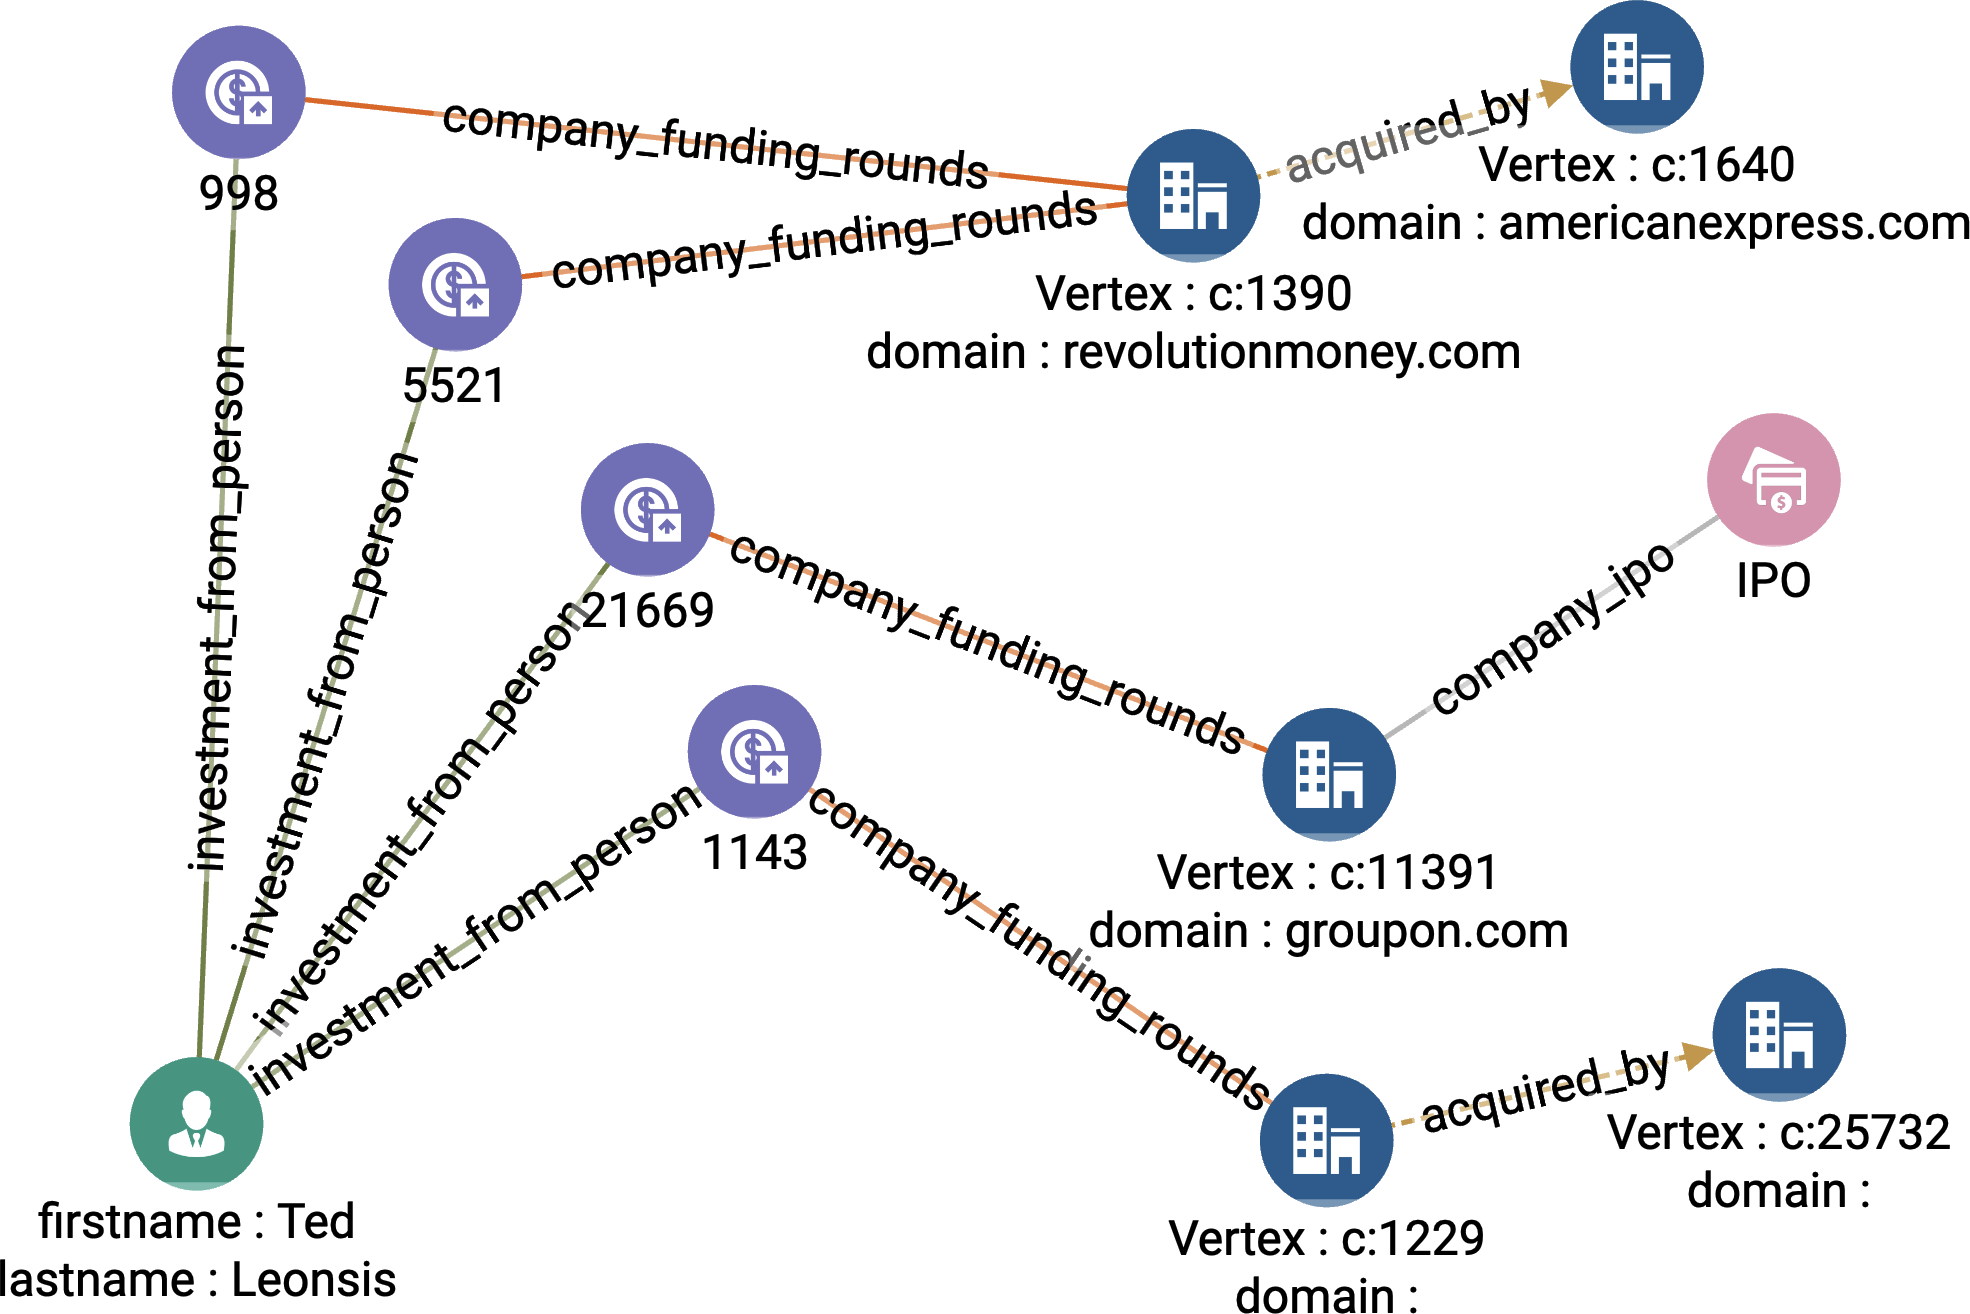
Figure 4-6. Investor successful exits when investor_name = Ted Leonsis and years = 3 (see a larger version of this figure at https://oreil.ly/gpam0406)
If we only wanted to know how many successful exits our investor had, or the company details of those exits, we would be done. However, it’s interesting to graphically show the paths from investor → funding → company → exit, as in Figure 4-6. To gather that information, we traverse from the exit vertices backward to the investor, using the breadcrumbs (@parent_vertex_set and @parent_edge_set) that we set previously:
    Children = {@@result_vertex_set};
    PRINT Children.size() as Num_Successful_Exits;
    WHILE(Children.size() > 0) DO
        Start = SELECT s
            FROM Children:s
            ACCUM
                @@parents += s.@parent_vertex_set,
                @@result_edge_set += s.@parent_edge_set;

        @@result_vertex_set += @@parents;
        Children = {@@parents};
        @@parents.clear();
Top startups based on board
The top_startups_based_on_board query adds some complexity by adding in two forms of ranking: top-performing investment companies and top-performing leaders at those investment companies. It starts by identifying the Financial_Org entities that have invested the most money in recent years. Then, we rank Persons at those organizations according to the number of times they were on the board of a startup Company and guided it to a successful exit. Then, we display any pre-exit Companies that currently have one of these successful executives as a board member.
The top_startups_based_on_board query has four input parameters:
k_orgs- The number of top financial institutions we want to include in our selection scope
num_persons- The number of top board members to select
max_funding_round- Filters the final list of promising startups to exclude those that have received investment funding at a later stage than
max_funding_round past_n_years- Sets the time window for money invested by
Financial_Org
We can implement this query according to the following steps, most of which correspond to a graph hop; these steps are illustrated in Figure 4-7:
-
Compute how much
Funding_Roundsinvestment eachFinancial_Orgmade in the past N years [Hop 1]. -
Rank the
Financial_Orgby the investment amount and take the topk_orgs. -
Find
Personswho work for a top kFinancial_Org(from step 2) [Hop 2]. -
Find companies at which those
Persons(from step 3) served as board members [Hop 3]. -
Rank those
Persons(from step 3) by the number of times they were on the board of aCompany(from step 4) before its successful exit [Hop 4]. -
Find pre-exit
Companyvertices that have a top board memberPerson(from step 5). Filter these companies by the funding round cutoff [Hop 5].
This query declares several accumulators and other variables to assist with this computation. There are also two interesting data preparation steps. One stores some currency exchange rates in a lookup table. Another makes a list of all the funding round codes @@allowed_funding_rounds up to our max_cutoff_round.
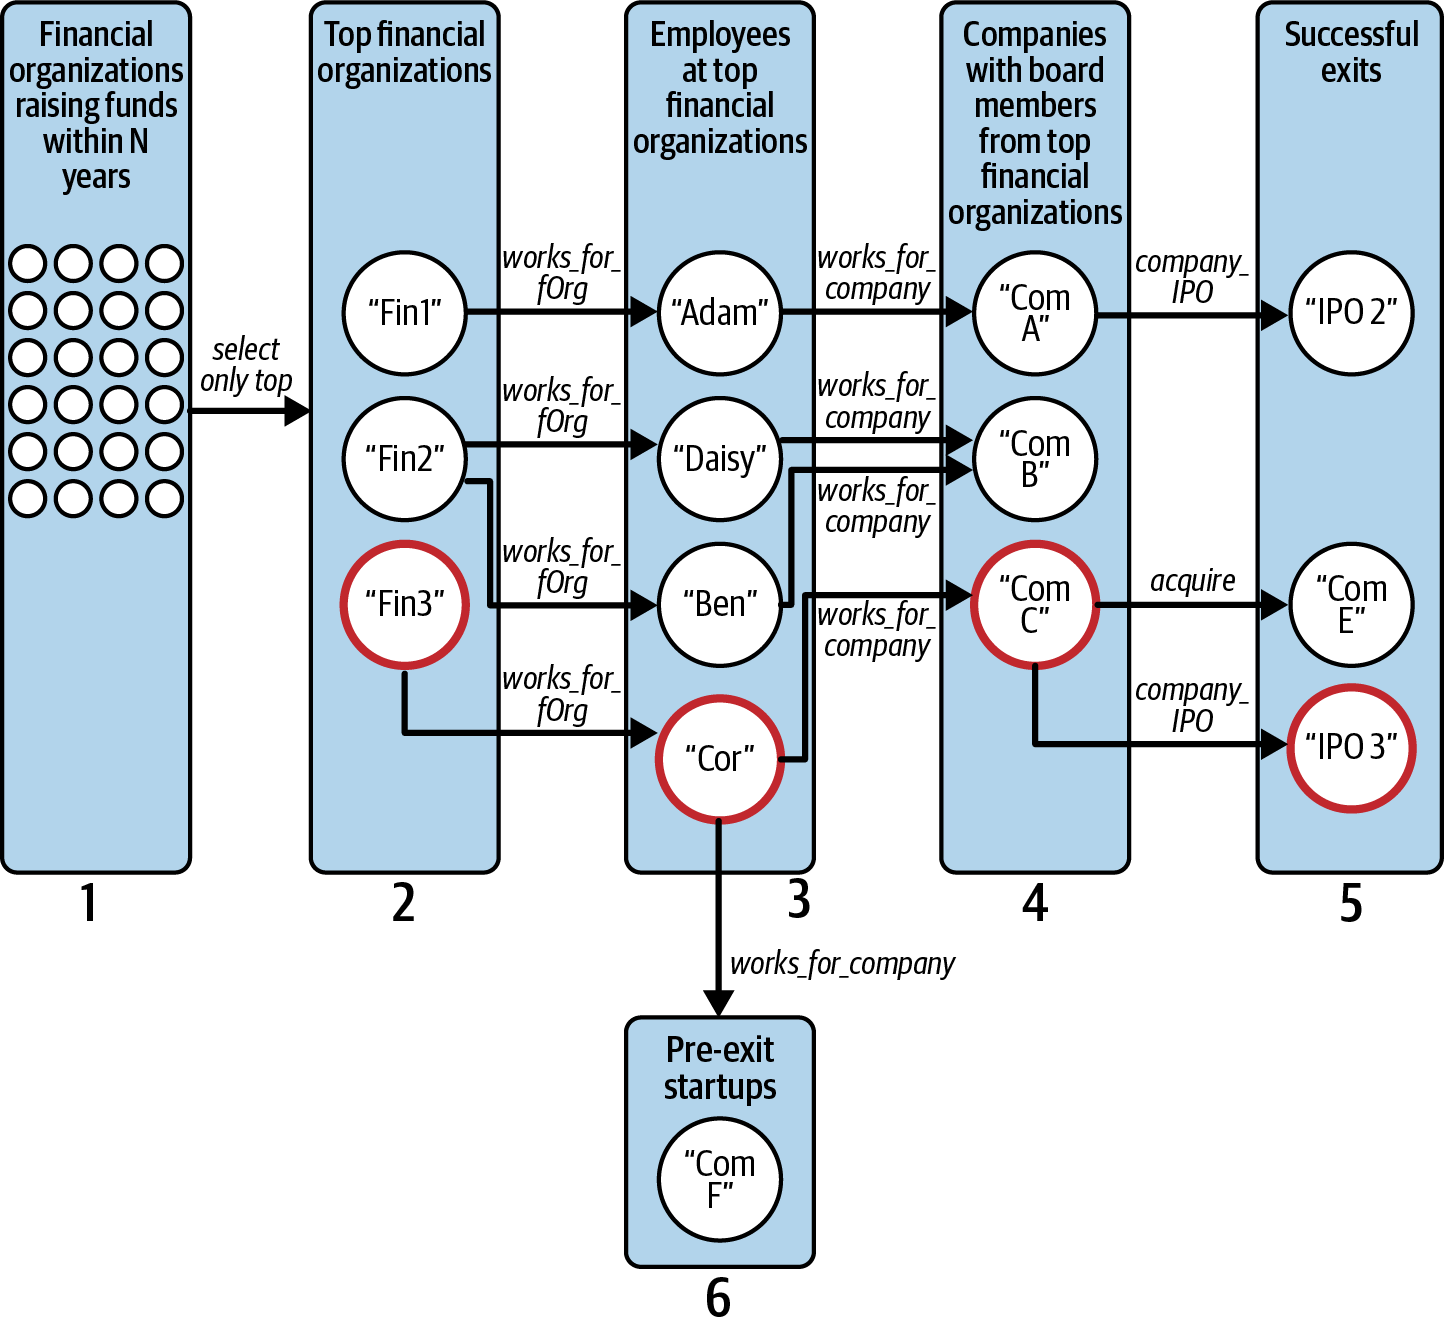
Figure 4-7. Graph traversal pattern to find promising startups based on successful board members from top financial organizations
Our first graph hop is also a data preparation step. Our Crunchbase graph schema stores the IPO or acquisition date of a company on an edge. Copy that data so that it is also available with the companies themselves:
    Comp = SELECT c
        FROM (Company):c - ((company_ipo|acquired_by>):e) - (IPO|Company):x
        ACCUM
            CASE WHEN
              e.type == "company_ipo" AND datetime_diff(x.public_at, T0) != 0
            THEN
              c.@t_exit += x.public_at
            END,
            CASE WHEN
              e.type == "acquired_by" AND datetime_diff(e.acquired_at,T0) != 0
            THEN
              c.@t_exit += e.acquired_at
            END;
In the next hop, we connect Financial_Org vertices with their investment Funds in order to tally the investments of the past_n_years and then take the top k organizations. The WHERE clause filters for the desired time range. To take the top k, GSQL offers ORDER BY and LIMIT clauses, just as in SQL:
    Top_orgs = SELECT org
        FROM (Financial_Org):org - (financial_funds:e) - Funds:f
        WHERE datetime_diff(END_2013, f.funded_at) <= past_n_years*SECS_PER_YR
        ACCUM org.@amount +=
            (f.raised_amount / @@currency2USD.get(f.raised_currency_code)),
            f.@visited = TRUE
        ORDER BY org.@amount DESC
        LIMIT k_orgs;
Advanced GSQL users may sometimes choose to use HeapAccum instead of ORDER BY/LIMIT because sorting a small heap takes less computer memory than the global sort that ORDER BY performs.
Next, we select all employees (Person who work_for_fOrg) at these top financial organizations (the Top_org vertex set from the previous step):
  Persons_at_top_orgs = SELECT p
      FROM Top_orgs:o - (work_for_fOrg:e) - Person:p;
From these Persons_at_top_orgs, we want to select the ones that satisfied the following criteria for helping to lead a successful exit:
-
Their job title included “Board.”
-
The company has had an exit (
c.@t_exit.size() != 0). -
The person has a valid work start date (
datetime_diff(w.start_at, T0) != 0). -
The company’s exit occurred after the board member joined.
The following code performs that selection:
    Top_board_members = SELECT p
        FROM Persons_at_top_orgs:p - (work_for_company:w) - Company:c
        WHERE (w.title LIKE "%Board%" OR w.title LIKE "%board%")
            AND c.@t_exit.size() != 0 AND datetime_diff(w.start_at, T0) != 0
            AND datetime_diff(c.@t_exit.get(0), w.start_at) > 0
After finding these successful startup board members, we build a list of these successful startup companies (@@comp_set). We also have each such Company record its key board member (c@board_set), and we tally the successful exits of each key person (p.@amount += 1). Finally, we take the most prolific board members (ORDER BY and LIMIT):
        ACCUM
            @@comp_set += c,
            c.@board_set += p,
            p.@amount += 1
        ORDER BY p.@amount DESC
        LIMIT num_persons;
Then we find all pre-exit Company entities that have a top_board_member:
    Top_startups = SELECT c
        FROM Top_board_members:s - (work_for_company:w) - Company:c
        WHERE (w.title LIKE "%Board%" OR w.title LIKE "%board%")
            AND w.start_at != T0
            AND c.status == "operating" AND c.@t_exit.size() == 0;
Finally, we include only those pre-exit companies whose Funding_Rounds have been early enough to satisfy the max_cutoff_round limit:
    Top_early_startups = SELECT r
        FROM Top_startups:s - (company_funding_rounds:e) - Funding_Rounds:r
        ACCUM
            s.@visited += TRUE,
            IF @allowed_funding_rounds.contains(r.funding_round_code) THEN
                r.@visited = TRUE
            ELSE
                s.@early += FALSE
            END;
The remainder of the query is used to trace back from the top board members to display the companies they worked for and their successful exits.
Figure 4-8 shows the results when we set k_orgs = 10, num_persons = 2, max_funding_round = b, and past_n_years = 10. The two key board members are Jim Goetz and Jim Breyer, who both work for Accel Partners. Goetz has had four successful exits, while Breyer has had three. The recommended startups are companies linked to Goetz or Breyer that don’t yet have an exit: Nimble Storage, Ruckus Wireless, HubSpot, Booyah, and Etsy.4
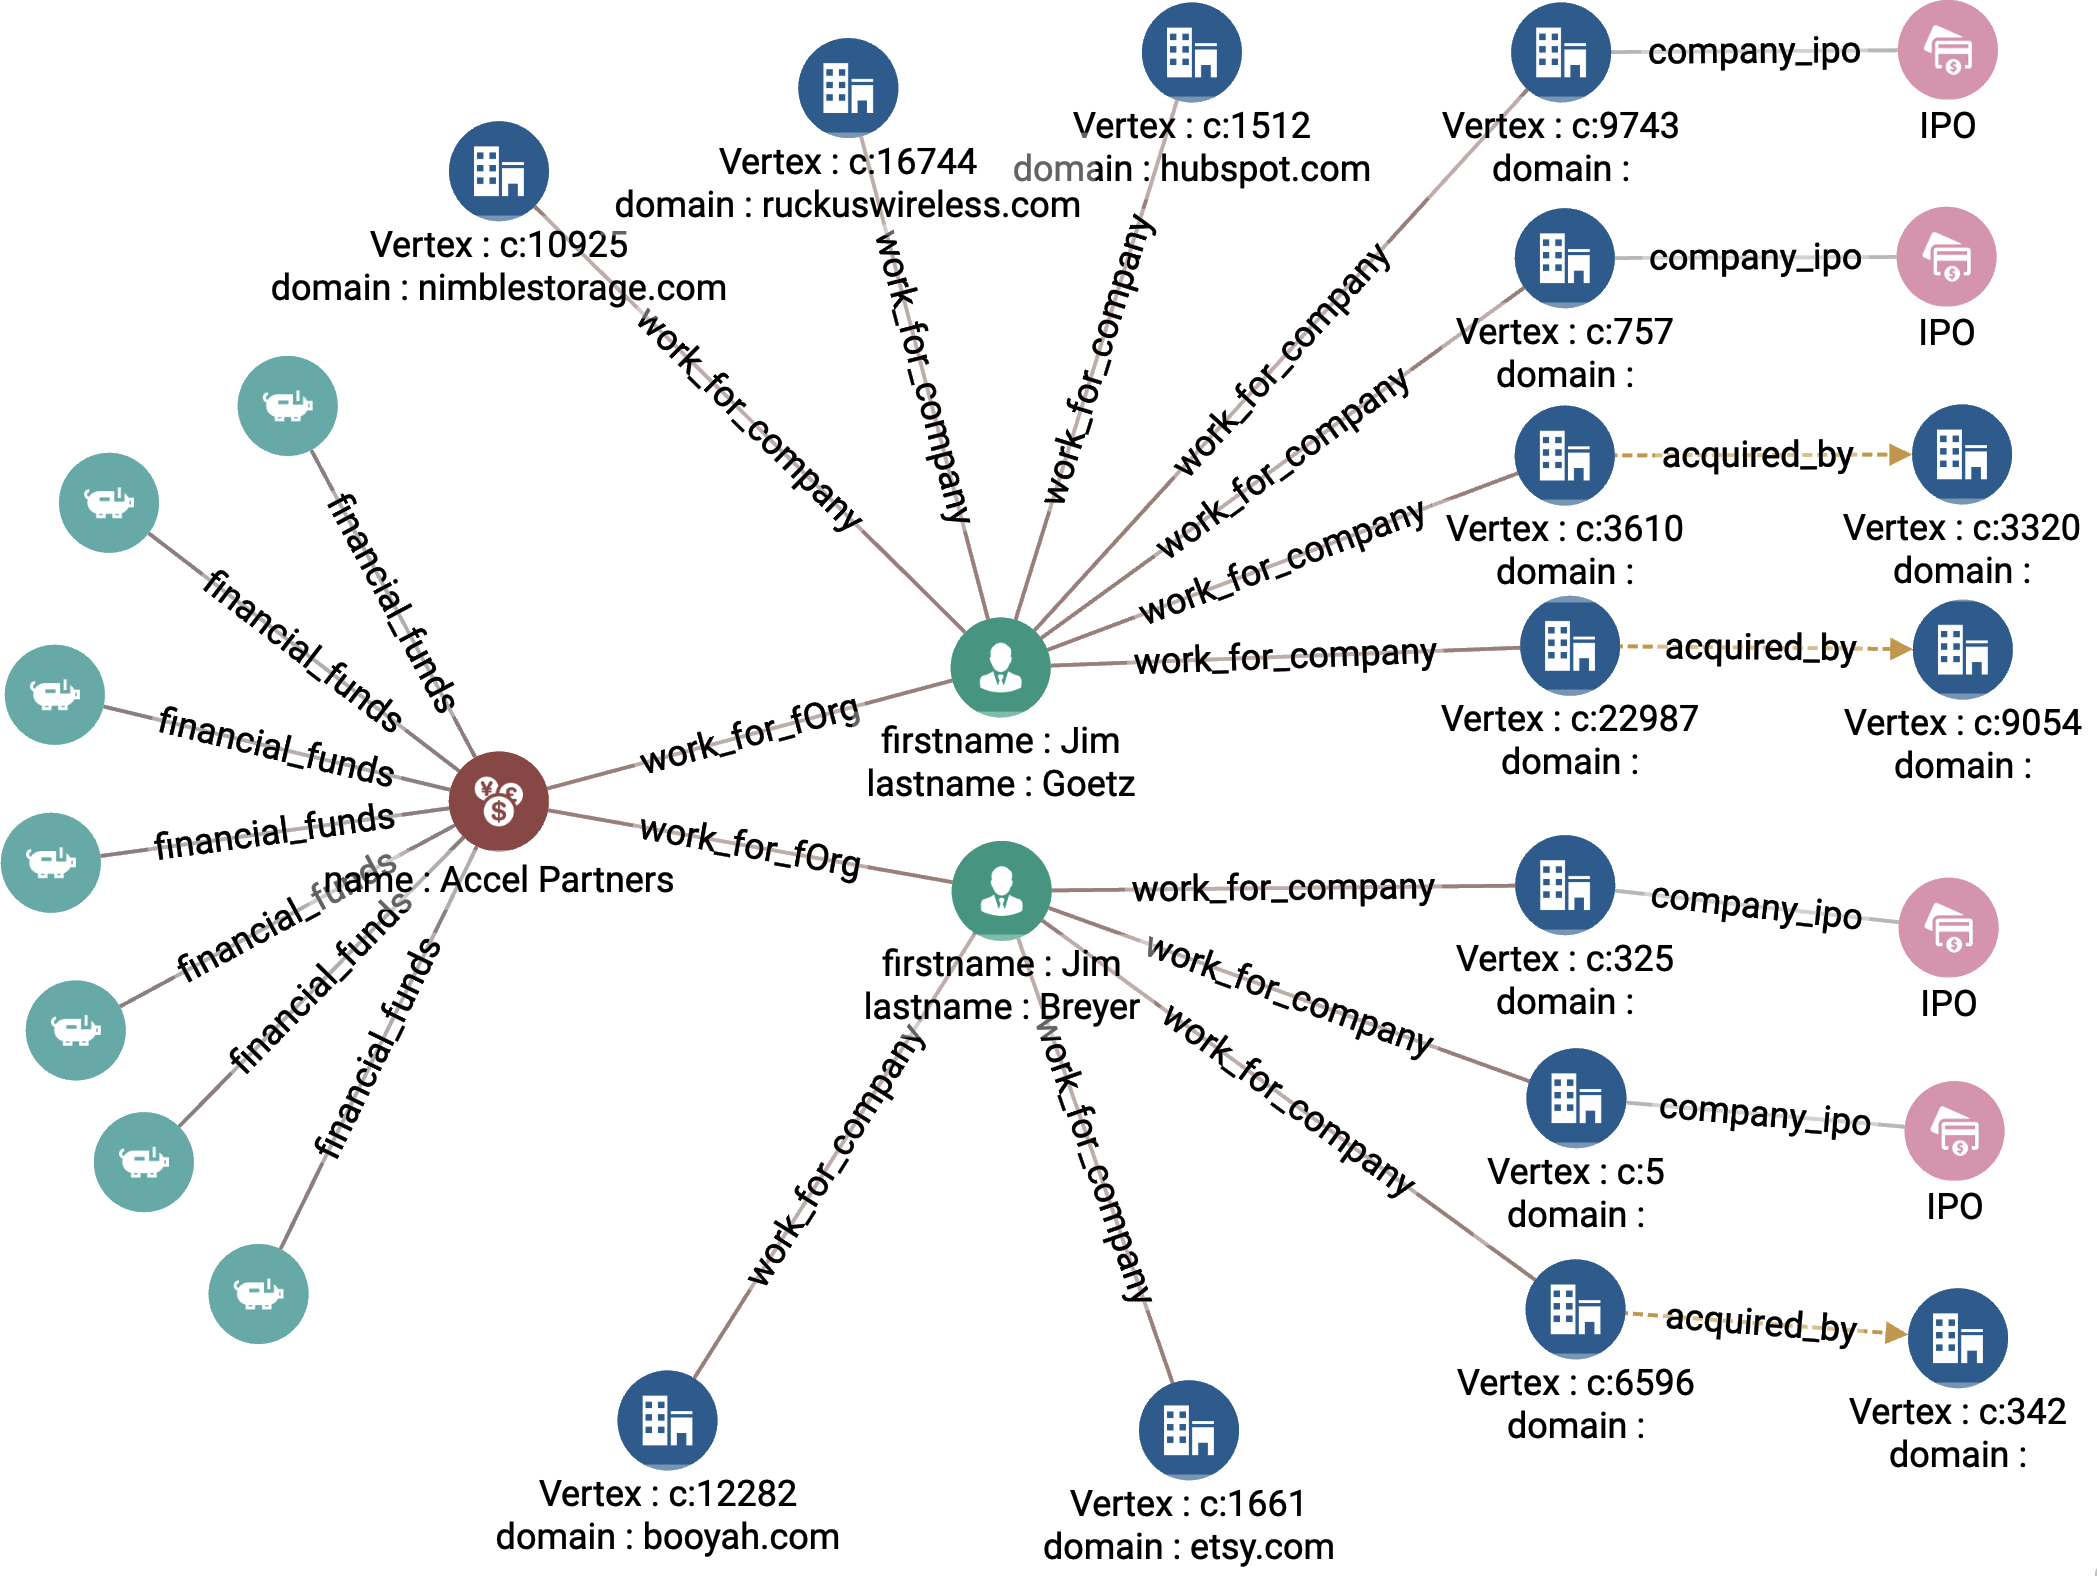
Figure 4-8. Graph output for top startups based on board members (see a larger version of this figure at https://oreil.ly/gpam0408)
Top startups based on leader
Our last query in this starter kit is similar to the previous one, except that rather than looking for top board members, we are looking for founders. This query takes three arguments. max_funding_round is the funding round cutoff, meaning that we only select startups whose investment rounds have been no later than max_funding_round. Argument return_size is the number of top startups we want to retrieve from our query, and sector is the industry sector we want to filter out the result.
Figure 4-9 illustrates how we construct this query as a series of graph hops:
-
Find all companies that have IPOed or been acquired [Hop 1].
-
Find employees who contributed to the companies in step 1 [Hop 2].
-
Find startups whose founder also was a key employee from step 2 [Hop 3]. Filter the startups based on the cutoff round and sector.
-
Find companies whose founders have the most successful connections.
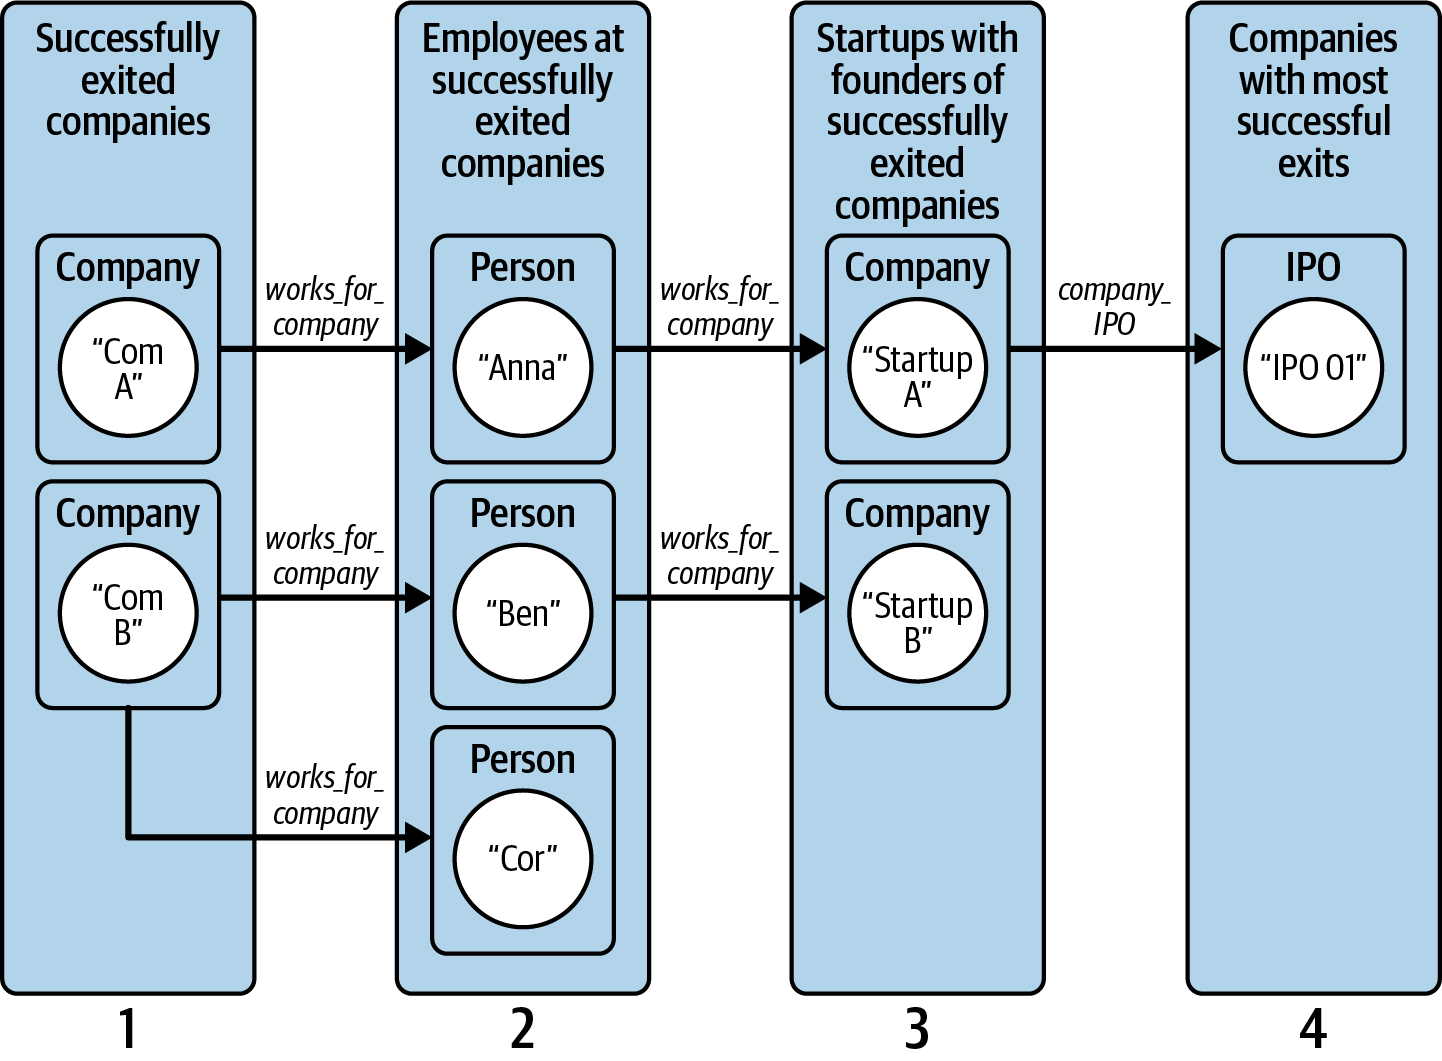
Figure 4-9. Graph traversal pattern to find promising startups based on successful founders
This query introduces some data structures that we haven’t seen before: a TUPIL and a HeapAccum. A GSQL tuple is a user-defined data type composed of a set of basic existing types. A Company_Score tuple consists of a Company vertex followed by an integer. A HeapAccum manages a sorted list of tuples up to a user-specified maximum number of items. Our HeapAccum @@top_companies_heap holds Company_Score tuples sorted by their score values. The heap can contain up to return_size companies:
    TYPEDEF TUPLE<VERTEX<Company> company, INT score> Company_Score;
    HeapAccum<Score_Results>(return_size, score DESC) @@top_companies_heap;
We also define two nested MapAccums. A map is like a lookup table. Looking at the structural definition of @@person_company_leave_date_map, this means that for a given person, we record when that person left a given company. For @@person_company_employment_map, we record the employment relationship between a Person and a Company:
    // Declare map to store when an employee left which company
    MapAccum<VERTEX<Person>,
        MapAccum<VERTEX<Company>, DATETIME>> @@person_company_leave_date_map;
    MapAccum<VERTEX<person>,
        MapAccum<VERTEX<Company>, EDGE>> @@person_company_employment_map;
Now we find all the companies with an IPO or that have been acquired by another company. For clearer code, one code block finds IPO companies, another focuses on acquisitions, and then we merge the two sets of companies. For the IPOs, we traverse from IPO vertices to Company vertices. We check that the IPO has a valid public_at attribute. Once selected, we tag each Company with the path back to the IPO vertex and with the public_at date. We tag the company as no longer in the startup phase:
    IPO_companies = SELECT c
        FROM IPO:i - (company_ipo:e) - Company:c
        //Filter out companies with null acquisition time (not yet acquired)
        WHERE datetime_diff(i.public_at, TNULL) != 0
        ACCUM
            c.@parent_vertex_set += i,
            c.@parent_edge_set += e,
            c.@min_public_date = i.public_at,
            c.@is_still_startup += FALSE;
A similar code block finds the acquired_companies. The edge type is different (acquire instead of company_ipo), and the effective data attribute is different (acquired_at instead of public_at).
We then join the output sets from these two blocks:
IPO_acquired_companies = IPO_companies UNION Acquired_companies;
Next we select all the persons who have worked for a successfully exited company before the exit event. For each such person, we store their relevant information into the nested maps that we described earlier. Notice the -> operator used to specify a map’s key -> value pair:
Startup_employees = SELECT p
     FROM IPO_acquired_companies:c - (work_for_company:e) - Person:p
      WHERE datetime_diff(e.start_at, TNULL) != 0
        AND datetime_diff(e.end_at, TNULL) != 0
        AND datetime_diff(e.start_at, c.@min_public_date) < 0
      ACCUM
            @@person_company_employment_map += (p -> (c -> e)),
            @@person_company_leave_date_map += (p -> (c -> e.end_at));
Now we find the startups where these successful-exit employees are currently a founder, filtered by industry. The checks for the startup status and founder status are performed in the WHERE clause:
    New_startups = SELECT c
        FROM startup_employees :p - (work_for_company :e) - Company :c
        WHERE c.@is_still_startup
            AND c.@early_startup
            AND c.status != "acquired"
            AND c.status != "ipo"
            AND e.title LIKE "%ounder%"
            AND lower(trim(c.category_code)) == lower(trim(sector))
            AND datetime_diff(e.start_at, TNULL) != 0
            AND datetime_diff(e.end_at, TNULL) != 0
After selecting these startups, we tally the founders’ past successes:
        ACCUM
        // Tally the founder:past-success relationships per new company
            FOREACH (past_company, leave_date)
            IN @@person_company_leave_date_map.get(p) DO
                IF datetime_diff(e.start_at, leave_date) > 0 THEN
                    p.@parent_edge_set +=
                      @@person_company_employment_map.get(p).get(past_company),
                    p.@company_list += past_company,
                    c.@parent_vertex_set += p,
                    c.@parent_edge_set += e,
                    c.@sum_ipo_acquire += 1
                END
            END
        HAVING c.@sum_ipo_acquire > 0;
Select companies where the founders have the most relationships with successfully exited companies. We use the HeapAccum we described previously to rank the companies based on the tally of successful exits of its founder(s):
    Top_companies = SELECT c
        FROM Startups_from_employees:c
        ACCUM @@top_score_results_heap += Score_Results(c, c.@sum_ipo_acquire);
    PRINT @@top_score_results_heap;

    FOREACH item IN @@top_score_results_heap DO
        @@output_vertex_set += item.company;
    END;
Figure 4-10 shows the results when the input arguments are max_funding_round = c, return_size = 5, and sector = software. The five selected startups are listed on the right. Looking at the second company from the top, we read from right to left: Packet Trap Networks is selected because founder Steve Goodman was a Founder/CEO of Lasso Logic, which was acquired by SonicWALL.
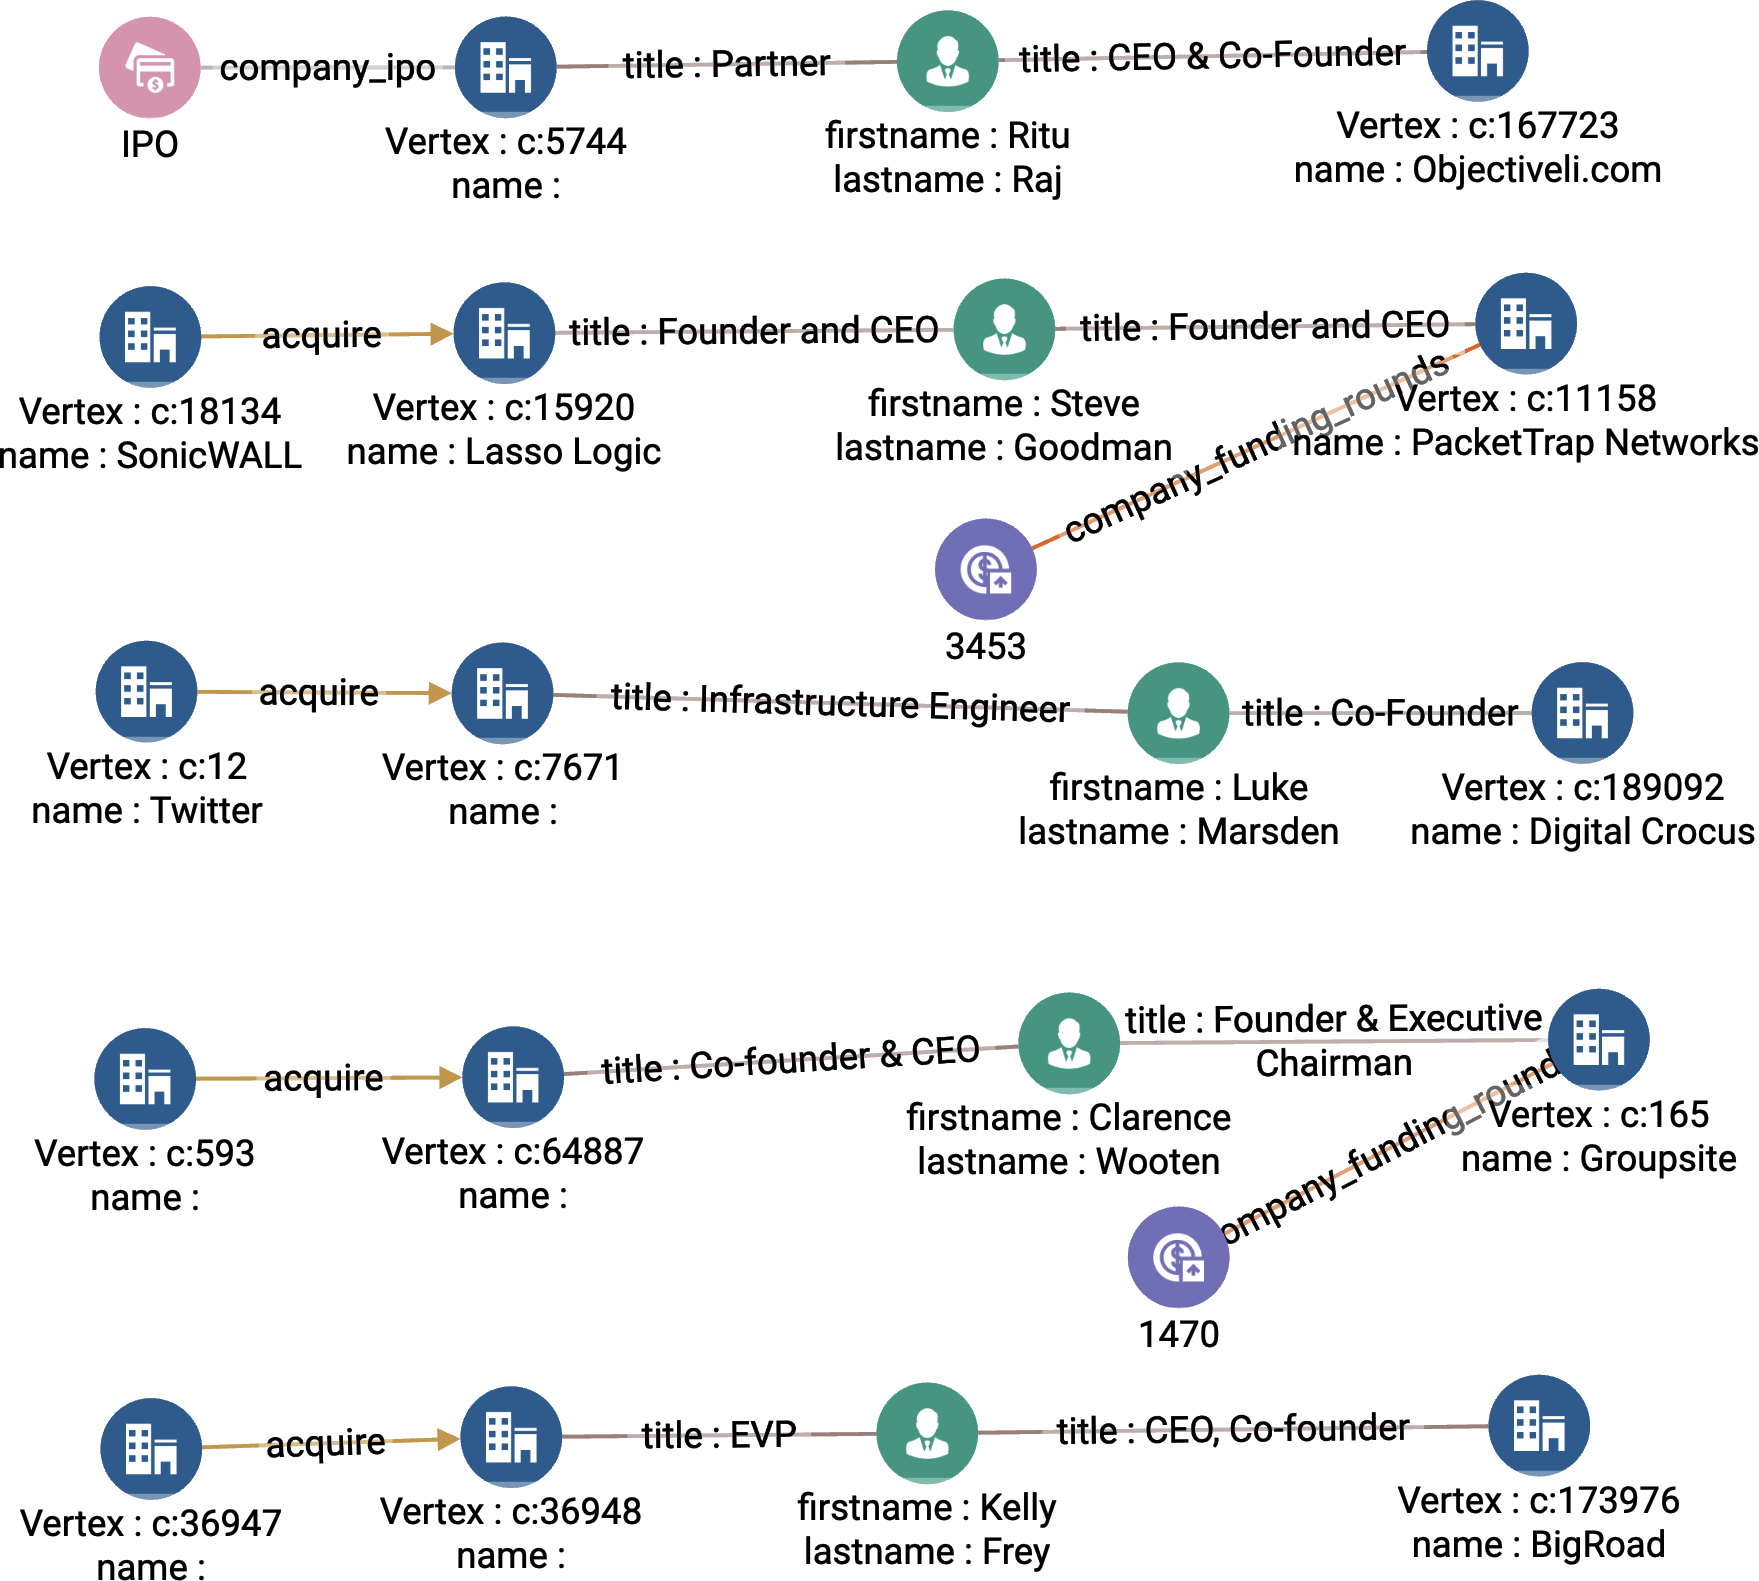
Figure 4-10. Graph output of top startups based on leader (see a larger version of this figure at https://oreil.ly/gpam0410)
Chapter Summary
In this chapter, we have seen how we can use graph analytics to answer important questions and gain valuable insight about startup investments. Looking at the graph schema for Crunchbase data, we’ve seen that such data is highly interconnected. In the case of investment advice, we often look to past performance as an indicator of possible future results. So we look for one pattern (success in the past) and see if there is potential for a repeat of that pattern. This type of pattern search or similarity search is typical of graph analytics.
We have discussed four queries in this chapter to identify those patterns that can help us investigate investment opportunities. The first query identifies all persons with key roles within a company. The second query identifies successful startup exits from an investor. The third query shows us a ranking of startups with successful board members. The fourth query shows us a ranking of startups with successful founders. Each query demonstrated how multihops are utilized to benefit our analyses.
This chapter demonstrated several GSQL language features and techniques, such as:
-
Using a
WHILEloop to search multiple levels deep -
Tagging vertices with a Boolean accumulator to mark that it has been visited
-
During multistep traversal, tagging vertices with a
parent_vertexand aparent_edgeto serve as breadcrumbs, so we can recover our paths later -
Using the
ORDER BYandLIMITclauses in aSELECTblock to find the top-ranked vertices, similar to selecting the top-ranked records in SQL
1 Alex Wilhelm, “In 2020, VCs Invested $428M into US-Based Startups Every Day,” TechCrunch, January 19, 2021, https://techcrunch.com/2021/01/19/in-2020-vcs-invested-428m-into-us-based-startups-every-day.
2 Sandeep Babu, “STARTUP STATISTICS—The Numbers You Need to Know,” Small Business Trends, March 28, 2023, https://smallbiztrends.com/2022/12/startup-statistics.html.
3 Accumulators were described in Chapter 3.
4 We are analyzing Crunchbase’s 2013 data. A few of these startups did succeed; others did not.
Get Graph-Powered Analytics and Machine Learning with TigerGraph now with the O’Reilly learning platform.
O’Reilly members experience books, live events, courses curated by job role, and more from O’Reilly and nearly 200 top publishers.

