Appendix B. R Colors
You can obtain a display of 657 named R colors by using the following command:
> demo(colors)
For a list of the color names, use this command:
> colors()
The following script produced the color table shown in Figure B-1 (I included it here so that you can reproduce if it you want to print your own copy):
# Script to produce color chart
par(col.axis="white",col.lab="white", mar=c(0.1,0.1,0.4,0.1),
  xaxt="n",yaxt="n")

n = c(0:656)  # a number for each color
n2 = (n %%73)  # each color has a number (1 to 73) in its column
cc = t(colors())  # color names
k = (2:9)  # a number for each column
x=rep(c(1),times=73)

for(i in k) {
r = rep(c(i),times=73)
x = (c(x,r))
}

# print, at (x,n2), color rectangle
plot(x,n2,col=cc,pch=15,
xlim=c(0,10),
ylim=c(0,73),
bty="n",
main="Named colors available in R",cex.main=.65)

x1 = x+ 0.5
text(x1,n2,cc,cex=.4)  # print (at x1,n2), the color name vector
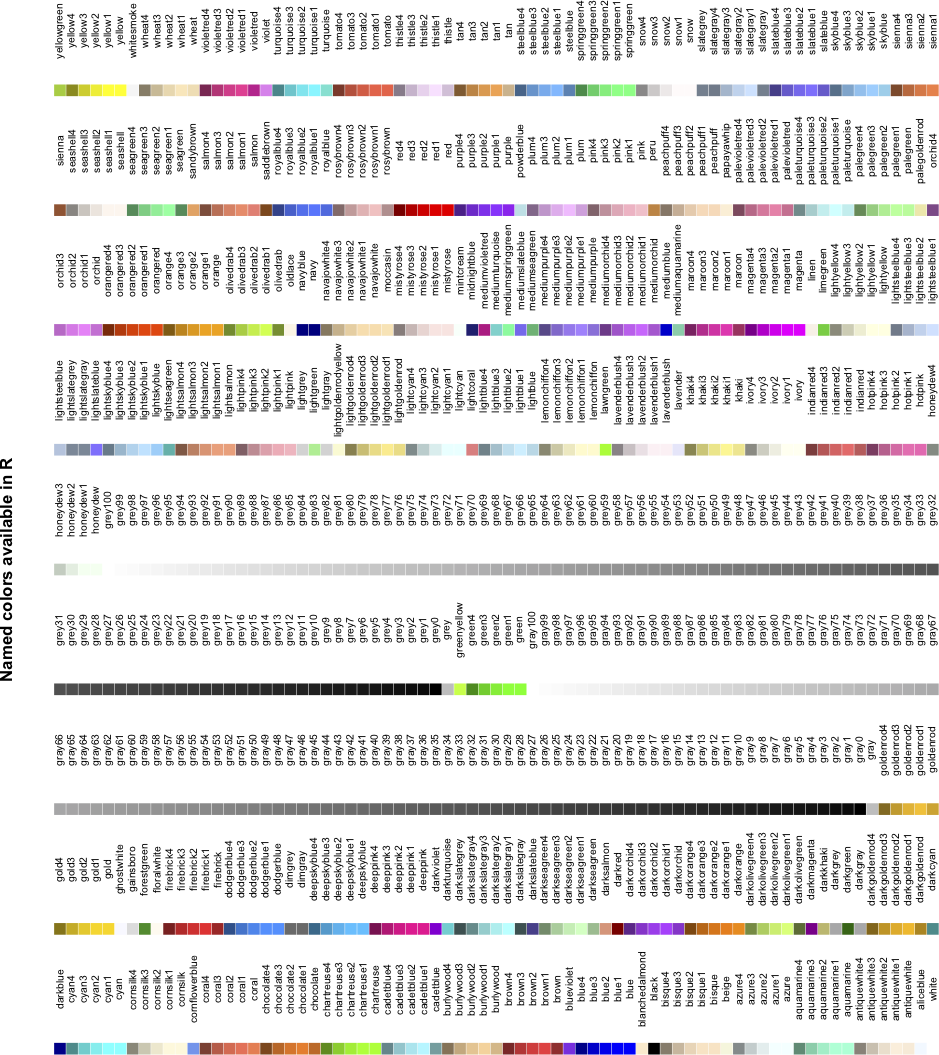
Figure B-1. 657 named colors.
A nice R color chart by Professor Tian Zheng of Columbia University is available on the Internet at http://www.stat.columbia.edu/~tzheng/files/Rcolor.pdf.
Get Graphing Data with R now with the O’Reilly learning platform.
O’Reilly members experience books, live events, courses curated by job role, and more from O’Reilly and nearly 200 top publishers.

