In this section, we will look at QlikView charts. We will cover bar charts, and then we will look at how we can switch between chart types. The bar chart is the chart that is used most frequently in pretty much every dashboard that you will see, and you will learn how you can create it in QlikView:
- To do this, let's move on to QlikView. We can right-click on the dashboard, go to New Sheet Object, and click on the Chart option. This will give you the following window:
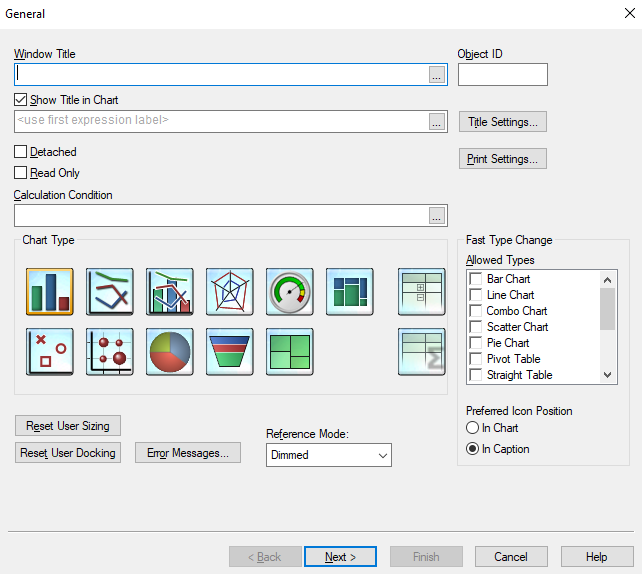
You can see the various types of charts available there.
- We will select Bar Chart, and click on Next.
- Then, we will choose the dimension that we want to display ...

