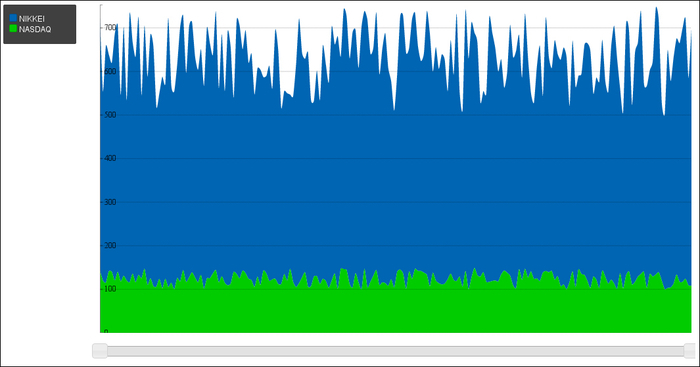
Making a live range chart filter
When working with large amounts of data, we usually want to add some way of filtering or picking up what data to show. This recipe will cover a simple range filter for the graph and a chart that displays time-varying series of data.
Getting ready
We will be using the same toolkit from the Making a motion chart recipe for creating interactive graphs. The necessary library Rickshaw can be retrieved from http://code.shutterstock.com/rickshaw/, and is part of the example code as well. Besides that we also need D3, because Rickshaw works on top of it.
How to do it...
We will create an HTML page containing a JavaScript file ...
Get HTML5 Data and Services Cookbook now with the O’Reilly learning platform.
O’Reilly members experience books, live events, courses curated by job role, and more from O’Reilly and nearly 200 top publishers.

