42Using Binomials Too
Let's look at the results of a simple regression model with the scaled variable weight as ![]() and the binomial variable sex as
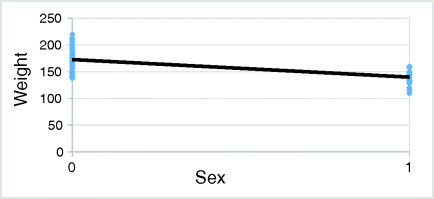
and the binomial variable sex as ![]() . First, look at the (strange looking) scatterplot in Figure 42.1. All the male weights are bunched at
. First, look at the (strange looking) scatterplot in Figure 42.1. All the male weights are bunched at ![]() and all the female weights are bunched at
and all the female weights are bunched at ![]() . The regression line will go through the average weight for males and the average weight for females because that is the least-squares fit.1
. The regression line will go through the average weight for males and the average weight for females because that is the least-squares fit.1

How can we interpret the slope of this regression line? Rise/run, where the rise is the difference between the sample mean weight for males and the sample mean weight for females, and the run is 1. The slope, then, is simply the difference in the sample means. That is what ![]() will be. And the -intercept, ...
will be. And the -intercept, ...
Get Illuminating Statistical Analysis Using Scenarios and Simulations now with the O’Reilly learning platform.
O’Reilly members experience books, live events, courses curated by job role, and more from O’Reilly and nearly 200 top publishers.

